 Vol.2, No.6, 367-373 (2009) doi:10.4236/jbise.2009.26053 SciRes Copyright © 2009 Openly accessible at http://www.scirp.org/journal/JBISE/ JBiSE Analysis and prediction of exon, intron, intergenic region and splice sites for A. thaliana and C. elegans genomes Hao Lin1,2*, Qian-Zhong Li1, Cui-Xia Chen1,3 1Laboratory of Theoretical Biophysics, Department of Physics, College of Sciences and Technology, Inner Mongolia University, Hohhot, China; 2Center of Bioinformatics, School of Life Science and Technology, University of Electronic Science and Technology of China, Chengdu, China; 3CapitalBio Corporation, Beijing, China; *Correspondence should be addressed to Hao Lin. Email: hlin@uestc.edu.cn Received 18 June 2008; revised 31 May 2009; accepted 8 June 2009. ABSTRACT Although a great deal of research has been un- dertaken in the area of the annotation of gene structure, predictive techniques are still not fully developed. In this paper, based on the cha- racteristics of base composition of sequences and conservative of nucleotides at exon/intron splicing site, a least increment of diversity al- gorithm (LIDA) is developed for studying and predicting three kinds of coding exons, introns and intergenic regions. At first, by selecting the 64 trinucleotides composition and 120 position parameters of the four bases as informational parameters, coding exon, intron and intergenic sequence are predicted. The results show that overall predicted accuracies are 91.1% and 88.4%, respectively for A. thaliana and C. ele- gans genome. Subsequently, based on the po- sition frequencies of four kinds of bases in re- gions near intron/coding exon boundary, initia- tion and termination site of translation, 12 posi- tion parameters are selected as diversity source. And three kinds of the coding exons are pre- dicted by use of the LIDA. The predicted suc- cessful rate s are higher than 80%. These results can be used in sequence annotation. Keywords: Exon; Intron; Intergenic Region; Splice Site; Increment of Diversity 1. INTRODUCTION With the completion of the genomes sequencing, more and more efforts were being put into understanding the functional elements encoded in a genome [1,2,3,4,5,6]. Annotation of gene structure in eukaryotic genomes cur- rently involves both computational and experimental approaches [7,8,9,10]. Driven by this explosion of ge- nome data and a need to analyze draft data quickly, genefinding programs have also proliferated, particularly those that were designed for specific organisms [11,12, 13,14,15]. However, the accuracy was still far from sat- isfaction [16]. Gene prediction methods can be generally classified as composition-based and similarity-based methods. Composition-based methods, also called ab initio gene- finding method, contain two important aspects: type of information and the algorithm. Most types of informa- tion measure either codon usage bias, base composi- tional bias between codon positions or splice site as well as periodicity in base occurrence. Several sophisticated algorithms that deduce the presence of a gene feature using signals and content information have been devised including GenScan [17], Fgenes [18], Genie [19] and MZEF [20]. Although some satisfactory results were obtained by using above software, a considerable pro- portion of missing or incorrect exon and over predictions were found by using an experimentally validated dataset of some genomic sequences [21]. On the other hand, most ab initio gene prediction programs performed pre- diction based on large parameters. For example, 12,288 parameters were needed by GeneMark [22]. It will de- duce unreliable prediction results for small genome [23]. Similarity-based methods such as Genewise [24] and Procrustes [25] predicted a gene relied on homolog se- quences. These methods showed a high sensitivity and specificity for predicting genes whose sequence is closely related to the known input sequence. But some species-specific genes are likely to be missed [7]. In or- der to improve prediction, the programs of combing protein sequence similarity with ab inito gene-finding algorithms such as GenomeScan [26] were proposed. Despite great progress, the experiment highlighted errors  H. Lin et al. / J. Biomedical Science and Engineering 2 (2009) 367-373 SciRes Copyright © 2009 Openly accessible at http://www.scirp.org/journal/JBISE/ 368 with the various predictions and indicated that both types of gene prediction programs are currently unable to de- termine whole gene structures consistently [27]. Although programs for splice site and gene structure recognition have reached a high level of performance on internal coding exons, standard splice sites might not be sufficient for defining introns in the genomes [28]. And prediction of splice sites in non-coding regions of genes is one of the most challenging aspects of gene structure recognition. The distinguishing intergenic region from intron should be very useful to understand the features of the noncoding and regulatory regions. In addition, find- ing first exons still remains a challenge, except where the true full-length mRNA sequences are available. Un- fortunately, most of the available mRNA sequences are incomplete at their 5’ends and do not provide informa- tion about first exons. Apparently, the recognition of exon, intron and intergenic DNA at the meanwhile is very helpful for gene recognition. Specially, it is diffi- culty to distinguish intron from intergenic sequence in past algorithm. In this paper, our goal is to provide a new computa- tional method to predict gene structure base on least in- crement of diversity algorithm (LIDA). The diversity measure was first introduced and employed in biological classification [29]. It is a kind of information description on state space and a measure of whole uncertainty and total information of a system derived from information theory. To compare the similarity of two sources, one defines the increment of diversity (ID) by the difference of the total diversity measure of two systems and the diversity measure of the mixed system. It can be proved that the higher the similarity of two sources, the smaller the ID. So, the increment of diversity of two sources is essentially a measure of their similarity level. Here, according to the theory of diversity, we firstly predict coding exons, introns and intergenic sequences of A. thaliana and C. elegans based on the analysis of the compositional differences in near splice sites and conserved sequence segments of the three kinds of se- quences (exons, introns and intergenic sequences) in the complete genome of these two model organisms. Sub- sequently, three kinds of coding exons (first coding ex- ons, internal coding exons and last coding exons) are predicted by use of the least increment of diversity algo- rithm. It may be useful for improving the prediction of splice sites. 2. EXPERIMENTAL 2.1. Data Sample The A. thaliana and C. elegans genomic DNA sequences are obtained from Genbank. The coding exons, introns and intergenic sequences are respectively extracted from the above genomes. According to the length distribution, we divide all sequences of one chromosome into three types of subsets. The ranges of three subsets are respec- tively (30-200bp), (200-500bp) and (>=500bp) for exon and intron sequences, (30-2000bp), (2000-5000bp) and (>=5000bp) for intergenic sequences. The 15609 first coding exons, 67408 internal coding exons and 15791 last coding exons are extracted from A. thaliana complete genome. The 10904 first coding exons, 87743 internal coding exons and 11035 last coding ex- ons are extracted from C. elegans complete genome. The subsequences with 9 bases length flanking 5’ boundary sites (from –5th site to +4th site) and 3’ boundary sites (from –4th site to +5th site) are meanwhile extracted re- spectively from above genome sequences. 2.2. Least Increment of Diversity Algorithm (LIDA) Due to increment of diversity (ID) can measure incre- ment of whole uncertainly (or information) between two data sources, it has been widely applied in bioinformat- ics investigation, such as protein structural class predic- tion [30], subcellular location of apoptosis protein [31] and secretory protein prediction [32]. For the purpose of improving prediction capability, ID combined with other predictive model was applied in exon/introns splice site prediction [33], human PolII promoter prediction [34] and protein predictions [35,36,37,38,39,40,41,42]. For reader’s conveniences, the theory of diversity is intro- duced as follows. Definition 1. For a state space X{n1,n2,…,ns} consist- ing of s information symbols, if ni indicates the numbers of the i-th state, then the diversity for diversity source X:[n1, n2,…, ns] is defined as [30], s iis nnNNnnnDXD 1 21 loglog),...,,()( (1) here s ii nN . It is easily proved that the diversity equals N fold of information entropy [43]. Definition 2. If there are two sources of diversity in the same space of s dimension, X:[n1, n2,…, ns] and Y:[m1, m2,…, ms], we may define the increment of diver- sity as )()()(),( YDXDYXDYX (2) where D(X+Y) is the measure of diversity of the mixed source X+Y:[n1+ m1, n2+ m2,…, ns+ ms]. Note that ),( YX is a function of two sources. It is easily proved that the increment of diversity [Eq.(2)] is nonnegative and symmetry. Therefore, is regarded as a quantitative measure of the similarity level of two inde- pendence systems. ),( YX  H. Lin et al. / J. Biomedical Science and Engineering 2 (2009) 367-373 SciRes Copyright © 2009 Openly accessible at http://www.scirp.org/journal/JBISE/ 369 2.3. Prediction of Exon, Intron and Intergenic Sequence One DNA sequence can be represented by a diversity source: X: [Si,, Njk , Mlk ], where Si means the absolute frequency of the i-th trinucleotide in the sequence (i=1,2,…,43); Njk means the absolute frequency of base k at the j-th position from the beginning of 5’ boundary (j=1, 2, …, 15), Mlk means the absolute frequency of bases k at the l-th position from the end of 3’ boundary, (l=–1, –2, …, –15). By calculating above 180 (43+15×4+15×4) parameters of exons, introns and inter- genic sequences in standard sets (training sets), we de- duce three standard sources of diversity: [ X,, 21 nn 1 4 ...n ie ,, ] in the state space of 184 dimensions. (here g indicates respectively the exon, intron and intergenic sequence.) Three standard measures of diver- sity can be deduced by use of similar equations as Eq.(1), namely k kknnNNXD loglog)( 184 1 (3) where = (k=1, 2, …, 184), ( N 184 1kk n gie ,, ). Suppose that X is a DNA sequence whose class is to be predicted. In the same state space, the measure of diversity of sequence X can be expressed as: k kkmmMMXD loglog)( 184 1 (4) where (k=1, 2, …, 184). 184 1kk mM The increments of diversity between the diversity source X: [] and the three standard diver- sity sources : [], (here 18421 ,..., mmm X 21 ,nn 184 ,...ngie ,, ) are )()()(),( XDXDXXDXX (gie ,, ) (5) Sequence X can be predicted to be the class for which the corresponding increment of diversity has the mini- mum value, and can be formulated as follows. )},(),,(),,({Min),( XXXXXXXX gie (6) where ξ can be e, i or g and the operator Min means taking the minimum value among those in the parenthe- ses, then the ξ in Eq.(6) will give the sequence class to which the predicted sequence X should belong. 2.4. Prediction of Three Kinds of Coding Exons For each coding exon, the following three kinds of codon positions are investigated to select optimal pa- rameters. 1) The three bases before the 5/ boundary sites of ex- ons (acceptor sites) and after the 3/ boundary sites of exons (donor sites) are chosen as information parameters of diversity source. AGA GCA↑ATG G……A TGC↑GTA AGA 2) The three bases after the 5/ boundary sites of exons (acceptor sites) and before the 3/ boundary sites of exons (donor sites) are chosen as information parameters of diversity source. AGA GCA↑ATG G……A TGC↑GTA AGA 3) The six bases flanking the 5/ boundary sites of ex- ons (acceptor sites) and the 3/ boundary sites of exons (donor sites) are chosen as information parameters of diversity source. AGA GCA↑ATG G……A TGC↑GTA AGA (where↑indicates the 5’ or 3’ exon boundary sites) By calculating the absolute frequencies of four bases in above positions near splice sites of first coding exons, internal coding exons and last coding exons, we deduce three standard sources of diversity :{ ∣j=1,2,3; a=A,C,G,T} in the state space of 12 dimensions (here X ja N lif ,, corresponding to first coding exon, internal coding exon and last coding exon, respectively). Then, three standard measures of diversity for three coding exons can be calculated by Eq.(1), namely: k kknnNNXD loglog)( 12 1 (7) where (k=1, 2, …, 12). 12 1 kk nN Suppose that S is an exon whose class is to be pre- dicted. In the same state space, the measure of diversity can be expressed as: k kkmmMMSDloglog)( 12 1 (8) According to Eq.(2), the increments of diversity be- tween source S and three standard sets are )()()(),( XDSDXSDXS (lif,, ) (9) Exon (S) can be predicted to be the class for which the corresponding increment of diversity has the minimum value, can be formulated as follows )},(),,(),,({Min),( SXSXSXSX lif (10) where ξ can be f, i or l and the operator Min means tak- ing the minimum value among those in the parentheses, then the ξ in Eq.(9) will give the class to which the pre- dicted coding exon S should belong. 3. RESULTS 3.1. Evaluating Predicted Performance of Proposed Method In order to evaluate the correct prediction rate and reli- ability of a predictive method, the sensitivity (Sn), speci-  H. Lin et al. / J. Biomedical Science and Engineering 2 (2009) 367-373 SciRes Copyright © 2009 http://www.scirp.org/journal/JBISE/ 370 ficity (Sp) and correlation coefficient (CC) are defined by 3.2. The Prediction of Exon, Intron and Intergenic Sequence )/( FNTPTPS n )/( FPTPTPS p Approximate 1/2 sequences of standard sets (training sets) and 1/2 testing sets are randomly chosen by com- puter programs from the corresponding subset. In order to eliminate the dependence of the predictive results on the training dataset, the standard set (training set) are randomly selected 10 times. The numbers of the known coding exons, introns and intergenic sequences are shown in Table 1. )()()()( )()( FPTNFNTPFNTNFPTP FNFPTNTP CC For a given sequence class , TP denotes the number of the sequences correctly predicted to be in class se- quences (true positive), FP denotes the number of the sequences incorrectly predicted to be in class se- quences (false positive), TN denotes the number of the sequences correctly predicted to be in non- class se- quences (true negatives), FN denotes the number of the sequences incorrectly predicted to be in non- class se- quences (false negative). Sensitivity shows the rate of correct prediction. Specificity shows the confidence level for predictive method. The correlation coefficient (CC) affects the entirely performance of the prediction algorithm. Based on the Eq.(6), the three classes of sequences are predicted by use of the 184 information parameters. In order to compare prediction quality of different in- formation parameters, we perform our algorithm to pre- dict exons, introns and intergenic sequences using 64 trinucleotides. The contrast results of test sets between 64 and 184 signals parameters for A. thaliana (A) and C. elegans (C) are shown in Table 2. Table 1. The length-distribution of three kinds of sequences in the chromosomes of the two model species. Standard set Test set Genome class 1st subset 2nd subset3rd subsettotal 1st subset2nd subset 3rd subset total Exon 15229 4723 2126 22728 14982 4868 2417 22267 Intron 16130 3183 919 20329 16181 3405 870 20456 A.thaliana Chr1~4 Intergenic 6109 2525 1109 9747 6742 2490 1105 10337 Exon 10507 4896 1002 16739 12214 4809 1034 18057 Intron 12181 2859 2283 17354 13217 2935 2317 18469 C.elegans Chr1~6 Intergenic 5023 1446 1109 7617 5483 1598 1086 8167 Table2. The results for test set with 64 and 184 signals of A. thaliana and C. elegans. A. thaliana C. elegans No. of signals Class of exon Sn (%) Sp (%) CC (%) Sn (%) Sp (%) CC (%) Exon 85 (95, 98) 94 (96, 95) 83 (92, 93) 73 (78, 88) 89 (95, 95) 70 (74, 89) Intron 85 (81, 73) 89 (91, 83) 78 (80, 73) 92 (75, 67) 87 (78, 87) 81 (66, 57) 64 Intergenic 86 (92, 83) 65 (78, 80) 69 (79, 75) 66 (65, 78) 53 (41,50) 50 (39,47) Exon 84 (91, 94) 96 (98, 98) 84 (90,91) 73 (76,84) 92 (98, 98) 73 (76, 88) Intron 98 (98, 99) 88 (87, 79) 88 (88, 85) 99 (99,100) 90 (85,93) 91 (88, 92) 184 Intergenic 88 (90, 84) 89 (94,95) 86 (90, 86) 79 (85, 87) 65 (63,90) 65 (67, 85) The number outside the bracket denotes the predicted results for the 1st subset. Two numbers in bracket, respectively, denotes the predicted results for the 2nd subset and the 3rd subset. Openly accessible at 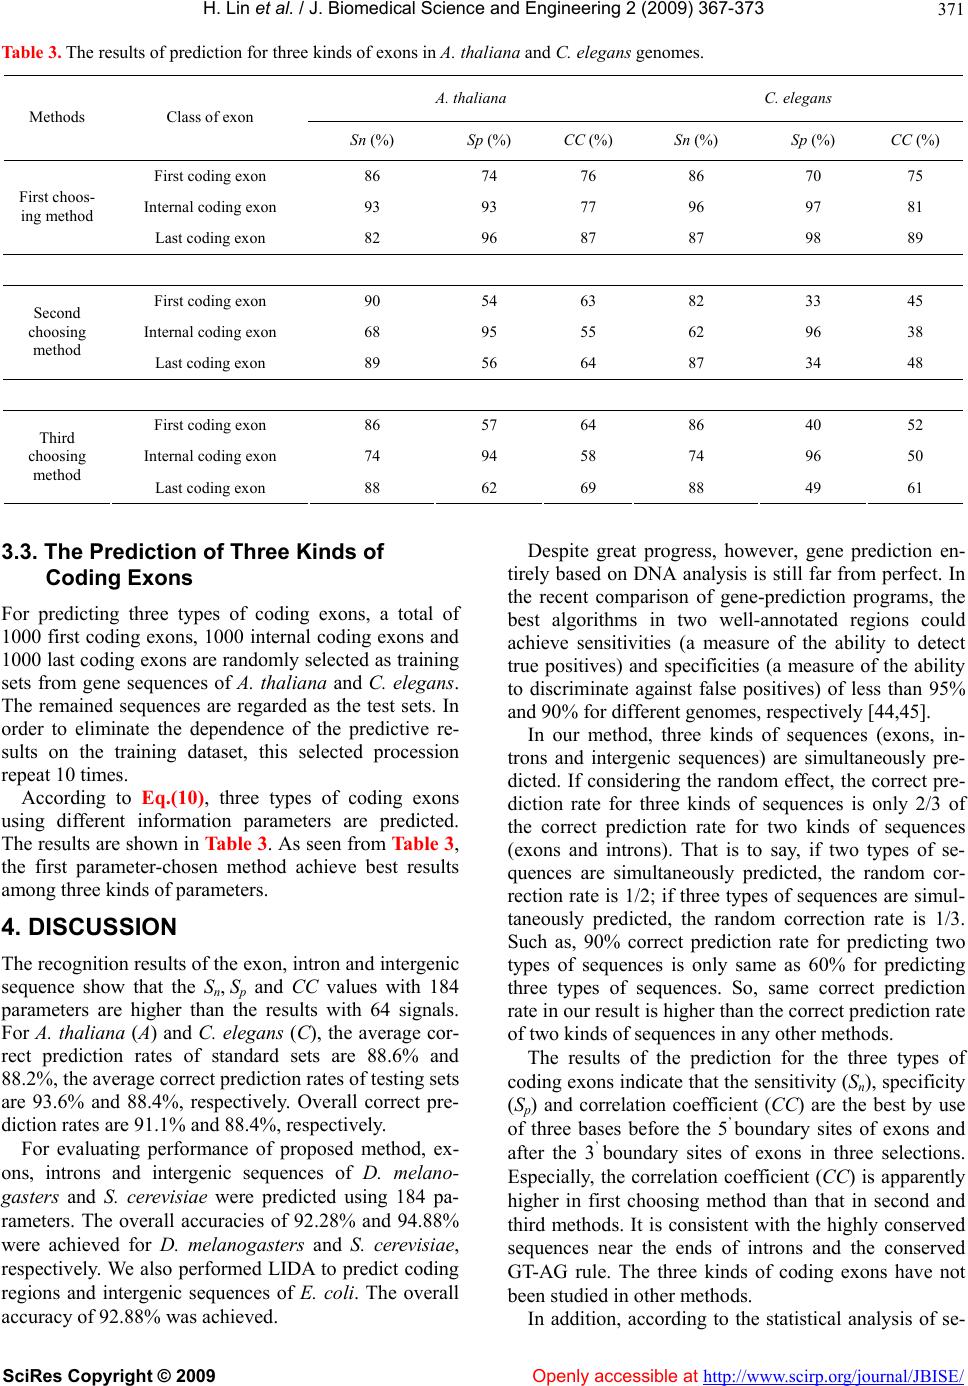 H. Lin et al. / J. Biomedical Science and Engineering 2 (2009) 367-373 SciRes Copyright © 2009 Openly accessible at http://www.scirp.org/journal/JBISE/ 371 Table 3. The results of prediction for three kinds of exons in A. thaliana and C. elegans genomes. A. thaliana C. elegans Methods Class of exon Sn (%) Sp (%) CC (%) Sn (%) Sp (%) CC (%) First coding exon 86 74 76 86 70 75 Internal coding exon 93 93 77 96 97 81 First choos- ing method Last coding exon 82 96 87 87 98 89 First coding exon 90 54 63 82 33 45 Internal coding exon 68 95 55 62 96 38 Second choosing method Last coding exon 89 56 64 87 34 48 First coding exon 86 57 64 86 40 52 Internal coding exon 74 94 58 74 96 50 Third choosing method Last coding exon 88 62 69 88 49 61 3.3. The Prediction of Three Kinds of Coding Exons For predicting three types of coding exons, a total of 1000 first coding exons, 1000 internal coding exons and 1000 last coding exons are randomly selected as training sets from gene sequences of A. thaliana and C. elegans. The remained sequences are regarded as the test sets. In order to eliminate the dependence of the predictive re- sults on the training dataset, this selected procession repeat 10 times. According to Eq.(10), three types of coding exons using different information parameters are predicted. The results are shown in Tabl e 3. As seen from Table 3, the first parameter-chosen method achieve best results among three kinds of parameters. 4. DISCUSSION The recognition results of the exon, intron and intergenic sequence show that the Sn, Sp and CC values with 184 parameters are higher than the results with 64 signals. For A. thaliana (A) and C. elegans (C), the average cor- rect prediction rates of standard sets are 88.6% and 88.2%, the average correct prediction rates of testing sets are 93.6% and 88.4%, respectively. Overall correct pre- diction rates are 91.1% and 88.4%, respectively. For evaluating performance of proposed method, ex- ons, introns and intergenic sequences of D. melano- gasters and S. cerevisiae were predicted using 184 pa- rameters. The overall accuracies of 92.28% and 94.88% were achieved for D. melanogasters and S. cerevisiae, respectively. We also performed LIDA to predict coding regions and intergenic sequences of E. coli. The overall accuracy of 92.88% was achieved. Despite great progress, however, gene prediction en- tirely based on DNA analysis is still far from perfect. In the recent comparison of gene-prediction programs, the best algorithms in two well-annotated regions could achieve sensitivities (a measure of the ability to detect true positives) and specificities (a measure of the ability to discriminate against false positives) of less than 95% and 90% for different genomes, respectively [44,45]. In our method, three kinds of sequences (exons, in- trons and intergenic sequences) are simultaneously pre- dicted. If considering the random effect, the correct pre- diction rate for three kinds of sequences is only 2/3 of the correct prediction rate for two kinds of sequences (exons and introns). That is to say, if two types of se- quences are simultaneously predicted, the random cor- rection rate is 1/2; if three types of sequences are simul- taneously predicted, the random correction rate is 1/3. Such as, 90% correct prediction rate for predicting two types of sequences is only same as 60% for predicting three types of sequences. So, same correct prediction rate in our result is higher than the correct prediction rate of two kinds of sequences in any other methods. The results of the prediction for the three types of coding exons indicate that the sensitivity (Sn), specificity (Sp) and correlation coefficient (CC) are the best by use of three bases before the 5’ boundary sites of exons and after the 3’ boundary sites of exons in three selections. Especially, the correlation coefficient (CC) is apparently higher in first choosing method than that in second and third methods. It is consistent with the highly conserved sequences near the ends of introns and the conserved GT-AG rule. The three kinds of coding exons have not been studied in other methods. In addition, according to the statistical analysis of se-  H. Lin et al. / J. Biomedical Science and Engineering 2 (2009) 367-373 SciRes Copyright © 2009 Openly accessible at http://www.scirp.org/journal/JBISE/ 372 quences in the region near splicing sites, we find there are some special preferences for certain bases. The re- sults show that the sequence of the near splice site region is strongly conserved. Except the GT-AG rule, there is a strong bias of base G in the -4th site from the 3’ term of introns for A. thaliana genome, but the base T is biased in the same site for C. elegans genome. The stop codons of the two model species bias TAA, and the bases GT and AT are biased in the two sites after the stop codon for A. thaliana and C. elegans genomes, respectively. It may be a possible signal for stopping translation. The base A is biased at positions –4, –2 and –1 before trans- lation start sites. And the bases G and A are respectively biased in the 4-th site after translation start sites (TSS). These biases may be relative to the translation start sig- nals. In addition, the base bias of the 1-st sites of the 5’ term within internal coding exons and last coding exons is different for A. thaliana from C. elegans genomes. The base G is biased by the A. thaliana, base A is biased by C. elegans. By the further statistics of the base pairs in the bound- ary region of exons, the first coding exons and internal coding exons in A. thaliana and C. elegans genomes are generally ended by AG. The internal coding exons and last coding exons in A. thaliana genome are generally started by GT, but the two exons in C. elegans genome are generally started by AT. It is possible additional in- formation for splice sites. These results may be very useful to improve correct prediction rate of splice sites. 5. CONCLUSIONS This paper proposed a novel algorithm-increment of diversity for gene structure prediction. This algorithm may be deduced from information entropy. It is well known that the mutual information can describe how to extract information regarding b from source a if the con- ditional probability p(b|a) is known [33]. But ID is dif- ferent from mutual information. It can describe incre- ment of complication between two informational sources. Our prediction results also exhibit that ID is a promising method. 6. ACKNOWLEDGEMENTS The authors thank Professor C. J. Benham and Dr. H.Q. Wang in UCDavis for helpful discussions. The work was supported by National Science Foundation of China, No. 30560039. REFERENCES [1] J. L. Ashurst and J. E. Collins, (2003) Gene annotation: Prediction and testing, Annu. Rev. Genomics Hum Genet, 4, 69–88. [2] M. Nowrousian, C. Würtz, S. Pöggeler, and U. Kück, (2004) Comparative sequence analysis of Sordaria mac- rospora and Neurospora crassa as a means to improve genome annotation, Fungal Genetics and Biology, 41, 285–292. [3] E. Eden and S. Brunak, (2004) Analysis and recognition of 5’UTR intron splice sites in human Pre-mRNA, Nu- cleic Acids Res, 32, 1131–1142. [4] M. Kozak, (2006) Rethinking some mechanisms invoked to explain translational regulation in eukaryotes, Gene, 382, 1–11. [5] H. A. Meijer and A. A. M. Thomas, (2002) Control of eukaryotic protein synthesis by upstream open reading frames in the 5’-untranslated region of an mRNA, Bio- chem. J., 367, 1–11. [6] F. B. Guo and X. J. Yu, (2007) Re-prediction of pro- tein-coding genes in the genome of Amsacta moorei en- tomopoxvirus, Journal of Virological Methods, 146, 389– 392. [7] F. B. Guo and C. T. Zhang, (2006) ZCURVE_V: A new self-training system for recognizing protein-coding genes in viral and phage genomes, BMC Bioinformatics, 7, 9. [8] Y. H. Qiao, J. L. Liu, C. G. Zhang, X. H. Xu, and Y. J. Zeng, (2005) SVM classification of human intergenic and gene sequences, Mathematical Biosciences, 195, 168–178. [9] V. Brendal, L. Xing, and W. Zhu, (2004) Gene structure prediction from consensus spliced alignment of multiple ESTs matching the same genomic locus, Bioinformatics, 20, 1157–1169. [10] S. Karlin, J. Mrázek, and A. J. Gentles, (2003) Genome comparisons and analysis, Current Opinion in Structural Biology, 13, 344–352. [11] S. Gopal, G. A. M. Cross, and T. Gaasterland, (2003) An organism-specific method to rank predicted coding re- gions in Trypanosoma brucei, Nucleic. Acids Res., 31, 5877–5885. [12] S. D. Schlueter, Q. Dong, and V. Brendel, (2003) Gene- Seqer@PlantGDB: Gene structure prediction in plant genomes, Nucleic. Acids Res., 31, 3597–3600. [13] J. E. Moore and J. A. Lake, (2003) Gene structure pre- diction in syntenic DNA segments, Nucleic. Acids Res., 31, 7271–7279. [14] J. Wang, et al., (2003) Vertebrate gene predictions and problem of large genes, Nature Reviews Genetics, 4, 741–749. [15] F. Gao and C. T. Zhang, (2004) Comparison of various algorithms for recognizing short coding sequences of human genes, Bioinformatics, 20, 673–681. [16] M. Q. Zhang, (2002) Computational prediction of eu- karyotic protein-coding genes, Nature Reviews Genetics, 3, 698–709. [17] Burge, C. and Karlin, S. (1997) Prediction of complete gene structures in human genomic DNA, J. Mol. Biol., 268, 78-94. [18] V. V. Solovyev, A. A. Salamov, and C. B. Lawrence, (1995) Identification of human gene structure using lin- ear discriminant functions and dynamic programming, Proc. Int. Conf. Intell. Syst. Mol. Biol., 3, 367–375. [19] M. G. Reese, D. Kulp, H. Tammana, and D. Haussler, (2000) Genie-Gene finding in Drosophila melanogaster, Genome. Res., 10, 529–538. [20] S. Rogic, A. K. Mackworth, and F. B. Ouellette, (2001) Evaluation of gene-finding programs on mammalian se- quences, Genome. Res., 11 , 817–832. [21] M. Q. Zhang, (1997) Identification of protein coding regions in human genome by quadratic discriminant ana-  H. Lin et al. / J. Biomedical Science and Engineering 2 (2009) 367-373 SciRes Copyright © 2009 http://www.scirp.org/journal/JBISE/Openly accessible at 373 lysis, Proc. Natl. Acad. Sci., USA, 94, 565–568. [22] J. Besemer, A. Lomsadze, and M. Borodovsky, (2001) GeneMarkS: A self-training method for prediction of gene starts in microbial genomes, implications for ®nding sequence motifs in regulatory regions, Nucleic. Acids. Res., 29, 2607–2618. [23] F. B. Guo, H. Y. Ou, and C. T. Zhang, (2003) ZCURVE: a new system for recognizing protein-coding genes in bacterial and archaeal genomes, Nucleic. Acids. Res., 31, 1780–1789. [24] E. Birney and R. Durbin, (2000) Using GeneWise in the Drosophila annotation experiment, Genome. Res., 10, 547–548. [25] M. S. Gelfand, et al., (1996) Gene recognition via spli- ced sequence alignment, Proc. Natl. Acad. Sci., USA, 93, 9061–9066. [26] R. F. Yeh, L. P. Lim, and C. B. Burge, (2001) Computa- tional inference of homologous gene structures in the human genome, Genome. Res., 11, 803–816. [27] I. M. Meyer and R. Durbin, (2004) Gene structure con- servation aids similarity based gene prediction, Nucleic. Acids. Res., 32, 776–783. [28] L. P. Lim and C. B. Burge, (2001) A computational analysis of sequence features involved in recognition of short introns, Proc. Natl. Acad. Sci., USA, 98, 11193– 11198. [29] R. R. Laxton, (1978) The measure of diversity, J. Theor. Biol., 70, 51–67. [30] Li, Q. Z. and Lu, Z. Q., (2001) The prediction of the structural class of protein: Application of the measure of diversity, J. Theor. Boil., 213, 493-502. [31] Chen, Y. L. and Li, Q. Z., (2007) Prediction of the sub- cellular location of apoptosis proteins, J. Theor. Biol., 245, 775-783. [32] Y. C. Zuo and Q. Z. L, (2009) Using K-minimum incre- ment of diversity to predict secretory proteins of malaria parasite based on groupings of amino acids, Amino Acids, DOI 10.1007/s00726-009-0292-1. [33] L. R. Zhang and L. F. Luo, (2003) Splice site prediction with quadratic discriminant analysis using diversity mea- sure, Nucleic. Acids. Res., 31, 6214–6220. [34] J. Lu and L. F. Luo, (2005) Human polII promoter pre- diction, Prog. Biochem. Biophys., 32, 1185–1191. [35] H. Lin and Q. Z. Li, (2007) Predicting conotoxin super- family and family by using pseudo amino acid composi- tion and modified Mahalanobis discriminant, Biochem. Biophys. Res. Commun., 354, 548–551. [36] H. Lin, and Q. Z. Li, (2007) Using pseudo amino acid composition to predict protein structural class: Ap- proached by incorporating 400 dipeptide components, J. Comput. Chem., 28, 1463–1466. [37] F. M. Li and Q. Z. Li, (2008) Using pseudo amino acid composition to predict protein subnuclear location with improved hybrid approach, Amino Acids, 34, 119–125. [38] X. Z. Hu and Q. Z. Li, (2008) Prediction of the β-Hair- pins in proteins using support vector machine, Protein J., 27, 115–122. [39] H. Lin, (2008) The modified Mahalanobis Discriminant for predicting outer membrane proteins by using chou’s pseudo amino acid composition, J. Theor. Biol., 252, 350–356. [40] X. Z. Hu, Q. Z. Li, and C. L. Wang, (2009) Recognition of beta-hairpin motifs in proteins by using the composite vector, Amino Acids, DOI 10.1007/s00726-009-0299-7. [41] W. Chen and L. Luo, (2009) Classification of antimicro- bial peptide using diversity measure with quadratic dis- criminant analysis, J. Microbiol Methods, DOI: 10.1016/ j.mimet.2009.03.013. [42] Y. Feng and L. Luo, (2008) Use of tetrapeptide signals for protein secondary-structure prediction, Amino Acids, 35, 607–614. [43] L. Luo, (2006) Information biology: Hypotheses on cod- ing information quantity, Acta Scientiarum Naturalium Universitatis NeiMongol, 37, 285–294. [44] Z. Wang, Y. Z. Chen, and Y. X. Li, (2004) A brief review of computational gene prediction methods, Geno. Prot. Bioinfo., 2, 216–221. [45] L. Stein, (2001) Genome annotation: From sequence to biology, Nature Rev. Genet., 2, 493–503.
|