Open Access Library Journal
Vol.04 No.08(2017), Article ID:78829,13 pages
10.4236/oalib.1103807
Assessment of Hematological Toxicity in Children with Acute Lymphoblastic Leukemia, Receiving Treatment with ALL IC-BFM 2009 Protocol
Zeynep Canan Özdemir1,2*, Yeter Düzenli Kar1, Ayşe Bozkurt Turhan2, Özcan Bör1
1Department of Pediatric Hematology/Oncology, Faculty of Medicine, Eskişehir Osmangazi University, Ekişehir, Turkey
2Division of Pediatric Hematology/Oncology, Department of Pediatrics, Istanbul Medeniyet University, Göztepe Traininig and Research Hospital, Istanbul, Turkey

Copyright © 2017 by authors and Open Access Library Inc.
This work is licensed under the Creative Commons Attribution International License (CC BY 4.0).
http://creativecommons.org/licenses/by/4.0/


Received: July 4, 2017; Accepted: August 28, 2017; Published: August 31, 2017
ABSTRACT
The most common childhood cancer is acute lymphoblastic leukemia (ALL). Chemotherapy-associated hematological toxicity is well-known; however, there are few studies on hematologic toxicity incidence in children with ALL. We investigated the severity and incidence of hematologic toxicity during intense chemotherapy processes in children treated with ALL IC-BFM 2009 protocol. The study included 41 leukemic children in standard (SR) and intermediate risk (IR) groups treated between 2011 and 2015. During the induction period, the incidence of grade 4 toxicity in neutrophil count was 60%; the incidence of grade ≥ 3 toxicity in hemoglobin level was 34%; and the incidence of grade ≥ 3 toxicity in the platelet count was 51%. Deep neutropenia duration was 36.6 ± 12.7 (18 - 68) days during the induction. 53% of the febrile neutropenic (FEN) episodes developed during the induction period. There were no statistical differences between SR and IR risk groups with respect to hemogram values deep neutropenia duration and the number of FEN episodes (p > 0.05, all). There was a positive correlation between the number of FEN episodes and duration of neutropenia. During the induction, the mean neutrophil count remained between 0.5 - 1 × 10⁹/L. FEN episodes most commonly developed during the induction phase.
Subject Areas:
Clinical Trials
Keywords:
Acute Lymphoblastic Leukemia, Cytopenia, Febrile Neutropenia, Transfusion Requirement

1. Introduction
Acute lymphoblastic leukemia (ALL) is the most common childhood cancer and represents 30% of all childhood cancers [1] . Survival rates have dramatically improved since 1980 and today, the five-year survival rates are predicted to be around 80% [2] . This success could be achieved by high-dose chemotherapy and supportive treatments. However, chemotherapy-associated toxicity remains as a problematic issue. Neutropenia is the most common hematologic toxicity and leads to life-threatening infections. It is of importance for each center to demonstrate the causative agent of neutropenic fever and the susceptibility of antibiotics in fighting with infections. We believe that knowing the periods of severe neutropenia development and intensification of neutropenic episodes could be important in reducing infection-related losses.
Anemia and thrombocytopenia frequently occur as a side effect of cytotoxic chemotherapy and blood product transfusions are needed during treatment. Blood transfusions involve several risks including infection transmission, allergic reactions, immunosensitivity, iron overload, graft versus host disease. Being aware of the extent of transfusion administered to patients may be interesting with respect to reminding the extent of the risks confronted by the patients. While chemotherapy-associated hematologic toxicity is a well-known topic, there are a few studies evaluating chemotherapy-associated hematologic toxicity [3] - [8] .
In this trial, we investigated the level of severe neutropenia, anemia, thrombocytopenia incidence, deep neutropenia duration, incidence of febrile neutropenic episodes, and the extent of transfusion during intense chemotherapy in leukemic children, treated with ALL IC-BFM 2009 protocol.
2. Material and Methods
Forty-one children (2 - 17 years old) with a diagnosis of intermediate or standard risk ALL who were treated with chemotherapy between April 2011 and June 2015 whose files were complete, were included in this study. Three relapsed patients were excluded, due to they were treated with a different protocol (ALL- REZ BFM 2002) and 3 children with high risk ALL were excluded because their consolidation treatment is different from children in the SR and IR risk groups. The patient data were obtained retrospectively from the hospital’s information system. Demographic features, risk groups, hemogram data obtained during treatment, number of febrile neutropenic episodes, the quantities of erythrocyte, and apheresis suspension were recorded. Approval of the local ethics committee and written informed consent are from the children’s families.
The diagnosis of ALL was made if blast count in bone marrow was 25% or more. Peripheral blood and bone marrow smears were stained with May- Grünwald-Giemsa and evaluated according to French-American-British criteria. Immunophenotyping was performed by flow cytometry with monoclonal antibodies reactive with B-(CD10, CD19, CD22, cytoplasmic IgM, cytoplasmic IgG), T-(CD2, CD3, CD4, CD5, CD7, CD8), and precursor-cell (TdT, HLADR, and CD34) associated antigens. Chromosomal analyses were performed in bone marrow for three important translocations, including t(12;21), t(9;22), and t(4;11). Patients were classified in three groups as standard, intermediate and high risk groups according to the ALL IC BFM 2009 protocol [9] . Risk group classification based on the ALL IC BFM 2009 protocol is presented in Table 1.
Chemotherapy protocol consists of induction (Protocol I phase A and Phase B), consolidation (protocol M) and re-induction (protocol II phase 1 and phase 2) periods. Consolidation treatment starts 14 days after the end of induction treatment, and 14 days after that, re-induction treatment is initiated. Maintenance treatment is started 14 days after the end of re-induction.
In the IR risk group, patients are given daunorubicin in addition to 22 and 29 days, different from the SR risk group in Protocol I phase A. During the consolidation period, HDMTX is given to SRs at a dose of 2 g/m2 and to IRs at a dose of 5 g/m2. In addition, there is no difference in the drug doses taken by the two groups. Maintenance treatment consists of only oral methotrexate and purinethol treatment. Therefore, the study assessed the induction, consolidation and re-induction phases where intense chemotherapy was administered. The drug doses, duration and the mode of administration used during the protocol are presented in Table 2.
The level of toxicity in blood values was classified based on the Common Terminology Criteria for Adverse Events 2010 guideline [10] (Table 3). The

Table 1. The classification of risk group.
Table 2. Treatment scheme of ALL IC BFM 2009 Protocol.
PO, orally; IV, intravenous push; PI, intravenous infusion; IT, intrathecally; SR, standard risk group; IR, intermediate risk group; a: Steroid is given up in 9 days by being decreased; b: Two doses of daunorubicin has been added in IR patients; *: Applied as four days’ blocks.
threshold value transfusion was set at hemoglobin <8 g/L and platelet <20 × 109/L. The incidence of grade 4 neutropenia, grade ≥ 3 anemia and thrombocytopenia, the erythrocyte suspension used, the amount of apheresis suspension, and the number of febrile neutropenic episodes was calculated for each treat-
Table 3. Toxicity criteria according to the Common Terminology Criteria for Adverse Events 2010 guideline.
Hb, hemoglobin; ANC, absolute neutrophil count; PLT, platelet count, AST, aspartat aminotransferase; ALT, alanine aminotransferase; LLN: lower limit of normal; ULN, upper limit of normal.
ment phase. Patients were divided into two groups as the SR and IR risk groups. Hemoglobin, leukocyte, neutrophil, platelet counts, deep neutropenia duration, and the number of febrile neutropenic episodes were compared for the treatment phases of the two groups. The correlations between the absolute neutrophil count (ANC), the duration and the number of febrile neutropenic episodes were investigated.
During the protocol, the change in the ANC was converted to a graph. For this purpose, the lowest, highest and the mean ANC were used on days 1 - 8, 8 - 15, and 15 - 33 during the induction phase, the cytarabine (ARA-C) block, and the remaining parts of the protocol.
2.1. Statistical Analyses
All analyses were performed with SPSS 21.0 statistical packaged software (SPSS for Windows 21.0; SPSS, Chicago, IL, USA). The normality of distributions was evaluated using the Kolmogorov-Smirnov test. Descriptive statistics used the mean and standard deviation (mean ± SD) for normally distributed variables, and the median and interquartile distribution range was used for other variables. The comparisons between the SR and IR risk groups were made with the Mann Whitney U test and independent t test. In order to evaluate the correlation between the variables, Pearson correlation test was applied. P < 0.05 was considered to indicate statistical significance.
3. Results
A total 41 children with ALL were enrolled in this study. Thirty-eight (92%) patients had B ALL, 3 (8%) had T-ALL. There were 22 (51.2%) females and 19 (46.3%) males; 21(51.2%) were in the SR and 20 (48.8%) were in the IR group; the mean age was 6.41 ± 4.42 (2-17) years. During the whole protocol, the deep neutropenia duration was 61.7 ± 21.5 (31 - 109) days, and during the induction, this duration was 36.6 ± 12.7 (18 - 68) days. The number of febrile neutropenic episodes per patient was 4.9 ± 1.17 (3 - 9), the amount of transfused erythrocyte suspension was 10.6 ± 3.70 (3 - 20) units, and the amount of apheresis suspension was 7.8 ± 5.13 (0 - 22) units. The demographics of patients and the number of febrile neutropenic episodes per patient, the amount of erythrocyte and apheresis suspension used, deep neutropenia duration during the whole protocol and the induction period are presented in Table 4.
The incidence of grade 4 toxicity in ANC (<0.5 × 10⁹/L) was calculated as 68%, 68% and 60% respectively in protocol II phase 1, Phase 2 and protocol I phase B. Grade ≥ 3 toxicity in hemoglobin level (<8 g/L) was calculated as 34% in protocol I phase B, grade ≥ 3 toxicity in the platelet count (<50 × 109/L) was 51% in protocol I phase B and A (Figure 1).
During the whole chemotherapy process, 463 units of erythrocyte and 320 units of apheresis suspension were used; blood products were most commonly used during the protocol I phase B. Thirty-nine percent of the erythrocyte suspension and 45% of the apheresis suspension was used during this period. The quantities and percentages of erythrocyte and apheresis suspension are given in Figure 2.
There was no statistically significant difference in hemoglobin, leukocyte, neutrophil, platelet counts, and deep neutropenia duration between the SR and IR groups (p > 0.05, for all) (Table 5). During the treatment, 110 febrile neutropenic episodes developed in the SR group and 92 febrile neutropenic episodes occurred in the IR group. In SR and IR group, 53% and 54% febrile neutropenic episodes developed during the induction phase, respectively (Figure 3). For both

Figure 1. Toxicity frequencies in terms of chemotherapy periods (%).
Table 4. Clinical characteristics of children.
SR, standard risk group; IR, intermediate risk group; a: During the whole protocol; b: During the induction period.

Figure 2. The number and percentage of apheresis and erythrocyte suspensions used according to chemotherapy periods.
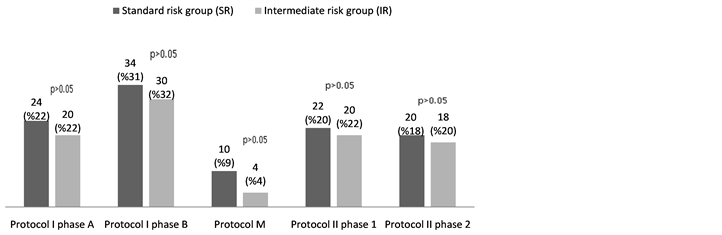
Figure 3. The number and percentage of febrile neutropenic episodes with respect to chemotherapy periods in patients from SR and IR patients.
Table 5. Comparison of hemogram values, number of febrile neutropenic episode and deep neutropenia duration of SR and IR patients.
Hb, hemoglobin; ANC, absolute neutrophil count; PLT, platelet count; DND, deep neutropenia duration; FEN: Febril neutropenic episode; SR, standard risk group; IR, intermediate risk group.
groups, the induction phase was the period during which the deep neutropenia duration was the longest and febrile neutropenic episodes developed mostcommonly (Table 5, Figure 3). In the graph showing the change in ANC, the period where the ANC was the lowest was the 4th ARA-C block of protocol I phase B (Figure 4). In addition, a positive correlation was detected between the number of febrile neutropenic episodes and deep neutropenia duration (r: +0.209, p = 0.003), and there was a negative correlation between the number of febrile neutropenic episodes and ANC (r: −0.132, p = 0.02) (Figure 5 and Figure 6).
4. Discussion
The most severe hematologic toxicity of cytotoxic chemotherapy is neutropenia. Chemotherapy predisposes the patients to infection by both suppressing the

Figure 4. Graphical view of the change in absolute neutrophil count with regard to phases during the protocol.
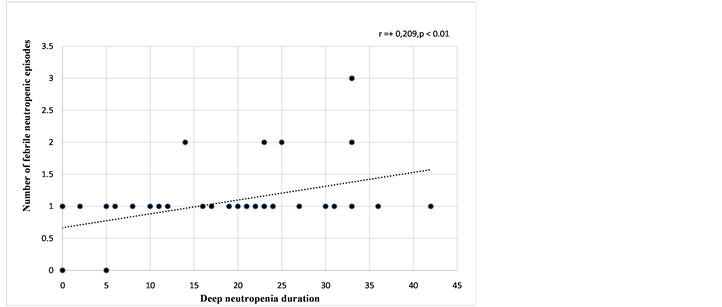
Figure 5. The diagram of the correlation between the number of febrile neutropenic episodes and the duration of neutropenia during the induction period.

Figure 6. The diagram of the correlation between the number of febrile neutropenic episodes and absolute neutrophil count during the induction period.
neutrophil production and through its cytotoxic effects on the digestive tract cells [11] . The grade and duration of neutropenia is the main determinant of the infection risk [4] [12] . The severity of the myelosuppressive effects of chemotherapy protocols on the bone marrow differs [3] [11] [13] . Patients with hematologic malignity are at higher risk for neutropenia relative to solid tumors due to the intensity of the chemotherapy used [3] [11] [14] [15] . The results showed that early-onset neutropenia was more common during the induction period of ALL and acute myeloblastic leukemia (AML), and that the deep neutropenia duration was longer during the induction treatment of relapsed ALL and AML patients [3] [11] . In our trial, as could be seen in Fig.4, the ANC decreases to the lowest values and during induction, severe neutropenia continues. Badr et al. [3] suggested that the higher neutropenia incidence during early cycles was due to more intense chemotherapy administered during induction.
In a study assessing 366 pediatric patients who received chemotherapy due to leukemia, lymphoma and solid tumors, the mean neutropenia duration was 11 days; the results showed that this time was longer during the initial chemotherapy period in ALL patients (18 days on average) [4] . Biswall et al. [16] reported that 172 febrile neutropenic attacks occurred in 112 ALL patients, consisting of children and adults and the mean neutropenia duration was 14 days. Based on the data from 81 leukemic patients consisting of adolescents and young adults from Spain, the incidence of grade 3 and 4 neutropenia was 68% during the induction period and the mean neutropenia duration was 16 (2 - 41) days [17)]. Li et al. [8] reported that the incidence of infection was 19.6% during induction and Tang et al. reported [18] a rate of 27%; Nakamura et al. [19] reported that 737 infection attacks occurred in 72 patients. In a study by Li et al. [8] , the neutropenia duration was reported as 10 days during the induction period; 50 patients had 65 infection attacks; and the frequency of infection attacks ranged between 15% and 20% in all three risk groups and there was no statistical difference. In our trial, we observed that 41 patients developed 202 neutropenic attacks during the whole protocol, and 108 attacks (53%) occurred during in the induction period (Figure 3). In our trial, the mean deep neutropenia time was detected as 36.6 ± 12.7 days (Table 4). We attributed the high infection incidence to the longer neutropenia duration (Figure 4).
Nearly all chemotherapy drugs cause myelosuppression, mucositis and nausea/vomiting. The most important toxic effect of daunorubicin is cardiotoxicity [20] . Based on the ALL IC-BFM 2009 protocol, patients in the IR risk group received daunorubicin at a dose of 120 mg/m2 and patients in the SR risk group received at a dose of 60 mg/m2 (Table 2). Despite this, there was no difference between the two groups in leukocyte, neutrophil counts, neutropenia duration and the incidence of neutropenic fever (Table 5, Figure 3). In adult AML patients receiving a higher dose of daunorubicin, there was no difference with respect to neutrophil recovery time, antibiotic use time and transfusion amounts compared to those receiving a standard dose [21] . This suggested that a higher dose of daunorubicin did not increase hematologic toxicity.
In our study, there was no difference between the SR and IR groups with respect to febrile neutropenic episodes incidence. In the previous two studies, no difference was shown between the risk groups with respect to infection incidence [7] [8] . A Turkish study showed no difference between the SR and IR groups with respect to the incidence of neutropenic fever in 96 leukemic children who were treated with ALL BFM 90, TRALL BFM 2000, modified ALL BFM 95 protocols between 1995 and 2010. The same study underlined the fact that the number of neutropenic attacks increased in children treated with the BFM protocol compared to previous years. While the mean number of neutropenic attacks was 1.1 ± 1.06 in 1990-2000, it was 2.6 ± 1.56 between 2000 and 2010 [7] . Yılmaz et al. [5] reported the mean number of neutropenic attacks as 2.6 (1 - 7) in children treated with the ALL BFM 95 protocol between 1995 and 2005. In our study, the mean number of neutropenic attacks was 4.9 ± 1.17 (3 - 9) (Table 4). Our results reflect the data obtained between 2011 and 2015 from our center. According to the previously used TRAL BFM 2000 and the modified BFM 95 protocols, there is no increase in the drug doses used during induction in the ALL IC BFM 2009 protocol in previous years. The only modification was the fact that HDMTX was given at a dose of 5 g/m2 in the IR group in B ALL. While the number of those receiving HDMTX at a dose of 5 g/m2 increased relative to the older protocols, the number of neutropenic attacks appears to be quite small compared to other periods (Figure 3). Since we don’t know about the incidence of infection during the HDMTX period, we could not make a comparison; however, we cannot declare that the increase in the number of neutropenic attacks resulted from the difference in the MTX dose. The differences in the infection incidence can be explained by the severity and duration of neutropenia, the dose and the frequency of chemotherapeutics used in the chemotherapy protocols, patient-related factors, environmental conditions and the differences between the durations of hospitalization.
Anemia is an important issue commonly observed in patients with malignity. Decreased erythrocyte production due to nutritional deficiencies, inadequate response to erythropoietin, tumor infiltration of the bone marrow and inadequate erythrocyte production due to chemotherapy drugs may lead to anemia [22] . Studies report that in patients with Hodgkin lymphoma, treated with ABVD protocol, no grade 3 or higher-grade toxicity (Hb < 8 g/L) developed while it was reported at a rate of 17% - 79% in case of non-Hodgkin lymphoma [23] . In our study, the incidence of grade 3 and higher grade toxicity in hemoglobin was between 5% and 34%.
Thrombocytopenia is a side effect of chemotherapeutic drugs. In the USA, based on the data from electronic medical records of 47.159 adult patients with solid tumors, the incidence of grade 3 and higher-grade thrombocytopenia was reported as 10.6% [24] . In a Spanish study about leukemic patients, the incidence of grade 3 and higher-grade thrombocytopenia was 44% and the mean duration of thrombocytopenia was 9 (1 - 35) days [17]
In our study, the incidence of grade 3 and higher grade thrombocytopenia was between 12% and 51%.
5. Conclusion
Induction period is the period where the bone marrow is most severely suppressed in leukemic children treated with the ALL IC BFM 2009 protocol. In this period, both the number of febrile neutropenic episodes and the requirement for transfusion is higher than other periods. The most important factor to determine the incidence of febrile neutropenic episodes is the neutropenia duration and the absolute neutrophil count. One should be careful during this period against infections and protective measures need to be increased. Considering the amount of transfusion administered during chemotherapy, studies on the use of erythropoietic and thrombopoietic agents to increase the life quality of patients, and protect against transfusion-related complications would be important.
Source of Funding
This research did not receive any specific grant from funding agencies in the public, commercial, or not-for-profit sectors.
Conflicts of Interest
None declared.
Cite this paper
Özdemir, Z.C., Kar, Y.D., Turhan, A.B. and Bör, Ö. (2017) Assessment of Hematological Toxicity in Children with Acute Lymphoblastic Leukemia, Receiving Treatment with ALL IC-BFM 2009 Protocol. Open Access Library Journal, 4: e3807. https://doi.org/10.4236/oalib.1103807
References
- 1. SEER Cancer Statistics Review, National Cancer Institute. Bethesda, MD.
- 2. Gaynon, P.S., Angiolillo, A.L., Carroll, W.L., et al. (2010) Long-Term Results of the Children’s Cancer Group Studies for Childhood Acute Lymphoblastic Leukemia 1983-2002: A Children’s Oncology Group Report. Leukemia, 24, 285-297.
https://doi.org/10.1038/leu.2009.262 - 3. Badr, M., Hassan, T., Sakr, H., et al. (2016) Chemotherapy-Induced Neutropenia among Pediatric Cancer Patients in Egypt: Risks and Consequences. Molecular and Clinical Oncology, 5, 300-306.
- 4. Castagnola, E., Fontana, V., Caviglia, I., et al. (2007) A Prospective Study on the Epidemiology of Febrile Episodes during Chemotherapy-Induced Neutropenia in Children with Cancer or after Hemopoietic Stem Cell Transplantation. Clinical Infectious Diseases, 45, 1296-1304.
https://doi.org/10.1086/522533 - 5. Yilmaz, S., Oren, H., Demircioglu, F., et al. (2008) Assessment of Febrile Neutropenia Episodes in Children with Acute Leukemia Treated with BFM Protocols. Pediatric Hematology and Oncology, 25, 195-204.
https://doi.org/10.1080/08880010801938231 - 6. Ranan, Z.A., Rabbani, M.W., Sheikh, M.A., et al. (2009) Outcome of Childhood Acute Lymphoblastic Leukemia after Induction Therapy 3 Years Experience at e Single Paediatric Oncology Centre. Journal of Ayub Medical College Abbottabad, 21, 150-153.
- 7. Ozdemir, N., Tüysüz, G., Celik, N., et al. (2016) Febrile Neutropenia in Children with Acute Lymphoblastic Leukemia: Single Center Experience. Turkish Pediatric Arsivi, 51, 79-86.
https://doi.org/10.5152/TurkPediatriArs.2016.2757 - 8. Li, S.D., Chen, Y.B., Li, Z.G., et al. (2015) Infections during Induction Therapy of Protocol CCLG 2008 in Childhood Acute Lymphoblastic Leukemia: A Single Center Experience with 256 Cases in China. Chinese Medical Journal, 128, 472-476.
https://doi.org/10.4103/0366-6999.151085 - 9. A Randomized Trial of the I-BFM-SG for the Management of Childhood Non-B Acute Lymphoblastic Leukemia. Final Version of Therapy Protocol from August-14-2009.
- 10. U.S. National Institutes of Health. National Cancer Institute CTEP CTCAE v3.0. 2011.
http://ctep.cancer.gov/reporting/ctc.html - 11. Crawford, J., Dale, D.C. and Lyman, G.H. (2004) Chemotherapy-Induced Neutropenia: Risks, Consequences, and New Directions for Its Management. Cancer, 100, 228-237.
https://doi.org/10.1002/cncr.11882 - 12. Bodey, G.P., Buckley, M., Sathe, Y.S., et al. (1966) Quantitative Relationships between Circulating Leukocytes and Infection in Patients with Acute Leukemia. Annals of Internal Medicine, 64, 328-340.
https://doi.org/10.7326/0003-4819-64-2-328 - 13. Lyman, G.H., Kuderer, N.M. and Balducci, L. (2002) Cost-Benefit Analysis of Granulocyte Colony-Stimulating Factor in the Management of Elderly Cancer Patients. Current Opinion in Hematology, 9, 207-214.
https://doi.org/10.1097/00062752-200205000-00006 - 14. Weycker, D., Barron, R., Kartashov, A., et al. (2014) Incidence, Treatment and Consequences of Chemotherapy-Induced Febrile Neutropenia in the Inpatient and Outpatient Settings. Journal of Oncology Pharmacy Practice, 20, 190-198.
https://doi.org/10.1177/1078155213492450 - 15. Buffler, P.A., Kwan, M.L., Reynods, P., et al. (2005) Environmental and Genetic Risk Factors for Childhood Leukemia: Appraising the Evidence. Cancer Investigation, 23, 60-75.
https://doi.org/10.1081/CNV-46402 - 16. Biswal, S. and Godnaik, C. (2013) Incidence and Management of Infections in Patients with Acute Leukemia Following Chemotherapy in General Wards. Ecancermedicalscience, 7, 310.
- 17. Ribera, J.M., Oriol, A., Sanz, M.A., et al. (2008) Comparison of the Results of the Treatment of Adolescents and Young Adults with Standard Risk Acute Lymphoblastic Leukemia with the Programa Espanol de Tratamiento en Hematologia Pediatric Based Protocol ALL-96. Journal of Clinical Oncology, 28, 1843-1849.
https://doi.org/10.1200/JCO.2007.13.7265 - 18. Tang, J.Y., Gu, L.J., Xue, H.L., et al. (2009) Report on Induction Efficacy of Protocol ALL-2005 and Middle Term Follow-Up of 158 Cases of Childhood Acute Lymphoblastic Leukemia. Chinese Journal of Hematology, 30, 289-293.
- 19. Nakamura, S., Gelber, R.D. and Blattner, S. (2000) Long-Term Follow-Up and Infectious Complications of Therapy for Acute Lymphoblastic Leukemia in Children. International Journal of Pediatric Hematology/Oncology, 6, 321-330.
- 20. Cooper, S.L. and Brown, P.A. (2015) Treatment of Pediatric Acute Lymphoblastic Leukemia. Pediatric Clinics of North America, 62, 61-73.
- 21. Burnett, A.K., Russel, N.H., Hills, R.K., et al. (2015) A Randomized Comparison Daunorubicin 90 mg/m2 vs. 60 mg/m in AML Induction: Results from the UKNCRIAML 17 Trial in 1206 Patients. Blood, 125, 3878-3885.
https://doi.org/10.1182/blood-2015-01-623447 - 22. Miller, C.B., Jones, R.J., Piantadosi, S., et al. (1990) Decreased Erythropoietin Response in Patients with the Anemia of Cancer. The New England Journal of Medicine, 322, 1689-1692.
https://doi.org/10.1056/NEJM199006143222401 - 23. Groopman, J.E. and Itri, L.M. (1999) Chemotherapy-Induced Anemia in Adults: Incidence and Treatment. Journal of the National Cancer Institute, 91, 1616-1634.
https://doi.org/10.1093/jnci/91.19.1616 - 24. Wu, Y., Aravind, S., Ranganathan, G., et al. (2009) Anemia and Thrombocytopenia in Patients Undergoing Chemotherapy for Solid Tumors: A Descriptive Study of a Large Outpatient Oncology Practice Database, 2000-2007. Clinical Therapeutics, 31, 2416-2432.