Paper Menu >>
Journal Menu >>
 J. Software Engineering & Applications, 2009, 2: 206-208 doi:10.4236/jsea.2009.23028 Published Online October 2009 (http://www.SciRP.org/journal/jsea) Copyright © 2009 SciRes JSEA MicrobIdentifier: A Microbial Identification Softw are Based on Mass-Spectrometry Feng LIU, Lu LI, Chi ZHANG, Lingbing WANG, Pei LI International School of Software, Wuhan University, Wuhan, China. Email: wolflf@126.com, {lulu.li1989, chzhcn88}@gmail.com Received May 18th, 2009; revised July 5th, 2009; accepted July 16th, 2009. ABSTRACT As the technology of microbial identification by mass cataloging has been widely used, we have developed the microbi- al identification software, MicrobIdentifier, which integrates and automates different steps in the procedure of rapid species identification based on mass-spectrometry. This software is written in Java for cross-platform intention. Keywords: Microbial Identification, Mass-Spectrometry 1. Introduction With the development of the technology, microbial iden- tification by mass cataloging has attracted considerable attention due to its high efficiency and automation. In order to improve efficiency and automation of this tech- nology, we’ve developed this microbial identification software based on the spectral coincidence function pro- posed in [1]. The software has two major functions: First, it can be used to search for all the possible primer pairs among the given genes of different species, and evaluate these primer candidates by giving each pair a score. This is proved to be a useful reference during primer design. Second, it takes advantage of the spectral coincidence function to compare mass spectrometric observables with theoretical fragmentation patterns, and further to deter- mine the genetic affinity between the sample gene and genes of known species in the database. This will free researchers from the effort of comparing the fragmenta- tion patterns manually. 2. Algorithm The core algorithm our work has been based on is a spectral coincidence function proposed in [1] as follow: ij iji j ii jj 2MM CCM,M (MM )(MM ) The dot-product in the coincidence function is defined as 12 NN ij i=1j 1 M, MMMδm-m where M is the mass vector of one sample’s fragmenta- tion, which has N1 elements with mi standing for the ith element, while M’ is the mass vector of the other sample, which has N2 elements with m’j standing for the ith ele- ment. The discrete delta function is: 10 () 0 k kotherwis e Based on the formulas, the inner-product is greater if the two samples have more fragmentation of the same mass. The coincidence function normalizes the inner-pro- duct value to a range between zero and one, and a high value of the coincidence function indicates more similar- ity between the two genes in comparison. Therefore, this function can be used to score the similarity in both the primer search process and the identification process. The algorithm in primer search process is as follow: 1) Align all the gene sequences with ClustalW algo- rithm [3]. 2) Find regions where all the sequences have more than N nucleotides at the same place and in the same or- der, which are the conserved regions. If the regions are less than two, then exit. 3) Take two conserved regions and check whether the number of nucleotides is more than M. Take another pair of regions if otherwise. 4) Cut the regions between two conserved regions (conserved regions included) after every “G”, filtering the fragments which have less than L nucleotides. 5) Calculate the mass of all fragments of each se- quence, and then form the sequence’s mass vector. 6) Take the mass vectors of one pair of gene sequences and calculate the score indicating their similarity by us- ing the coincidence function. 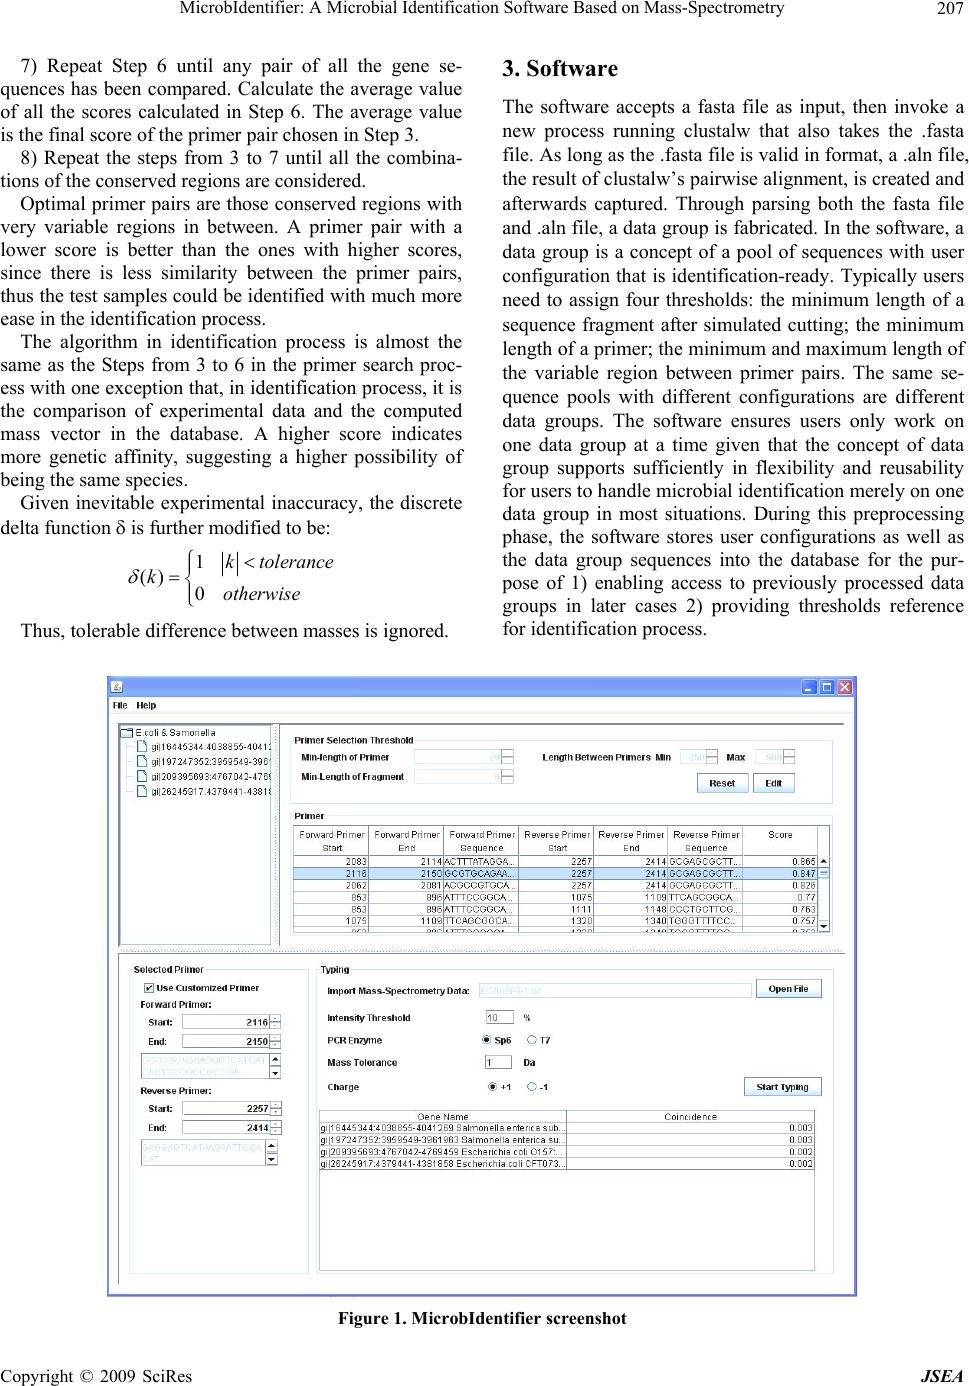 MicrobIdentifier: A Microbial Identification Software Based on Mass-Spectrometry Copyright © 2009 SciRes JSEA 207 7) Repeat Step 6 until any pair of all the gene se- quences has been compared. Calculate the average value of all the scores calculated in Step 6. The average value is the final score of the primer pair chosen in Step 3. 8) Repeat the steps from 3 to 7 until all the combina- tions of the conserved regions are considered. Optimal primer pairs are those conserved regions with very variable regions in between. A primer pair with a lower score is better than the ones with higher scores, since there is less similarity between the primer pairs, thus the test samples could be identified with much more ease in the identification process. The algorithm in identification process is almost the same as the Steps from 3 to 6 in the primer search proc- ess with one exception that, in identification process, it is the comparison of experimental data and the computed mass vector in the database. A higher score indicates more genetic affinity, suggesting a higher possibility of being the same species. Given inevitable experimental inaccuracy, the discrete delta function is further modified to be: 1 () 0 k tolerance kotherwise Thus, tolerable difference between masses is ignored. 3. Software The software accepts a fasta file as input, then invoke a new process running clustalw that also takes the .fasta file. As long as the .fasta file is valid in format, a .aln file, the result of clustalw’s pairwise alignment, is created and afterwards captured. Through parsing both the fasta file and .aln file, a data group is fabricated. In the software, a data group is a concept of a pool of sequences with user configuration that is identification-ready. Typically users need to assign four thresholds: the minimum length of a sequence fragment after simulated cutting; the minimum length of a primer; the minimum and maximum length of the variable region between primer pairs. The same se- quence pools with different configurations are different data groups. The software ensures users only work on one data group at a time given that the concept of data group supports sufficiently in flexibility and reusability for users to handle microbial identification merely on one data group in most situations. During this preprocessing phase, the software stores user configurations as well as the data group sequences into the database for the pur- pose of 1) enabling access to previously processed data groups in later cases 2) providing thresholds reference for identification process. Figure 1. MicrobIdentifier screenshot  MicrobIdentifier: A Microbial Identification Software Based on Mass-Spectrometry Copyright © 2009 SciRes JSEA 208 The user interface shows the sequences in the pool; primer selection thresholds and primer pair candidates are also given out if current data group is loaded from database, whose primer pair candidates have already been worked out after proper configuration in previous use. The more usual case, however, is the user sets up basic configuration after a new pool is given, parsed down and shown on UI, to calculate potential primers pairs. The list of primer pairs is sorted by score in as- cending order. The configurations are saved into the da- tabase in associate with the working data group. To perform microbial identification, the software uses exported ASCII Spectrometry .txt file from DataExplorer, whose data is the mass spectrometry result from MALDI-TOF. Users are free to customize proposed primer pair candidates to choose a subset, however man- datory to provide some parameters about the conditions in their mass-spectrometry experiment, including: in vi- tro transcription enzyme, either SP6 or T7; mass toler- ance and minimum intensity threshold; whether the elec- tric charge is positive of negative during MALDI-TOF experiment. The software parses the input file, generates peek list after filtering peak values below the intensity threshold, taking into account the experimental inaccu- racy by means of adopting tolerance and finally provides the identification consequence. Figure 1 shows the interface of MicrobIdentifier. 4. Acknowledgements This paper is sponsored by the National Science and Te- chnology Major Project 2009ZX10004-107 and The Na- tural Science Founds of Wuhan University F020504. REFERENCES [1] G. W. Jackson, R. J. McNichols, G. E. Fox and R. C. Willson, “Bacterial genotyping by 16S rRNA mass cata- loging”, BMC Bioinformatics, vol.7, pp. 321–335, June 2006. [2] Z. D. Zhang, G. W. Jackson, G. E. Fox, and R. C. Willson, “Microbial identification by mass cataloging,” BMC Bioinformatics, Vol. 7, pp. 117–135, Match 2006. [3] J. D. Thompson, D. G. Higgins, and T. J. Gibson, “CLUSTAL W: Improving the sensitivity of progressive multiple sequence alignment through sequence weighting, position-specific gap penalties and weight matrix choice,” Nucleic Acids Research, Vol. 22, pp. 4673–4680, Sep- tember 1994. [4] C. Honisch, Y. Chen, C. Mortimer, C. Arnold, O. Schmidt, D. van den Boom, C. R. Cantor, H. N. Shah, and S. E. Gharbia, “Automated comparative sequence analysis by base-specific cleavage and mass spectrometry for nucleic acid-based microbial typing,” Proceedings of the National Academy of Sciences, Vol. 104, pp. 10649–10654, June 2007. [5] H. Steen and M. Mann, “The abc’s (and xyz’s) of Peptide Sequencing,” Molecular Cell Biology, Vol. 5, pp. 699– 711, September 2004. |