Paper Menu >>
Journal Menu >>
 J. Software Engineering & Applications, 2009, 2: 137-143 doi:10.4236/jsea.2009.23020 Published Online October 2009 (http://www.SciRP.org/journal/jsea) Copyright © 2009 SciRes JSEA 137 Cyclomatic Complexity and Lines of Code: Empirical Evidence of a Stable Linear Relationship Graylin JAY1, Joanne E. HALE2, Randy K. SMITH1, David HALE2, Nicholas A. KRAFT1, Charles WARD1 1Department of Computer Science, University of Alabama, Tuscaloosa, USA; 2 Department of Management Information Systems, University of Alabama, Tuscaloosa, USA. Email: {tjay, rsmith, nkraft, cward}@cs.ua.edu, {jhale, dhale}@cba.ua.edu Received April 21st, 2009; revised June 9th, 2009; accepted June 12nd, 2009. ABSTRACT Researchers have often commented on the high correlation between McCabe’s Cyclomatic Complexity (CC) and lines of code (LOC). Many have believed this correlation high enough to justify adjusting CC by LOC or even substituting LOC for CC. However, from an empirical standpoint the relationship of CC to LOC is still an open one. We undertake the largest statistical study of this relationship to date. Employing modern regression techniques, we find the linearity of this relationship has been severely underestimated, so much so that CC can be said to have absolutely no explana- tory power of its own. This research presents evidence that LOC and CC have a stable practically perfect linear rela- tionship that holds across programmers, languages, code paradigms (procedural versus object-oriented), and software processes. Linear models are developed relating LOC and CC. These models are verified against over 1.2 million randomly selected source files fro m the SourceFo rge co de repository. These files repr esent softwa re projects from three target languages (C, C++, and Java) and a variety of programmer experience levels, software architectures, and de- velopment methodologies. The models developed are found to successfully predict roughly 90% of CC’s variance by LOC alone. This suggest not only that the linear relationship between LOC and CC is stable, but the aspects of code complexity that CC measures, such as the size of the test case space, grow linearly with source code size across lan- guages and programming paradigms. Keywords: Software Complexity, Software Metrics, Cyclo matic Complexity 1. Introduction Software complexity is traditionally a direct indicator of software quality and cost [1-6]. The greater the com- plexity (by some measure) the more fault prone the soft- ware resulting in higher cost. Much effort has gone into identifying techn iques and metrics to ‘measure’ the com- plexity of software and software modules [7]. Logically, many of these measures have been shown to be corre- lated in some manner. Understanding these relationships is important to understanding and evaluating the metrics themselves and ultimately in reducing software devel- opment and maintenance efforts. This research reexam- ines the relationship between Lines of Code (LOC) and McCabe’s Cyclomatic Complexity (CC) a traditional complexity metric. First introduced in 1976 [8], McCabe’s Cyclomatic Complexity (CC) is intended to measure software com- plexity by examining the software program’s flow graph. In practice, CC amounts to a count of the “decision points” present in the software. CC can be calculated as: CC = E – N + 2P where E is the number of edges, N is the number of nodes, and P is the number of discrete connected components. CC was originally meant as a measure of the size of the test case space [8]. While numerous studies [1–3,9] have examine the re- lationship between LOC and CC, few have made it their central point of inquiry. As a result, while many state, sometimes strongly, that LOC and CC have a linear rela- tionship, few investigate statistical issues such as the distribution of variance among LOC and CC. Shepperd, for example, uses data from previous studies to argues that CC was often “merely a proxy for ... lines of code” [9]. Many investigators either consciously or serendipi- tously avoid the issue entirely by using mixed metrics  Cycloma t ic Complexity and Lines of Code: Empirical Evidence of a Stable Linear Relationship 138 such as error density or adjustments for size [5, 10]. Oth- ers investigating the relationship of CC to some other factor explicitly tested for a detrimental multi-collinear effect from LOC [11]. While previous studies have indi- cated the large role that LOC seems to play in CC [12], they stop short of claiming a general model of the rela- tionship. While we do not seek to settle th e issue, it is for these reasons that this research reexamines the relation- ship of LOC and CC in the context of a large empirical study. 2. Study Methodology As a baseline and to confirm the LOC/CC relationship results reported in the literature, a pilot study look ed at 5 NASA projects from the PROMISE Software Engineer- ing Repository [13]. The PROMISE Repository is a col- lection of publicly available datasets for software engi- neering researchers. The NASA projects were originally archived in the NASA Metrics Data Program. Table 1 shows the Pearson Moment of Correlation between LOC and CC. The correlation is remarkably high (average 0.896), yet does have a significant variance. When expanding on this pilot, variance was examined closely for the larger sample population. 2.1 Sample Population For the larger study, the SourceForge.net (SourceForge) software repository was chosen because of its breadth and popularity [14]. SourceForge is the most popular public software repository on the Internet and is second only to Download.com as the most popular provider of software on the web [15]. SourceForge is home to pro- jects actively sponsored and developed by companies such as HP [16] and IBM [17] as well as academic and other open-source projects. SourceForge is home to over 170 thousand different software projects all with their full codebases publicly available. 2.2 Population Candidate Stratification Based on the observations of the PROMISE Repository, the large sample population of SourceForge projects was stratified based on three popular languages: C, C++ and Java. Identification of the implementation language is part of project creation on SourceForge. This self-re- ported information was used to establish three subject candidate populations. Table 2 shows the number, by language, of candidate projects considered for this study as well as the number of projects actually selected and analyzed. Projects that mixed candidate languages were elimi- nated. That is: while a project that employed Python and C was considered an acceptable candidate, a project that used Java and C++ was not. 2.3 Subject Selection One thousand subjects were randomly chosen from the stratified lists (column two of table 2). All of the chosen subjects needed to employ the Subversion (SVN) version control system [18] rather than the more traditional CVS, so this criterion was used to further discriminate amongst projects. The speed and reliability of SVN made this ex- periment practical. The choice of SVN over CVS did not affect the sample statistics. A complete discussion of this issue and other analysis is given in the Results section. Table 1. Representative NASA projects and their pearson moment between LOC and CC Project Language Pearson Moment spacecraft instrument C 0.94 real-time predictive simulation C 0.82 data storage manager C++ 0.90 science data processor C++ 0.96 satellite flight software C 0.86 Table 2. Candidate population sizes (in projects) and final number of active subject s Language Candidate Projects Selected Active Projects (at least one source file) Java 21,739 728 C 13,336 749 C++ 15,194 747 Copyright © 2009 SciRes JSEA 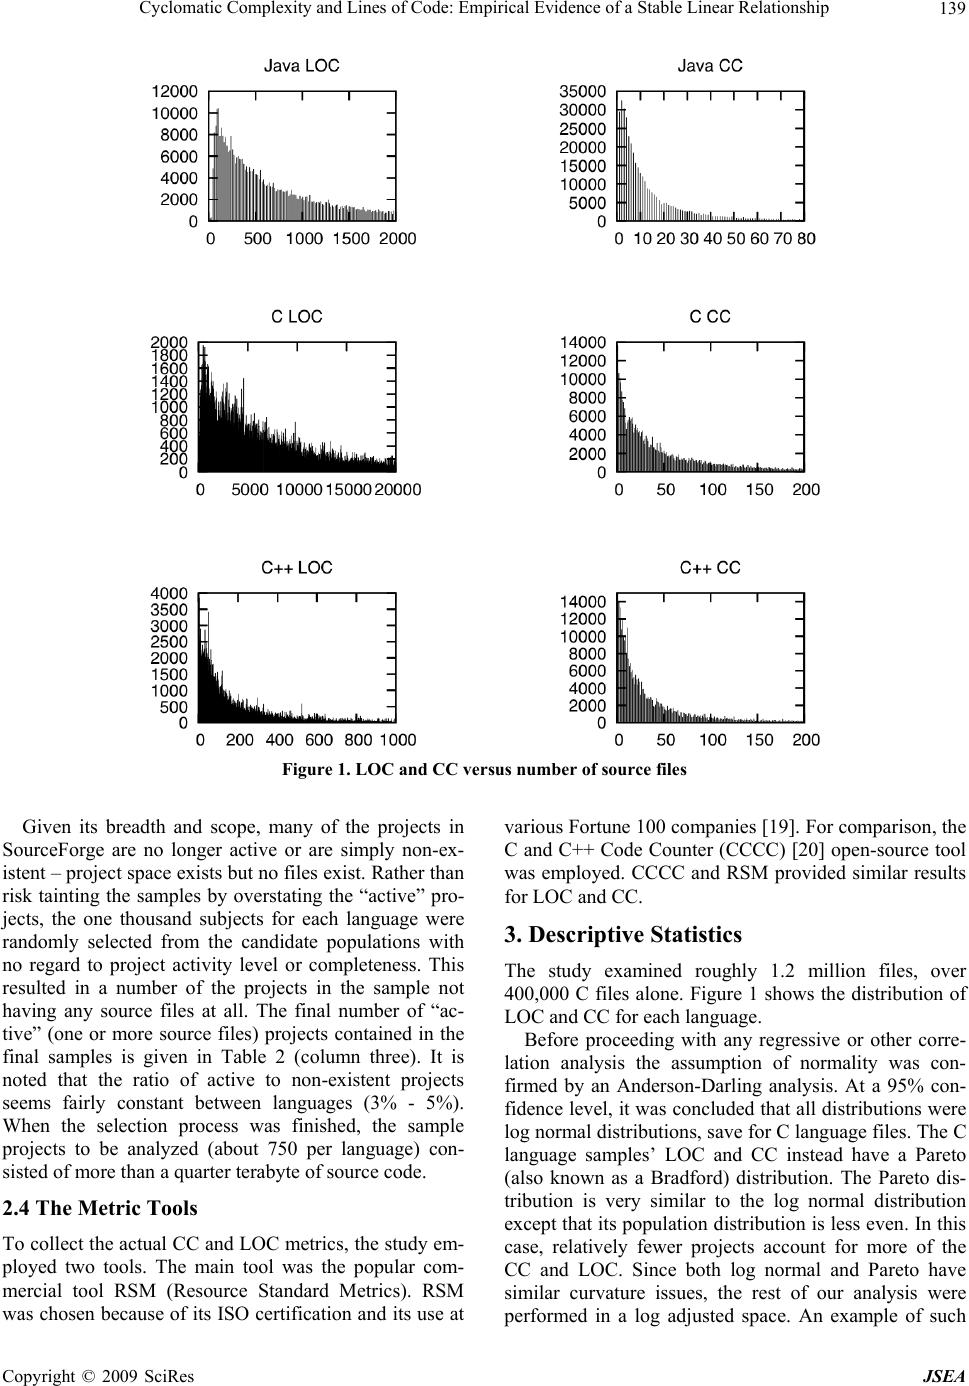 Cycloma t ic Complexity and Lines of Code: Empirical Evidence of a Stable Linear Relationship139 Figure 1. LOC and CC versus number of source files Given its breadth and scope, many of the projects in SourceForge are no longer active or are simply non-ex- istent – project space exists but no files exist. Rather than risk tainting the samples by overstating the “active” pro- jects, the one thousand subjects for each language were randomly selected from the candidate populations with no regard to project activity level or completeness. This resulted in a number of the projects in the sample not having any source files at all. The final number of “ac- tive” (one or more source files) projects contained in the final samples is given in Table 2 (column three). It is noted that the ratio of active to non-existent projects seems fairly constant between languages (3% - 5%). When the selection process was finished, the sample projects to be analyzed (about 750 per language) con- sisted of more than a quarter terabyte of source code. 2.4 The Metric Tools To collect the actual CC and LOC metrics, the study em- ployed two tools. The main tool was the popular com- mercial tool RSM (Resource Standard Metrics). RSM was chosen because of its ISO certification and its use at various Fortune 100 companies [19]. For comparison, the C and C++ Code Counter (CCCC) [20] open-source tool was employed. CCCC and RSM provided similar results for LOC and CC. 3. Descriptive Statistics The study examined roughly 1.2 million files, over 400,000 C files alone. Figure 1 shows the distribution of LOC and CC for each language. Before proceeding with any regressive or other corre- lation analysis the assumption of normality was con- firmed by an Anderson-Darling analysis. At a 95% con- fidence level, it was concluded that all distributions were log normal distributions, save for C language files. The C language samples’ LOC and CC instead have a Pareto (also known as a Bradford) distribution. The Pareto dis- tribution is very similar to the log normal distribution except that its population distributio n is less even. In this case, relatively fewer projects account for more of the CC and LOC. Since both log normal and Pareto have similar curvature issues, the rest of our analysis were performed in a log adjusted space. An example of such Copyright © 2009 SciRes JSEA 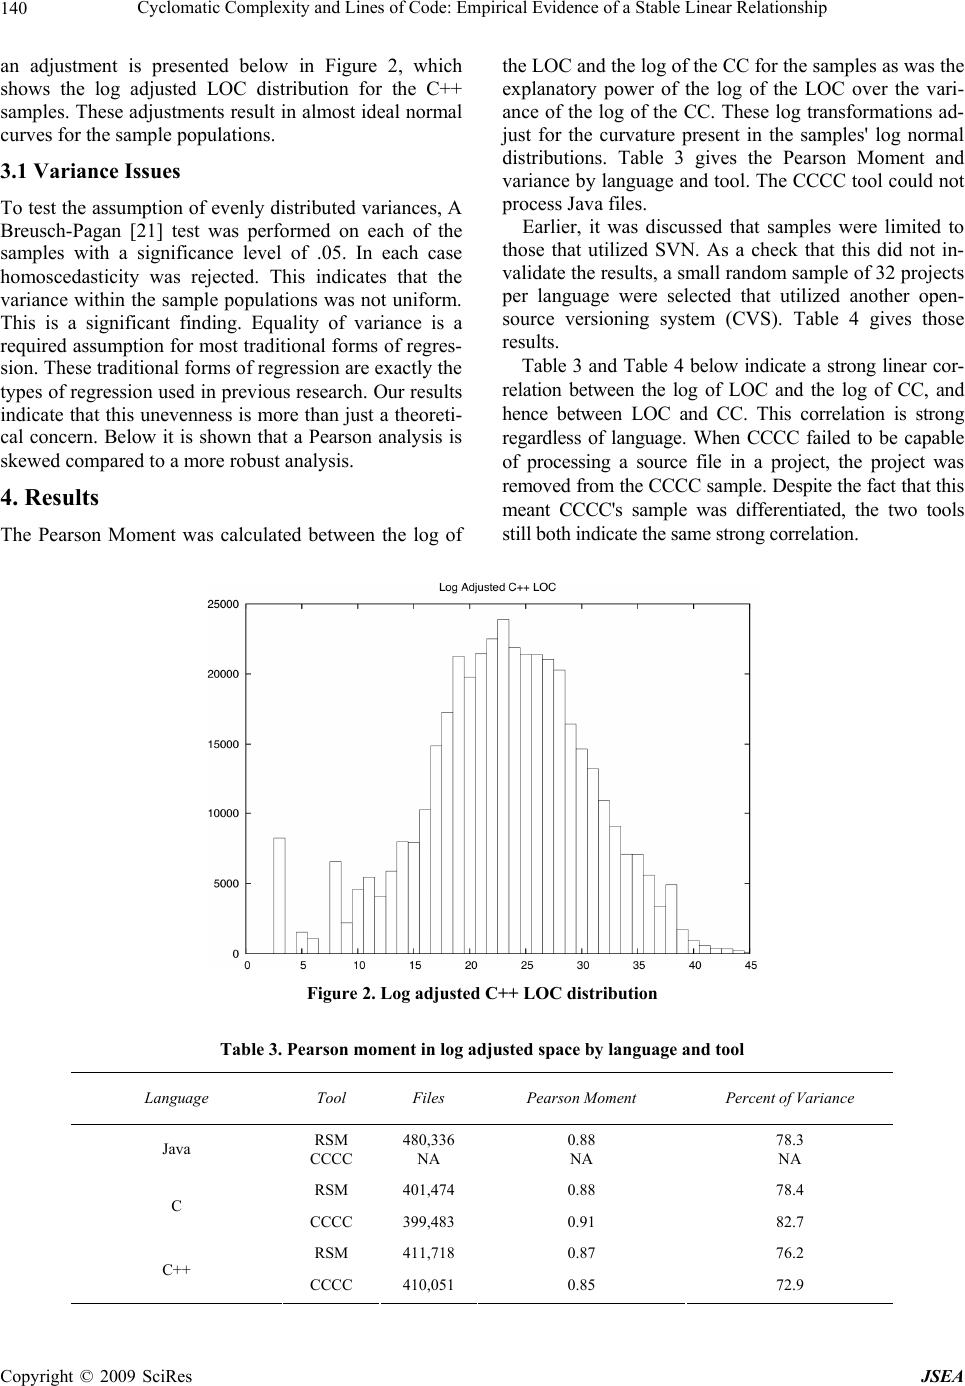 Cycloma t ic Complexity and Lines of Code: Empirical Evidence of a Stable Linear Relationship 140 an adjustment is presented below in Figure 2, which shows the log adjusted LOC distribution for the C++ samples. These adjustments result in almost ideal normal curves for the sample populations. 3.1 Variance Issues To test the assumption of ev enly distributed variances, A Breusch-Pagan [21] test was performed on each of the samples with a significance level of .05. In each case homoscedasticity was rejected. This indicates that the variance within the sample populations was not uniform. This is a significant finding. Equality of variance is a required assumptio n for most traditional forms of regres- sion. These traditiona l forms of regression are exactly the types of regression used in previous research. Our results indicate that this unevenness is more than just a theoreti- cal concern. Below it is shown that a Pearson analysis is skewed compared to a more robust analysis. 4. Results The Pearson Moment was calculated between the log of the LOC and the log of the CC for the samples as was the explanatory power of the log of the LOC over the vari- ance of the log of the CC. These log transformations ad- just for the curvature present in the samples' log normal distributions. Table 3 gives the Pearson Moment and variance by langu age and tool. The CCCC tool cou ld not process Java files. Earlier, it was discussed that samples were limited to those that utilized SVN. As a check that this did not in- validate the results, a small random sample of 32 projects per language were selected that utilized another open- source versioning system (CVS). Table 4 gives those results. Table 3 and Table 4 below indicate a strong linear cor- relation between the log of LOC and the log of CC, and hence between LOC and CC. This correlation is strong regardless of language. When CCCC failed to be capable of processing a source file in a project, the project was removed from the CCCC sample. Despite the fact that this meant CCCC's sample was differentiated, the two tools still both indi cate the sam e strong correla ti on. Figure 2. Log adjusted C++ LOC distribution Table 3. Pearson moment in log adjusted space by language and tool Language Tool Files Pearson Moment Percent of Variance Java RSM CCCC 480,336 NA 0.88 NA 78.3 NA RSM 401,474 0.88 78.4 C CCCC 399,483 0.91 82.7 RSM 411,718 0.87 76.2 C++ CCCC 410,051 0.85 72.9 Copyright © 2009 SciRes JSEA 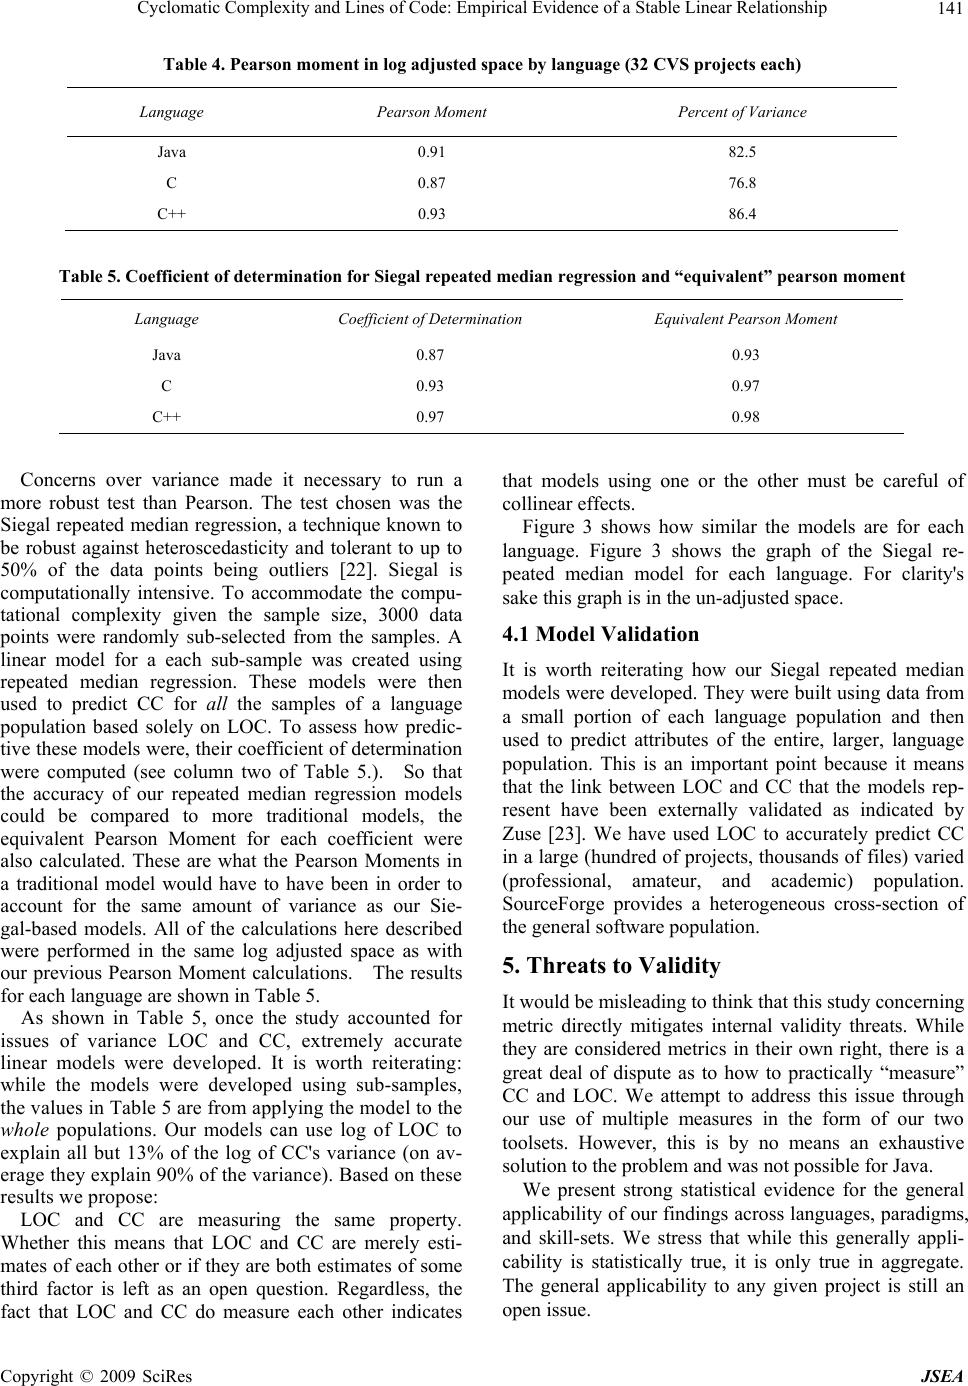 Cycloma t ic Complexity and Lines of Code: Empirical Evidence of a Stable Linear Relationship141 Table 4. Pearson moment in log adjusted space by language (32 CVS projects each) Language Pearson Moment Percent of Variance Java 0.91 82.5 C 0.87 76.8 C++ 0.93 86.4 Table 5. Coefficient of determination for Siegal repeated median regression and “equivalent” pearson moment Language Coefficient of Determination Equivalent Pearson Moment Java 0.87 0.93 C 0.93 0.97 C++ 0.97 0.98 Concerns over variance made it necessary to run a more robust test than Pearson. The test chosen was the Siegal repeated median regression, a technique known to be robust against heteroscedasticity and tolerant to up to 50% of the data points being outliers [22]. Siegal is computationally intensive. To accommodate the compu- tational complexity given the sample size, 3000 data points were randomly sub-selected from the samples. A linear model for a each sub-sample was created using repeated median regression. These models were then used to predict CC for all the samples of a language population based solely on LOC. To assess how predic- tive these models were, their coefficient of determination were computed (see column two of Table 5.). So that the accuracy of our repeated median regression models could be compared to more traditional models, the equivalent Pearson Moment for each coefficient were also calculated. These are what the Pearson Moments in a traditional model would have to have been in order to account for the same amount of variance as our Sie- gal-based models. All of the calculations here described were performed in the same log adjusted space as with our previous Pearson Moment calculations. The results for each language ar e shown in Table 5. As shown in Table 5, once the study accounted for issues of variance LOC and CC, extremely accurate linear models were developed. It is worth reiterating: while the models were developed using sub-samples, the va lues in Tab le 5 are from ap pl ying the mod el to the whole populations. Our models can use log of LOC to explain all but 13% of the log of CC's variance (on av- erage they explain 90% of the variance). Based on these results we propose: LOC and CC are measuring the same property. Whether this means that LOC and CC are merely esti- mates of each other or if they are both estimates of some third factor is left as an open question. Regardless, the fact that LOC and CC do measure each other indicates that models using one or the other must be careful of collinear effects. Figure 3 shows how similar the models are for each language. Figure 3 shows the graph of the Siegal re- peated median model for each language. For clarity's sake this graph is in the un-adjusted space. 4.1 Model Validation It is worth reiterating how our Siegal repeated median models were developed. They were built using data fro m a small portion of each language population and then used to predict attributes of the entire, larger, language population. This is an important point because it means that the link between LOC and CC that the models rep- resent have been externally validated as indicated by Zuse [23]. We have used LOC to accurately predict CC in a large (hundred of projects, thousand s of files) varied (professional, amateur, and academic) population. SourceForge provides a heterogeneous cross-section of the general software population. 5. Threats to Validity It would be misleading to think that this study concerning metric directly mitigates internal validity threats. While they are considered metrics in their own right, there is a great deal of dispute as to how to practically “measure” CC and LOC. We attempt to address this issue through our use of multiple measures in the form of our two toolsets. However, this is by no means an exhaustive solution to the problem and was not possible for Java. We present strong statistical evidence for the general applicability of our findings across lan guages, paradigms, and skill-sets. We stress that while this generally appli- cability is statistically true, it is only true in aggregate. The general applicability to any given project is still an pen issue. o Copyright © 2009 SciRes JSEA  Cycloma t ic Complexity and Lines of Code: Empirical Evidence of a Stable Linear Relationship 142 Figure 3. Siegal repeated median model for each language 6. Discussion It is known that accurately estimating collinear factor’s linearity can be difficult. By utilizing the large sample size in this study, the co-linearity of CC and LOC was statistically determined. These results help to address some of the contradictory findings in previous studies [2,3,6,9,24,25,26] regarding CC, LOC, errors, mainte- nance effort, and so forth. Factors as linearly related as LOC and CC should be consid ered collinear. Models that fail to properly bind together collinear or multi-collinear factors will often have unstable explanatory power. The instability of predictions based on collinear factors can provide a theoretical explanation for so many contradic- tory findings. While likely not the dominant factor, this effect could also provide a partial explanation for why researcher such as Menzies et al. have discovered so much more predictive power in hybrid predictors than so-called mono-metrics [27]. In support of Menzies et al, hybrid metrics can properly bind these factors where mono-metrics cannot. Mono-metrics lack needed infor- mation that is captured by combined or hybrid metrics. The linear relationship between LOC and CC raises has several direct implications for software maintainers and evolution management. CC has no (or very little) explanatory power of its own. This implies that indicators that rely on CC may more easily be calculated and normalized by using LOC. Cal- culation of CC requires some cost however small. The results from this study indicate there is no more insight gained from CC when compared to LOC. The relationship between CC and LOC is near linear regardless of language type for the three languages in this study. This result implies that the characteristic of com- plexity and test case size measured by CC and LOC is the same in a procedural language (C), an objected-oriented language (Java) and a hybrid language (C++). It also im- plies that if CC indeed measures some aspects of com- plexity, then developers tend to add these aspects to a program at an incredibly steady rate (at least in practice). Modules where LOC does not predict CC are outliers and should be targeted for closer scrutiny. These models on average accounted for 90% of CC’s variance. This means that any source-file/program which does not fit this model is in a statistical sense an outlier. If the outlier status of these modules to the model is equally (or even partially) indicative of a similar status for true complex- ity then these linear models themselves can be used as a form of complexity metric or at least as a monitor for possible complexity issues. Modules where LOC does not predict CC (or vice-versa) may indicate an overly- complex module with a high density of decision points or Copyright © 2009 SciRes JSEA 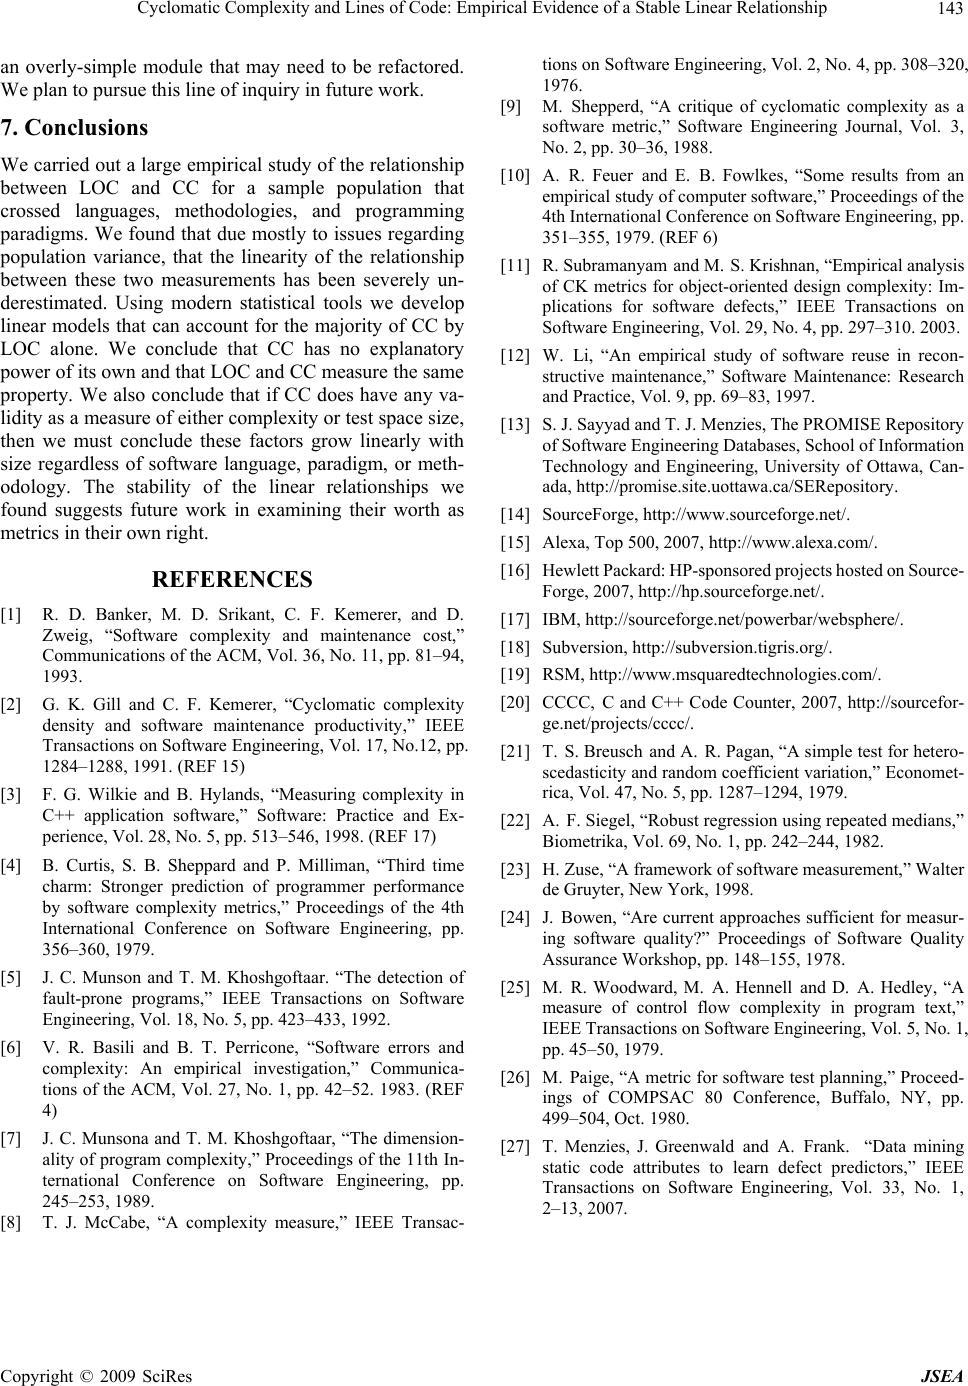 Cycloma t ic Complexity and Lines of Code: Empirical Evidence of a Stable Linear Relationship143 an overly-simple module that may need to be refactored. We plan to pursue this line of inquiry in future work. 7. Conclusions We carried out a large empirical study of the relationship between LOC and CC for a sample population that crossed languages, methodologies, and programming paradigms. We found that due mostly to issues regarding population variance, that the linearity of the relationship between these two measurements has been severely un- derestimated. Using modern statistical tools we develop linear models that can account for the majority of CC by LOC alone. We conclude that CC has no explanatory power of its own and th at LOC and CC measure th e same property. We also conclude that if CC does have any va- lidity as a measure of either complexity or test space size, then we must conclude these factors grow linearly with size regardless of software language, paradigm, or meth- odology. The stability of the linear relationships we found suggests future work in examining their worth as metrics in their own right. REFERENCES [1] R. D. Banker, M. D. Srikant, C. F. Kemerer, and D. Zweig, “Software complexity and maintenance cost,” Communications of the ACM, Vol. 36, No. 11, pp. 81–94, 1993. [2] G. K. Gill and C. F. Kemerer, “Cyclomatic complexity density and software maintenance productivity,” IEEE Transactions on Software Engineering, Vol. 17, No.12, pp. 1284–1288, 1991. (REF 15) [3] F. G. Wilkie and B. Hylands, “Measuring complexity in C++ application software,” Software: Practice and Ex- perience, Vol. 28, No. 5, pp. 513–546, 1998. (REF 17) [4] B. Curtis, S. B. Sheppard and P. Milliman, “Third time charm: Stronger prediction of programmer performance by software complexity metrics,” Proceedings of the 4th International Conference on Software Engineering, pp. 356–360, 1979. [5] J. C. Munson and T. M. Khoshgoftaar. “The detection of fault-prone programs,” IEEE Transactions on Software Engineering, Vol. 18, No. 5, pp. 423–433, 1992. [6] V. R. Basili and B. T. Perricone, “Software errors and complexity: An empirical investigation,” Communica- tions of the ACM, Vol. 27, No. 1, pp. 42–52. 1983. (REF 4) [7] J. C. Munsona and T. M. Khoshgoftaar, “The dimension- ality of program complexity,” Proceedings of the 11th In- ternational Conference on Software Engineering, pp. 245–253, 1989. [8] T. J. McCabe, “A complexity measure,” IEEE Transac- tions on Software Engineering, Vol. 2, No. 4, pp. 308–320, 1976. [9] M. Shepperd, “A critique of cyclomatic complexity as a software metric,” Software Engineering Journal, Vol. 3, No. 2, pp. 30–36, 1988. [10] A. R. Feuer and E. B. Fowlkes, “Some results from an empirical study of computer software,” Proceedings of the 4th Internation al Co nferenc e on Softw are Engine ering, pp. 351–355, 1979. (REF 6) [11] R. Subramanyam and M. S. Krishnan, “Empirical analysis of CK metrics for object-oriented design complexity: Im- plications for software defects,” IEEE Transactions on Software Engineering, Vol. 29, No. 4, pp. 297–310. 2003. [12] W. Li, “An empirical study of software reuse in recon- structive maintenance,” Software Maintenance: Research and Practice, Vol. 9, pp. 69–83, 1997. [13] S. J. Sayyad and T. J. Menzies, The PROMISE Reposi tor y of Software Engineering Databases, School of Inf or mation Technology and Engineering, University of Ottawa, Can- ada, http://promise.site.uottawa.ca/SERepository. [14] SourceForge, http://www.sourceforge.net/. [15] Alexa, Top 500, 2007, http://www.alexa.com/. [16] Hewlett Packard: HP-sponsored projects hosted on Source- Forge, 2007, http://hp.sourceforge.net/. [17] IBM, http://sourceforge.net/powerbar/websphere/. [18] Subversion, http://subversion.tigris.org/. [19] RSM, http://www.msquaredtechnologies.com/. [20] CCCC, C and C++ Code Counter, 2007, http://sourcefor- ge.net/projects/cccc/. [21] T. S. Breusch and A. R. Pagan, “A simple test for hetero- scedasticity and random coefficient variation,” Economet- rica, Vol. 47, No. 5, pp. 1287–1294, 1979. [22] A. F. Siegel, “Robust regression using repeated medians,” Biometrika, Vol. 69, No. 1, pp. 242–244, 1982. [23] H. Zuse, “A fra mework of software measurement,” W alter de Gruyter, New York, 1998. [24] J. Bowen, “Are current approaches sufficient for measur- ing software quality?” Proceedings of Software Quality Assurance Workshop, pp. 148–155, 1978. [25] M. R. Woodward, M. A. Hennell and D. A. Hedley, “A measure of control flow complexity in program text,” IEEE Transact ions on Softwar e Engineering, Vol. 5, No. 1, pp. 45–50, 1979. [26] M. Paige, “A metric for software test planning,” Proceed- ings of COMPSAC 80 Conference, Buffalo, NY, pp. 499–504, Oct. 1980. [27] T. Menzies, J. Greenwald and A. Frank. “Data mining static code attributes to learn defect predictors,” IEEE Transactions on Software Engineering, Vol. 33, No. 1, 2–13, 2007. Copyright © 2009 SciRes JSEA |

