Paper Menu >>
Journal Menu >>
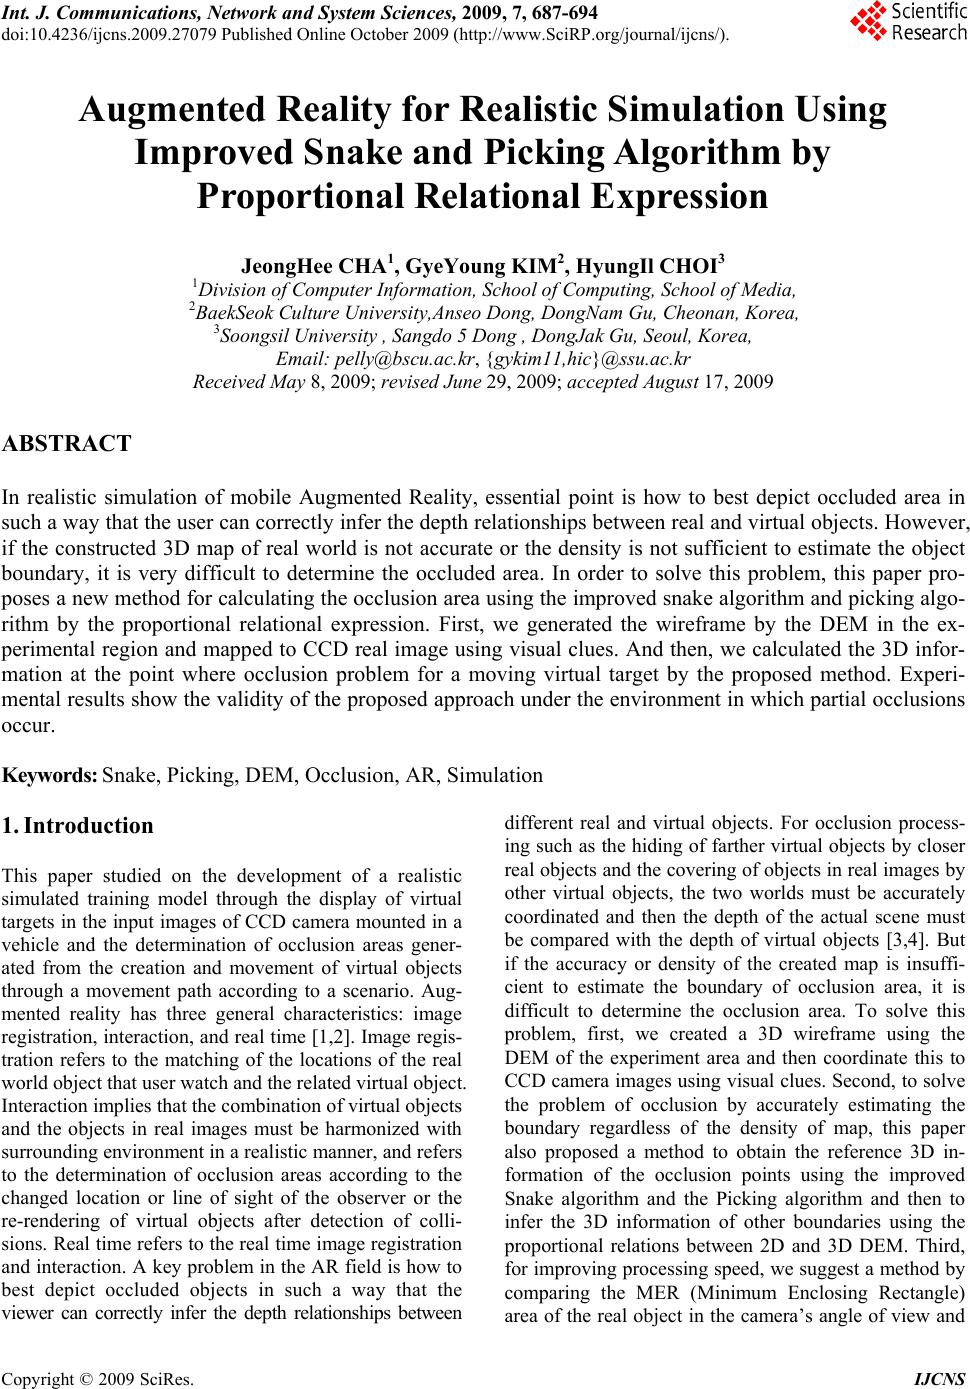 Int. J. Communications, Network and System Sciences, 2009, 7, 687-694 doi:10.4236/ijcns.2009.27079 Published Online October 2009 (http://www.SciRP.org/journal/ijcns/). Copyright © 2009 SciRes. IJCNS 687 Augmented Reality for Realistic Simulation Using Improved Snake and Picking Algorithm by Proportional Relational Expression JeongHee CHA1, GyeYoung KIM2, HyungIl CHOI3 1Division of Computer Information, School of Computing, School of Media, 2BaekSeok Culture University,Anseo Dong, DongNam Gu, Cheonan, Korea, 3Soongsil University , Sangdo 5 Dong , DongJak Gu, Seoul, Korea, Email: pelly@bscu.ac.kr, {gykim11,hic}@ssu.ac.kr Received May 8, 2009; revised June 29, 2009; accepted August 17, 2009 ABSTRACT In realistic simulation of mobile Augmented Reality, essential point is how to best depict occluded area in such a way that the user can correctly infer the depth relationships between real and virtual objects. However, if the constructed 3D map of real world is not accurate or the density is not sufficient to estimate the object boundary, it is very difficult to determine the occluded area. In order to solve this problem, this paper pro- poses a new method for calculating the occlusion area using the improved snake algorithm and picking algo- rithm by the proportional relational expression. First, we generated the wireframe by the DEM in the ex- perimental region and mapped to CCD real image using visual clues. And then, we calculated the 3D infor- mation at the point where occlusion problem for a moving virtual target by the proposed method. Experi- mental results show the validity of the proposed approach under the environment in which partial occlusions occur. Keywords: Snake, Picking, DEM, Occlusion, AR, Simulation 1. Introduction This paper studied on the development of a realistic simulated training model through the display of virtual targets in the input images of CCD camera mounted in a vehicle and the determination of occlusion areas gener- ated from the creation and movement of virtual objects through a movement path according to a scenario. Aug- mented reality has three general characteristics: image registration, interaction, and real time [1,2]. Image regis- tration refers to the matching of the locations of the real world object that user watch and the related virtual object. Interaction implies that the combination of virtual objects and the objects in real images must be harmonized with surrounding environment in a realistic manner, and refers to the determination of occlusion areas according to the changed location or line of sight of the observer or the re-rendering of virtual objects after detection of colli- sions. Real time refers to the real time image registration and interaction. A key problem in the AR field is how to best depict occluded objects in such a way that the viewer can correctly infer the depth relationships between different real and virtual objects. For occlusion process- ing such as the hiding of farther virtual objects by closer real objects and the covering of objects in real images by other virtual objects, the two worlds must be accurately coordinated and then the depth of the actual scene must be compared with the depth of virtual objects [3,4]. But if the accuracy or density of the created map is insuffi- cient to estimate the boundary of occlusion area, it is difficult to determine the occlusion area. To solve this problem, first, we created a 3D wireframe using the DEM of the experiment area and then coordinate this to CCD camera images using visual clues. Second, to solve the problem of occlusion by accurately estimating the boundary regardless of the density of map, this paper also proposed a method to obtain the reference 3D in- formation of the occlusion points using the improved Snake algorithm and the Picking algorithm and then to infer the 3D information of other boundaries using the proportional relations between 2D and 3D DEM. Third, for improving processing speed, we suggest a method by comparing the MER (Minimum Enclosing Rectangle) area of the real object in the camera’s angle of view and  J. H. CHA ET AL. 688 the MER of the virtual target. We briefly review related work in Section 2. In Sec- tion 3, we outline the framework of our proposed algo- rithm. The methodology of Wireframe modeling, im- proved snake algorithm for extracting image boundary and picking algorithm for acquiring 3D information are explained in Section 4. Section 5, we show the experi- mental results and the validity of the proposed approach. Finally, in Section 6 we discuss drawbacks of the algo- rithm and propose possible future work. 2. Previous Work A basic design decision in building an AR system is how to accomplish the combining of real and virtual. Toward this purpose, many researchers make efforts to minimize virtual objects registration error and to increase the real- ness of virtual objects [5]. Drastic and Milgram list a number of cues that a user may use to interpret depth, including image resolution and clarity, contrast and lu- minance, occlusion, depth of field and accommodation [6]. We can use one of two technologies to see the real world in AR, one is optical see-through and the other is video see-through. These technologies can present oc- cluded objects, and each has a variety of challenges [7]. Blurring also can help compensate for depth perception errors [8]. Koch uses computer vision techniques to infer dense and accurate depth maps from image pairs, and uses this information to construct 3D graphical represen- tations of the restricted static environment [9]. Several authors observe that providing correct occlusion of real objects by virtual objects requires a scene model. Correct occlusion relationships do not necessarily need to be displayed at all pixels. The purpose of many applications is to see through real object. We introduce here mobile vehicle-mounted display system capable of resolving occlusion between real and virtual objects. We restricted the real environment to some area and constructed that area’s scene Model using 3D information. The heart of our system is boundary extraction algorithm and 3D in- formation inference algorithm of object boundary. Figure 1 shows our monitor-based training vehicle configura- tion. In our experimental vehicle configurations, we send steering, acceleration, brake data to car driving controller through Bluetooth using remote car controller. Vehicle can be controlled by transmitted data and we can get feedback of present car location data by mounted sensor system. RS232 communicator is interface between vehi- cle driving controller and sensor fusion system. And it receives instructions from sensor system. CCD camera views the environment. The camera may be static or mo- bile. In mobile case, the camera might move around by being attached to a vehicle, with their locations tracked by GPS and INS. The image of real world and the virtual images generated by a scene generator are combined. 3. System Flow Description Figure 2 outlines the framework of our proposed system. System has two stages. First stage is environment map construction stage. It consists of registration of two world using visual clues and object contour extraction and acquiring 3D information. Second stage is virtual object rendering stage. It has creation of virtual target path and selection of candidate occlusion object and oc- clusion processing. 4. Methodology 4.1. Formation of Wireframe Using DEM and Registration with Real Images Using Visual Clues The topographical information DEM (Digital Elevation Figure 1. Training vehicle configuration. Copyright © 2009 SciRes. IJCNS  J. H. CHA ET AL. 689 Model) is used to map the real world coordinates to each point of the 2D CCD image. DEM has information on the latitude and longitude coordinates expressed in X and Y and heights in fixed interval. The DEM used for this experiment is a grid-type DEM which had been produced to have the height information for 2D coordinates in 1M interval for the limited experiment area of 300 m x 300 m. The DEM data are read to create a mesh with the ver- texes of each rectangle and a wireframe with 3D depth information [10,11] as Figure 3. This is overlaid on the sensor image to check the coordination, and visual clues are used to move the image to up, down, left or right as shown in Figure 4, thus reducing error. Based on this initial coordinated location, the location changes by movement of vehicles were frequently updated using GPS (Global Positioning System) and INS (Inertial Navi- gation System). 4.2. Extracting the Contour of Objects in Image by Enhanced Snake Algorithm 4.2.1. Edge Map Using Gradient Vector Flow The Snake algorithm [12,13] is a method of finding the outline of an object by repeatedly moving to the direction of minimizing energy function from the snake vertex input by user. But existing snake algorithm cannot accu- rately extract the contour information when the object form is complex because as shown in Figure 5, the direc- tion of the energy function appears as a composite vector of the current, previous, and the next snake points, and shrinks toward the center of these points. To solve this problem, this paper proposes a method to form an edge Figure 2. Proposed system framework. Figure 3. Wireframe creation using DEM. Figure 4. Registration of two worlds using visual clues. Figure 5. The direction of energy minimization search in snake algorithm. map using the Gradient Vector Flow (GVF) algorithm [14,15,16], and add a new energy term that indicates the distance between the searched edge point and snake point so as to extract an accurate contour. The GVF algorithm can measure the contour of com- plex objects using the gradient of edge, and move to the concave contour regardless of initialization. Further, the gradient vector of the edge map has a larger value as it is near edge, and approaches zero as it is farther. This paper uses the edge information of the gradient vector flow to search the proximal edge point, and when there is an edge, adds a new energy term(Eedge-distance) that shows the dis tance from the reference point to the searched edge as Equation (1). Here, α β, and γ are all set to 1 without exhaustive adjustment . 1 0 tan (()) (()) (()) (()) snake continuitycurvature imageedge disce EEvsEvs EvsE vsds (1) 4.2.2. The Proximal Edge Search Method Figure 6 shows a proposed proximal edge search method in this paper. First it searches edge points while rotating around the axis d which is the connection between current and pre- vious snake points vi and vi-1. In other words, if the angle formed by the three points vi, vi-1, and vi-2 is , to pre- vent the situation where the axis meets with or passes by vi-2 and meets vi again, it searches the edge point where the image strength ▽I is greater than the thresh- old while rotating only by ' i v 2 and adds a new energy term using the value of the distance d’ between vi and ' to the existing algorithm. This paper determined the rotation i v Copyright © 2009 SciRes. IJCNS  J. H. CHA ET AL. 690 direction for accurate search by assuming the following two facts: First, it was assumed that the initial snake points form a closed curve that encloses the object. Sec- ond, it was assumed that the points were arranged se- quentially in one direction. The reason for this was be- cause to search proximal edge, it must move inside the contour, but the direction may be wrong due to the di- versity of object forms if simply the direction to the ob- ject center is set. Figure 7 is an example of setting the rotation direction of the snake points. 4.2.3. Calc ul a tion of Eedge-distance Figure 8 is an example of calculating the distance be- tween an arbitrary snake point vi and the edge around it. If we surround the arbitrary point vi with a 9×9 win- dow and assume that its distance with a new edge is , the height and width of the window are s, and the hori- zontal and vertical positions of the snake point in the window are m and n, the can be obtained with the Equation (2) by the Euclidean theorem, and the energy term to be added can be defined as the Equation (3) by applying the distance value instead of the brightness value of the image term. ' i v ' mn d ' mn d 22 '' '2() 12() 1 22 xx yy mn vv msvvns d (2) ''' ' minmax min ''' ' ()/( ()/( ) edge distanceii mn minmax min Evvdd ddd d )d (3) Added new energy term Eedge-distance is expressed to- gether with continuity and curvature energy terms in Figure 9. When only the two terms of the existing algo- rithm were considered, the minimum point of energy was in line 3, column 5, but the location changed to line 4, column 6 when the energy value in consideration of the distance between proximal edges was included. In con- clusion, the flow of the enhanced snake energy function to which the proximal edge energy function is added can extract the edge exactly in complex situations by ap- proaching the edge more closely. Table 1 shows the pseudo codes of the proposed algo- rithm using proximal edge search method. 4.3. Acquisition of 3D Information Using the Picking Algorithm In order to acquire the 3D information of the extracted vertexes, this paper used the Picking algorithm which is a well-known 3D graphics technique [17]. It finds the collision point with the 3D wireframe created by DEM that corresponds to the points in 2D image and provides the 3D information of the points. The picking search point is the lowest point of the vertexes of the objects Figure 6. The proximal edge search method. Figure 7. Snake’s rotation direction. Figure 8. Distance between a point of snake and edge. Figure 9. Changed energy minimization point by proposed algorithm. Copyright © 2009 SciRes. IJCNS 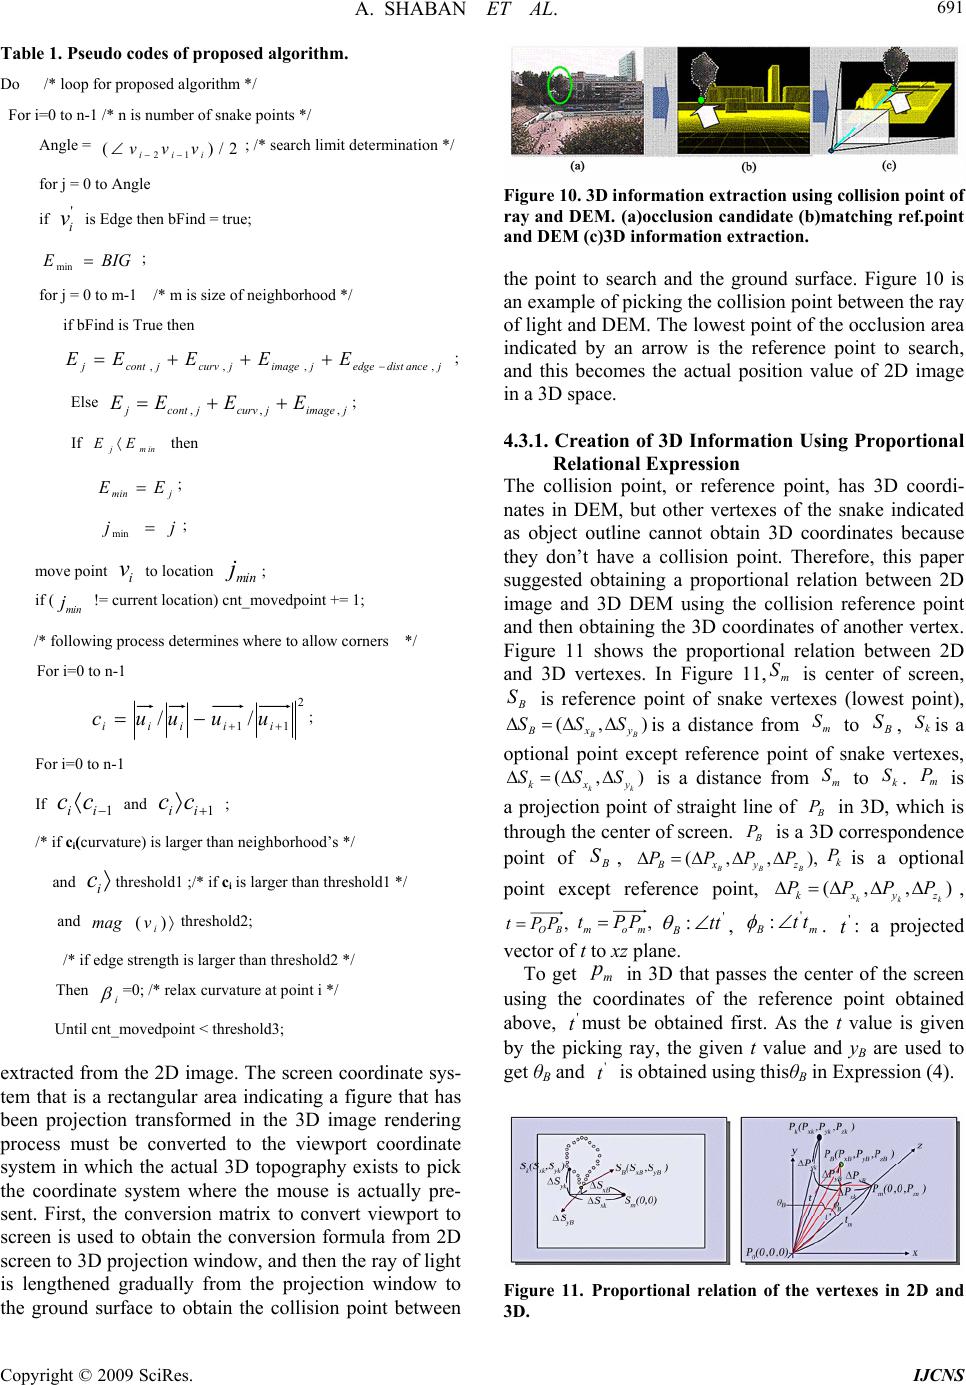 A. SHABAN ET AL. Copyright © 2009 SciRes. IJCNS 691 Table 1. Pseudo codes of proposed algorithm. Do /* loop for proposed algorithm */ For i=0 to n-1 /* n is number of snake points */ Angle = ; /* search limit determination */ 2/)( 12 iii vvv for j = 0 to Angle if is Edge then bFind = true; ' i v BIGE min ; for j = 0 to m-1 /* m is size of neighborhood */ if bFind is True then jancedistedgejimagejcurvjcontjEEEEE ,,,, ; Else ; jimagejcurvjcontj EEEE ,,, If then inmj EE jinm E E ; j j min ; move point to location ; if ( i vinm j inm j != current location) cnt_movedpoint += 1; /* following process determines where to allow corners */ For i=0 to n-1 2 11 // iiiii uuuuc ; For i=0 to n-1 If and ; 1 ii cc1 ii cc /* if ci(curvature) is larger than neighborhood’s */ and threshold1 ;/* if ci is larger than threshold1 */ i c and )( i v mag threshold2; /* if edge strength is larger than threshold2 */ Then =0; /* relax curvature at point i */ i Until cnt_movedpoint < threshold3; extracted from the 2D image. The screen coordinate sys- tem that is a rectangular area indicating a figure that has been projection transformed in the 3D image rendering process must be converted to the viewport coordinate system in which the actual 3D topography exists to pick the coordinate system where the mouse is actually pre- sent. First, the conversion matrix to convert viewport to screen is used to obtain the conversion formula from 2D screen to 3D projection window, and then the ray of light is lengthened gradually from the projection window to the ground surface to obtain the collision point between Figure 10. 3D information extraction using collision point of ray and DEM. (a)occlusion candidate (b)matching ref.point and DEM (c)3D information extraction. the point to search and the ground surface. Figure 10 is an example of picking the collision point between the ray of light and DEM. The lowest point of the occlusion area indicated by an arrow is the reference point to search, and this becomes the actual position value of 2D image in a 3D space. 4.3.1. Creation of 3D Information Using Proportional Relational Expression The collision point, or reference point, has 3D coordi- nates in DEM, but other vertexes of the snake indicated as object outline cannot obtain 3D coordinates because they don’t have a collision point. Therefore, this paper suggested obtaining a proportional relation between 2D image and 3D DEM using the collision reference point and then obtaining the 3D coordinates of another vertex. Figure 11 shows the proportional relation between 2D and 3D vertexes. In Figure 11,m S is center of screen, B S is reference point of snake vertexes (lowest point), ),( BB yx SS B S is a distance from to , is a optional point except reference point of snake vertexes, m SB Sk S ),( kk yxSS k S is a distance from to . m Sk Sm P is a projection point of straight line of B P in 3D, which is through the center of screen. B P is a 3D correspondence point of , B SP),, z P,( B xB PBB y P k P is a optional point except reference point, ) k,k z P,k y P(xk P P , , BOPPt , mom PPt ' :tt B , . : a projected vector of t to xz plane. m t B t:'' t To get m p in 3D that passes the center of the screen using the coordinates of the reference point obtained above, must be obtained first. As the t value is given by the picking ray, the given t value and yB are used to get θB and is obtained using thisθB in Expression (4). ' t ' t Figure 11. Proportional relation of the vertexes in 2D and 3D. 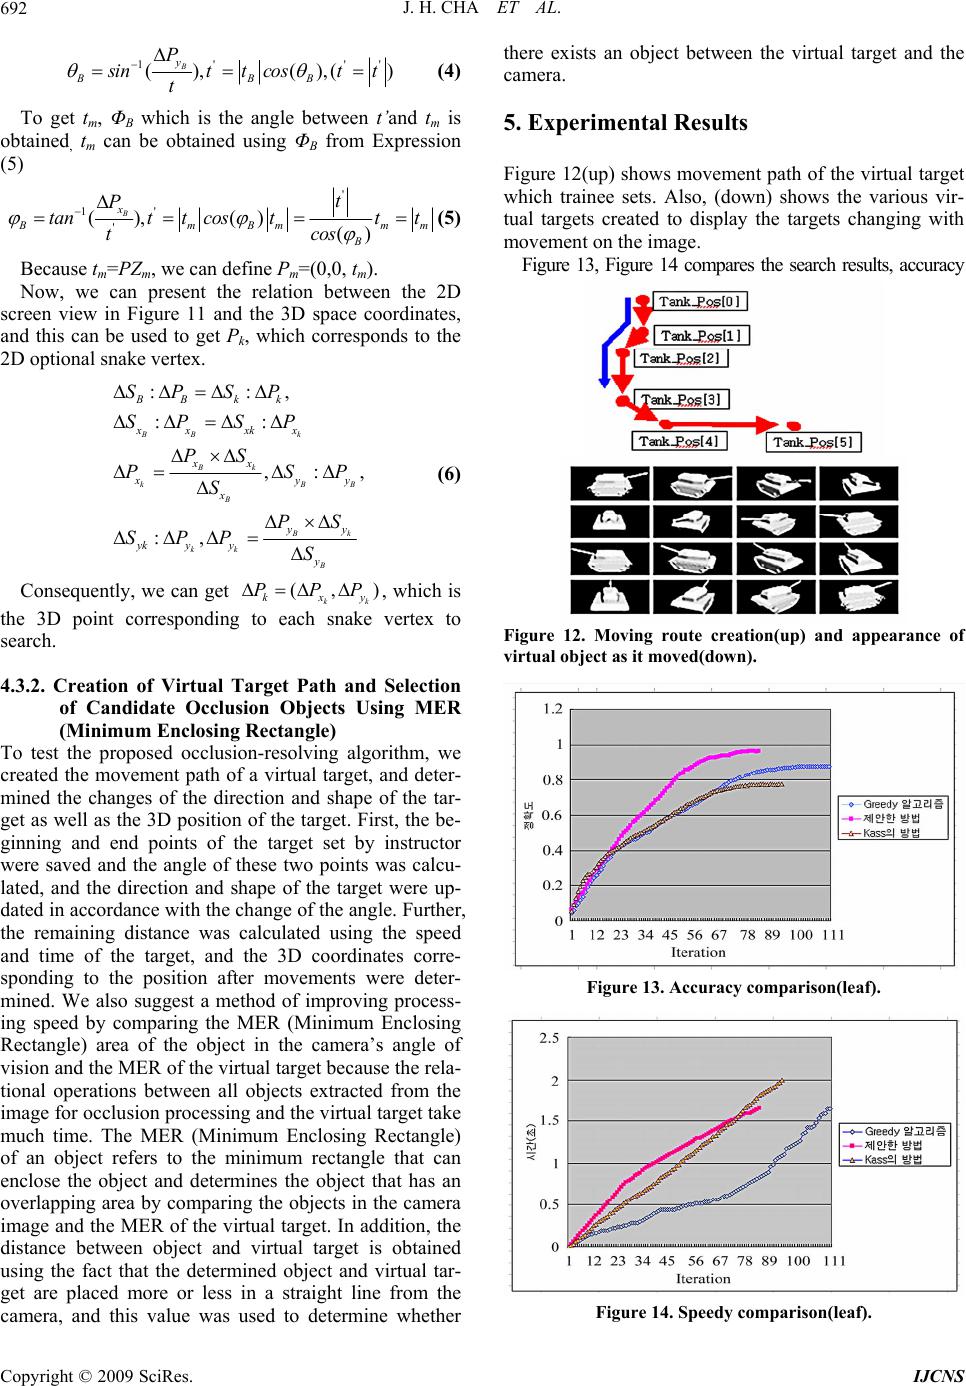 J. H. CHA ET AL. Copyright © 2009 SciRes. IJCNS 692 1' ' (),(),( B y BBB P' ) s intt costt t (4) To get tm, ΦB which is the angle between t’and tm is obtained, tm can be obtained using ΦB from Expression (5) ' 1' ' (),() () B x B mBmm B t P tantt costtt cos t m (5) Because tm=PZm, we can define Pm=(0,0, tm). Now, we can present the relation between the 2D screen view in Figure 11 and the 3D space coordinates, and this can be used to get Pk, which corresponds to the 2D optional snake vertex. ::, :: ,: :, BB k Bk k B Bk kk B BB kk xx xkx xx , B B x yy x yy yk y y y SP SP SP SP PS PS S PS SPPS P (6) Consequently, we can get ),(kk yxk PPP , which is the 3D point corresponding to each snake vertex to search. 4.3.2. Creation of Virtual Target Path and Selection of Candidate Occlusion Objects Using MER (Minimum Enclosing Rectangle) To test the proposed occlusion-resolving algorithm, we created the movement path of a virtual target, and deter- mined the changes of the direction and shape of the tar- get as well as the 3D position of the target. First, the be- ginning and end points of the target set by instructor were saved and the angle of these two points was calcu- lated, and the direction and shape of the target were up- dated in accordance with the change of the angle. Further, the remaining distance was calculated using the speed and time of the target, and the 3D coordinates corre- sponding to the position after movements were deter- mined. We also suggest a method of improving process- ing speed by comparing the MER (Minimum Enclosing Rectangle) area of the object in the camera’s angle of vision and the MER of the virtual target because the rela- tional operations between all objects extracted from the image for occlusion processing and the virtual target take much time. The MER (Minimum Enclosing Rectangle) of an object refers to the minimum rectangle that can enclose the object and determines the object that has an overlapping area by comparing the objects in the camera image and the MER of the virtual target. In addition, the distance between object and virtual target is obtained using the fact that the determined object and virtual tar- get are placed more or less in a straight line from the camera, and this value was used to determine whether there exists an object between the virtual target and the camera. 5. Experimental Results Figure 12(up) shows movement path of the virtual target which trainee sets. Also, (down) shows the various vir- tual targets created to display the targets changing with movement on the image. Figure 13, Figure 14 compares the search results, accuracy Figure 12. Moving route creation(up) and appearance of virtual object as it moved(down). Figure 13. Accuracy comparison(leaf). Figure 14. Speedy comparison(leaf). 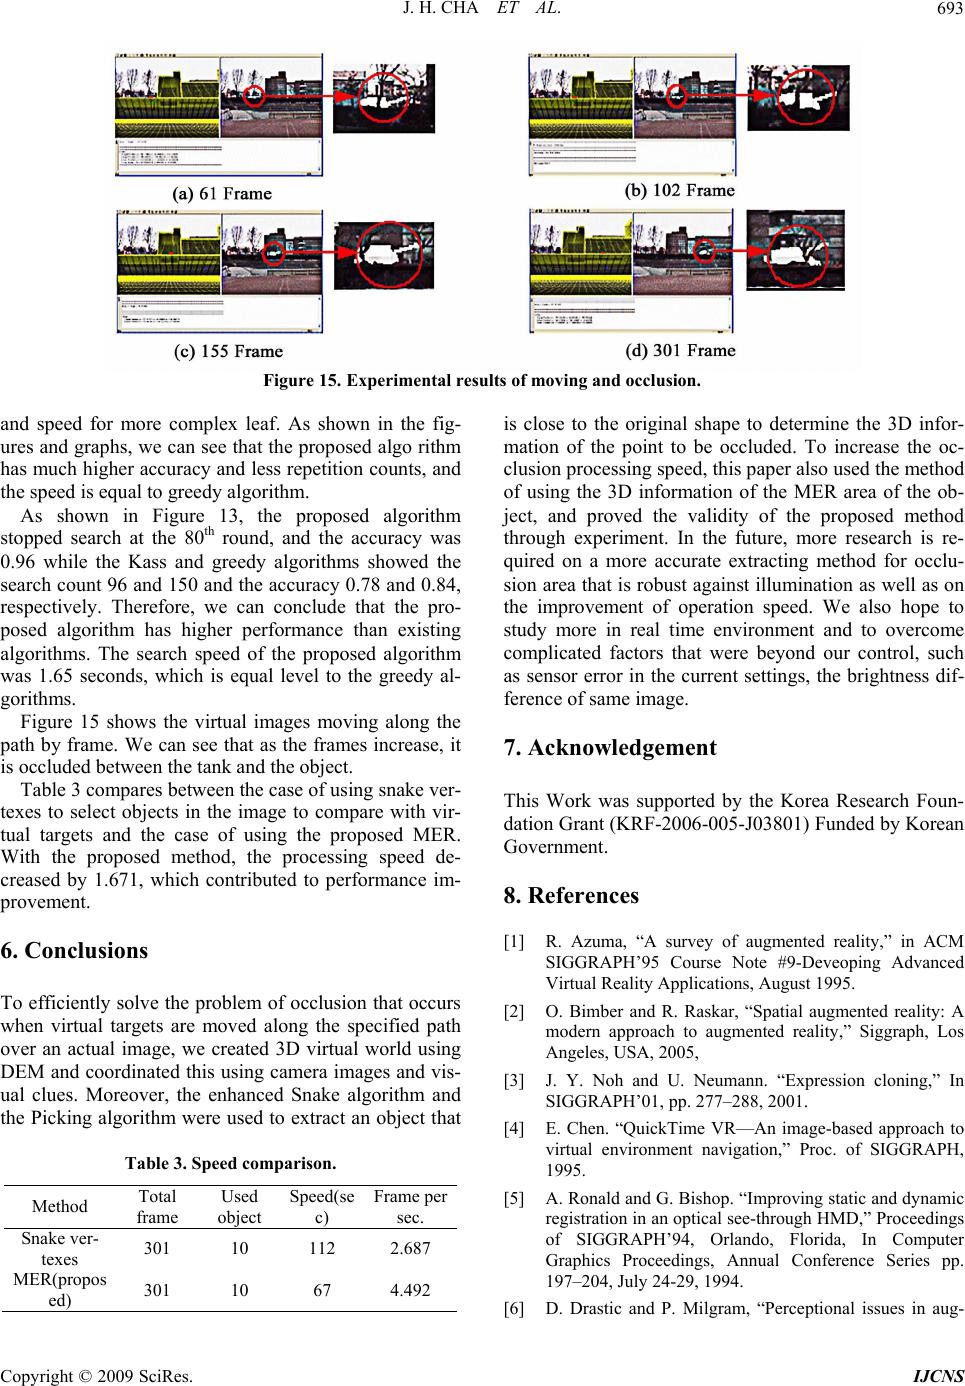 J. H. CHA ET AL. 693 Figure 15. Experimental results of moving and occlusion. and speed for more complex leaf. As shown in the fig- ures and graphs, we can see that the proposed algo rithm has much higher accuracy and less repetition counts, and the speed is equal to greedy algorithm. As shown in Figure 13, the proposed algorithm stopped search at the 80th round, and the accuracy was 0.96 while the Kass and greedy algorithms showed the search count 96 and 150 and the accuracy 0.78 and 0.84, respectively. Therefore, we can conclude that the pro- posed algorithm has higher performance than existing algorithms. The search speed of the proposed algorithm was 1.65 seconds, which is equal level to the greedy al- gorithms. Figure 15 shows the virtual images moving along the path by frame. We can see that as the frames increase, it is occluded between the tank and the object. Table 3 compares between the case of using snake ver- texes to select objects in the image to compare with vir- tual targets and the case of using the proposed MER. With the proposed method, the processing speed de- creased by 1.671, which contributed to performance im- provement. 6. Conclusions To efficiently solve the problem of occlusion that occurs when virtual targets are moved along the specified path over an actual image, we created 3D virtual world using DEM and coordinated this using camera images and vis- ual clues. Moreover, the enhanced Snake algorithm and the Picking algorithm were used to extract an object that Table 3. Speed comparison. Method Total frame Used object Speed(se c) Frame per sec. Snake ver- texes 301 10 112 2.687 MER(propos ed) 301 10 67 4.492 is close to the original shape to determine the 3D infor- mation of the point to be occluded. To increase the oc- clusion processing speed, this paper also used the method of using the 3D information of the MER area of the ob- ject, and proved the validity of the proposed method through experiment. In the future, more research is re- quired on a more accurate extracting method for occlu- sion area that is robust against illumination as well as on the improvement of operation speed. We also hope to study more in real time environment and to overcome complicated factors that were beyond our control, such as sensor error in the current settings, the brightness dif- ference of same image. 7. Acknowledgement This Work was supported by the Korea Research Foun- dation Grant (KRF-2006-005-J03801) Funded by Korean Government. 8. References [1] R. Azuma, “A survey of augmented reality,” in ACM SIGGRAPH’95 Course Note #9-Deveoping Advanced Virtual Reality Applications, August 1995. [2] O. Bimber and R. Raskar, “Spatial augmented reality: A modern approach to augmented reality,” Siggraph, Los Angeles, USA, 2005, [3] J. Y. Noh and U. Neumann. “Expression cloning,” In SIGGRAPH’01, pp. 277–288, 2001. [4] E. Chen. “QuickTime VR—An image-based approach to virtual environment navigation,” Proc. of SIGGRAPH, 1995. [5] A. Ronald and G. Bishop. “Improving static and dynamic registration in an optical see-through HMD,” Proceedings of SIGGRAPH’94, Orlando, Florida, In Computer Graphics Proceedings, Annual Conference Series pp. 197–204, July 24-29, 1994. [6] D. Drastic and P. Milgram, “Perceptional issues in aug- Copyright © 2009 SciRes. IJCNS 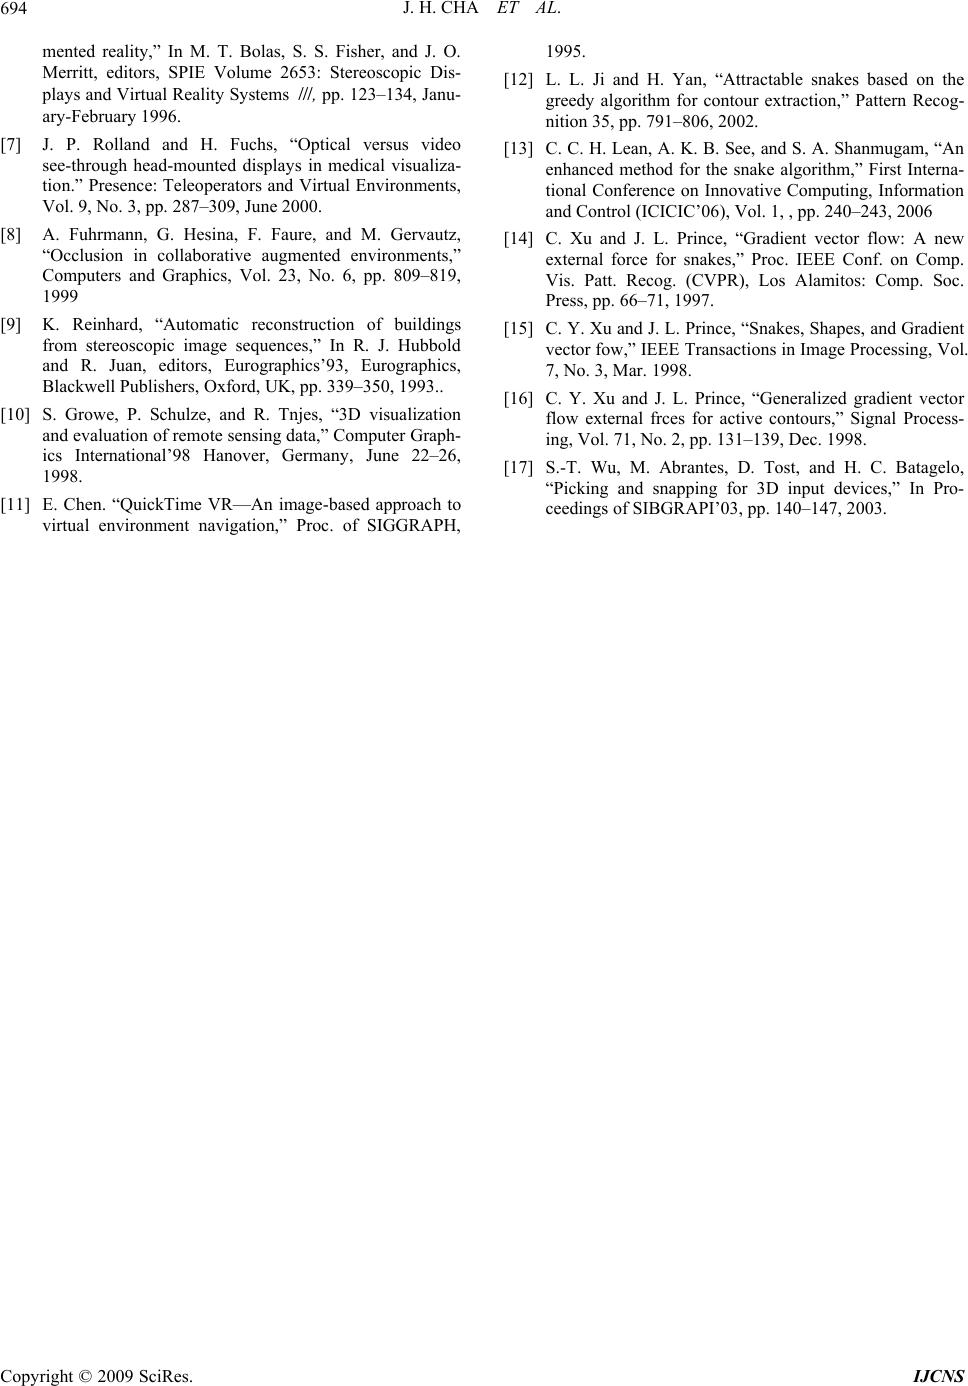 J. H. CHA ET AL. 694 mented reality,” In M. T. Bolas, S. S. Fisher, and J. O. Merritt, editors, SPIE Volume 2653: Stereoscopic Dis- plays and Virtual Reality Systems Ⅲ , pp. 123–134, Janu- ary-February 1996. [7] J. P. Rolland and H. Fuchs, “Optical versus video see-through head-mounted displays in medical visualiza- tion.” Presence: Teleoperators and Virtual Environments, Vol. 9, No. 3, pp. 287–309, June 2000. [8] A. Fuhrmann, G. Hesina, F. Faure, and M. Gervautz, “Occlusion in collaborative augmented environments,” Computers and Graphics, Vol. 23, No. 6, pp. 809–819, 1999 [9] K. Reinhard, “Automatic reconstruction of buildings from stereoscopic image sequences,” In R. J. Hubbold and R. Juan, editors, Eurographics’93, Eurographics, Blackwell Publishers, Oxford, UK, pp. 339–350, 1993.. [10] S. Growe, P. Schulze, and R. Tnjes, “3D visualization and evaluation of remote sensing data,” Computer Graph- ics International’98 Hanover, Germany, June 22–26, 1998. [11] E. Chen. “QuickTime VR—An image-based approach to virtual environment navigation,” Proc. of SIGGRAPH, 1995. [12] L. L. Ji and H. Yan, “Attractable snakes based on the greedy algorithm for contour extraction,” Pattern Recog- nition 35, pp. 791–806, 2002. [13] C. C. H. Lean, A. K. B. See, and S. A. Shanmugam, “An enhanced method for the snake algorithm,” First Interna- tional Conference on Innovative Computing, Information and Control (ICICIC’06), Vol. 1, , pp. 240–243, 2006 [14] C. Xu and J. L. Prince, “Gradient vector flow: A new external force for snakes,” Proc. IEEE Conf. on Comp. Vis. Patt. Recog. (CVPR), Los Alamitos: Comp. Soc. Press, pp. 66–71, 1997. [15] C. Y. Xu and J. L. Prince, “Snakes, Shapes, and Gradient vector fow,” IEEE Transactions in Image Processing, Vol. 7, No. 3, Mar. 1998. [16] C. Y. Xu and J. L. Prince, “Generalized gradient vector flow external frces for active contours,” Signal Process- ing, Vol. 71, No. 2, pp. 131–139, Dec. 1998. [17] S.-T. Wu, M. Abrantes, D. Tost, and H. C. Batagelo, “Picking and snapping for 3D input devices,” In Pro- ceedings of SIBGRAPI’03, pp. 140–147, 2003. Copyright © 2009 SciRes. IJCNS |