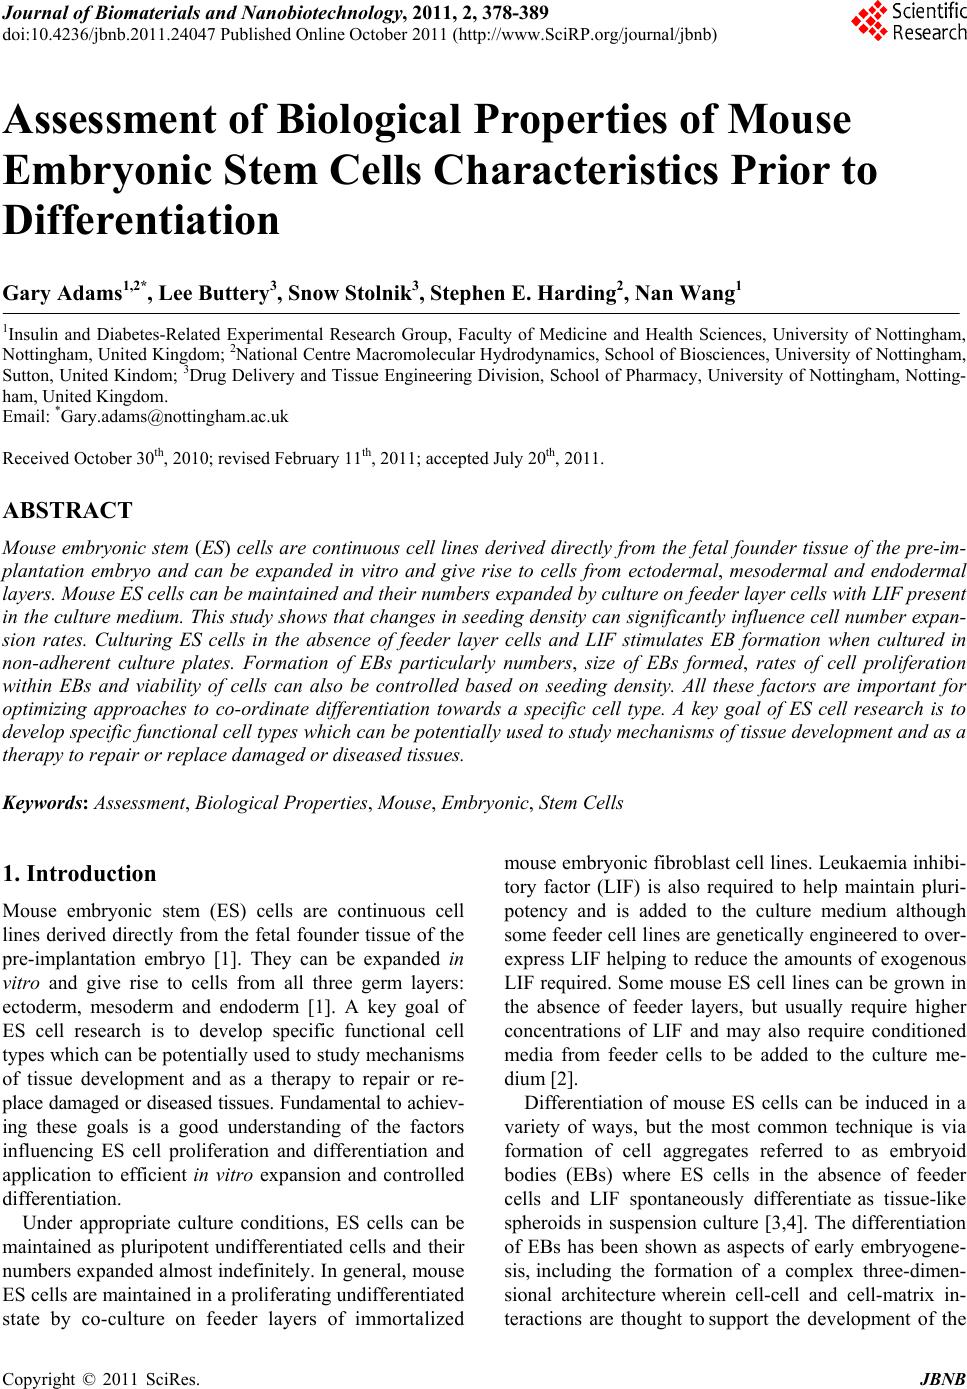
 Journal of Biomaterials and Nanobiotechnology, 2011, 2, 378-389 doi:10.4236/jbnb.2011.24047 Published Online October 2011 (http://www.SciRP.org/journal/jbnb) Copyright © 2011 SciRes. JBNB Assessment of Biological Properties of Mouse Embryonic Stem Cells Characteristics Prior to Differentiation Gary Adams1,2*, Lee Buttery3, Snow Stolnik3, Stephen E. Harding2, Nan Wang1 1Insulin and Diabetes-Related Experimental Research Group, Faculty of Medicine and Health Sciences, University of Nottingham, Nottingham, United Kingdom; 2National Centre Macromolecular Hydrodynamics, School of Biosciences, University of Nottingham, Sutton, United Kindom; 3Drug Delivery and Tissue Engineering Division, School of Pharmacy, University of Nottingham, Notting- ham, United Kingdom. Email: *Gary.adams@nottingham.ac.uk Received October 30th, 2010; revised February 11th, 2011; accepted July 20th, 2011. ABSTRACT Mouse embryonic stem (ES) cells are continuous cell lines derived directly from the fetal founder tissue of the pre-im- plantation embryo and can be expanded in vitro and give rise to cells from ectodermal, mesodermal and endodermal layers. Mouse ES cells can be maintained and their numbers expanded by culture on feeder layer cells with LIF present in the culture medium. This study shows that changes in seeding density can significantly influence cell number expan- sion rates. Culturing ES cells in the absence of feeder layer cells and LIF stimulates EB formation when cultured in non-adherent culture plates. Formation of EBs particularly numbers, size of EBs formed, rates of cell proliferation within EBs and viability of cells can also be controlled based on seeding density. All these factors are important for optimizing approaches to co-ordinate differentiation towards a specific cell type. A key goal of ES cell research is to develop specific functional cell types which can be potentially used to study mechanisms of tissue development and as a therapy to repair or replace damaged or diseased tissues. Keywords: Assessment, Biological Properties, Mouse, Embryonic, Stem Cells 1. Introduction Mouse embryonic stem (ES) cells are continuous cell lines derived directly from the fetal founder tissue of the pre-implantation embryo [1]. They can be expanded in vitro and give rise to cells from all three germ layers: ectoderm, mesoderm and endoderm [1]. A key goal of ES cell research is to develop specific functional cell types which can be potentially used to study mechanisms of tissue development and as a therapy to repair or re- place damaged or diseased tissues. Fundamental to achiev- ing these goals is a good understanding of the factors influencing ES cell proliferation and differentiation and application to efficient in vitro expansion and controlled differentiation. Under appropriate culture conditions, ES cells can be maintained as pluripotent undifferentiated cells and their numbers expanded almost indefinitely. In general, mouse ES cells are maintained in a proliferating undifferentiated state by co-culture on feeder layers of immortalized mouse embryonic fibroblast cell lines. Leukaemia inhibi- tory factor (LIF) is also required to help maintain pluri- potency and is added to the culture medium although some feeder cell lines are genetically engineered to over- express LIF helping to reduce the amounts of exogenous LIF required. Some mouse ES cell lines can be grown in the absence of feeder layers, but usually require higher concentrations of LIF and may also require conditioned media from feeder cells to be added to the culture me- dium [2]. Differentiation of mouse ES cells can be induced in a variety of ways, but the most common technique is via formation of cell aggregates referred to as embryoid bodies (EBs) where ES cells in the absence of feeder cells and LIF spontaneously differentiate as tissue-like spheroids in suspension culture [3,4]. The differentiation of EBs has been shown as aspects of early embryogene- sis, including the formation of a complex three-dimen- sional architecture wherein cell-cell and cell-matrix in- teractions are thought to support the development of the  Assessment of Biological Properties of Mouse Embryonic Stem Cells Characteristics Prior to Differentiation379 three embryonic germ layers and their derivatives [5]. Standard methods of EB formation include hanging drop method, liquid suspension method, and methylcellulose culture. These culture systems maintain a balance be- tween allowing ES cell aggregation necessary for EB formation and preventing EB over-agglomeration for efficient cell growth and differentiation [6]. There are also methods for scalable production of EBs using spin- ner flask, slow turning lateral vessel (STLV), and high aspect rotating vessel (HARV) bioreactor techniques [7-9]. Here, we assess mouse embryonic stem cells characte- ristics using various techniques to gain fundamental knowledge of their biological properties prior to investi- gating directed differentiation. ES cell proliferation con- ditions were optimized for different cell culture systems, which included the optimization of cell culture surface, cell seeding density and presence or absence of serum in the culture medium. Moreover, EB formation was stu- died in order to evaluate the ability of ES cells to differ- rentiate. Assessments were performed at different time points (after 1 day and 4 days culture) and included EB morphology, EB diameter assessments, total cell counts within each EB and monitoring cell viability. Although much research is now carried out on human stem cells, the use of animal stem cells still plays a vital role in characterising biological structure and function. 2. Materials and Methods 2.1. Cells Culture Mouse ES cells (cell line CEE 14) were maintained by culturing them on the mouse embryonic fibroblast feeder layer cells with Dulbecco’s Modified Eagles Medium (DMEM) supplemented with 10% fetal bovine serum (FBS) L- glutamine (2 mM), 1% Penicillin /Streptomycin (100 units/ml/0.1 mg/ml) and 0.1% β-mercaptoethanol and leukaemia inhibitory factor (LIF) (1000 U/ml) at 37˚C with 5% CO2. Fibroblast feeder layer cells were mitotically arrested by treatment with mitomycin C (0.02 mg/ml) and re- plated at a density of ~80,000 cells per ml on gelatin- coated tissue culture T25 flasks. ES cells were then seeded on the feeders after being allowed to attach for approximately 12 hours. Culture medium was changed every day. 2.2. Cell Counting In order to monitor ES cell proliferation under different culture conditions, total cell number counts were per- formed by haemocytometer. ES cell colonies were first detached from the feeder cells by brief trypsinization (~30 - 60 seconds) and gentle tapping of the plate dis- lodged the colonies. Colonies were collected by aspira- tion and trypsinized for a further 2 - 3 minutes with gen- tle pipetting to break up the colonies and achieved an even single cell suspension. Total cell count and cell vi- ability was assessed by the trypin blue exclusion method. 2.3. Trypin Blue Assay Trypin Blue is one of several stains recommended for use in dye exclusion procedures for viable cell counting. This method is based on the principle that live (viable) cells do not take up certain dyes, whereas dead (non-viable) cells do. Staining also facilitates the visualization of cell morphology. In this study, trypin blue was widely used to assess ES cells viability under varied culture conditions in both two dimensional and three dimensional culture systems. Practically, cell pellets were harvested and re-sus- pended to gain a homogenous suspension. Aliquot 50 µl of the cell suspension was mixed with an equal volume of the 0.4% (v/v) trypin blue solution and allowed to stand for 5 - 15 min. The cell suspension and trypin blue mixture was transferred to a haemocytometer and viable (non-stained) and non-viable (blue) cells were counted separately. 2.4. Alamar Blue Assay The Alamar Blue assay incorporates a fluorometric/calo- rimetric growth indicator based on the detection of meta- bolic activity. The system incorporates an oxidation- reduction (REDOX) indicator that both fluoresces and changes colour in response to a chemical reduction of growth medium resulting from cell growth. As cells grow in culture, innate metabolic activity results in a chemical reduction of the immediate surrounding environment. Continued growth maintains a reduced environment while inhibition of growth maintains an oxidized envi- ronment. Reduction related to growth causes the REDOX indicator to change from oxidised (non-fluorescent, blue) to a reduced form (fluorescent, red). In this study, Ala- mar blue assay was mainly used to monitor cells pro- liferation in the continuous culture systems and further explore the proliferation trend within specific time pe- riod. In general, Alamar blue stock solution was diluted into Hanks Balanced Salts Solution (HBSS) without Phenol Red (Sigma; Cat.No. H1387) to get 10% working solu- tion. This working solution was mixed and sterilised with 0.2 µm filters and then kept in the dark or wrapped in foil until ready to use. To assess cell viability over a period of time, triplicate samples were required for each measurement. Cells were allowed to grow on appropriate surfaces until confluent. Harvest and count cells and dilute to gain a cell concen- Copyright © 2011 SciRes. JBNB  Assessment of Biological Properties of Mouse Embryonic Stem Cells Characteristics Prior to Differentiation 380 tration of 1 × 10⁵ cells/mL in complete cell culture media. 1 ml cell suspension added to each assay well of the 24 well plate and incubated at 37˚C, 5% CO2, to allow cells to attach. The media was aspirated from the wells and washed with 3 x warm, sterile PBS. 1 ml Alamar Blue working solution was transferred into each well and in- cubate at 37˚C, 5% CO2 for 90 min. 100 µl of the Alamar Blue working solution (post-incubation with cells) was transferred to a 96 microtitre well plate and then wrapped in foil until ready to measure fluorescence (Ex 560 nm/ Em 590 nm). Empty wells with no cells attached were used as blank. 2.5. Live: DeadTM Staining The LIVE/DEAD Viability/Cytotoxicity Kit for animal cells is a fluorescence-based method for determining viability of adherent or nonadherent cells and for a- ssaying cytotoxicity. The kit comprises two probes: cal- cein AM and ethidium homodimer-1. Calcein AM is a fluorogenic esterase substrate that is hydrolyzed to a greenfluorescent product (calcein); thus, green fluores- cence is an indicator of cells that have esterase activity as well as an intact membrane to retain the esterase products. Ethidium homodimer-1is a high-affinity, red-fluorescent nucleic acid stain that is only able to pass through the compromised membranes of dead cells. In this study, live/dead staining was applied to show the viable cells distribution with three dimensional ES cells aggregates (EBs) after different incubation time. In general, studied cells were allowed to growing till confluent. After thoroughly washes, live/dead working solution was applied to cover the cells and incubated for 30 - 40 minutes at room temperature. Remove the live/ dead working solution and wash with PBS. Fluorescent staining can be visualized using confocal microscopy (ex/em 495/515 nm Calcein: ex/em 495/635 nm EB). 3. Results 3.1. Maintaining Mouse ES Cells in an Undifferentiated State and Expaneding Cell Numbers Mouse ES cells used in this study were maintained in an undifferentiated state in an attempt to obtain large num- bers of cells before initiating directed differentiation. In order to achieve this goal LIF and mouse embryonic fi- broblast feeder layer cells were used. In order to study the feeder layer cells’ ability to main- tain undifferentiated ES cells, 2 × 10⁵ mouse ES cells were plated on mitotically arrested mouse embryonic fibroblast feeder layer cells in tissue culture T25 flasks with and without LIF present in the culture medium. Cells were incubated at 37˚C with 5% CO2 for 4 days. During 4 days culture, ES cells morphology was ob- served by light microscopy and total cell counts were performed by trypin blue exclusion. Results clearly demonstrated that mouse fibroblast feeder layers offered a good culture environment for ES cells in terms of the attachment and expansion. ES cells could attach to the feeder layer cells and distinct colonies were formed after two days of culture. Proliferation on feeders was robust over the four days of study particu- larly in the presence of LIF. Total cell counts revealed an increase of up to 20 times of the original starting num- bers (Table 1) and morphologically the ES cells formed well defined colonies (Figure 1(a)). By comparison, ES cell in the presence of fibroblasts and without LIF re- vealed a lower expansion of cell numbers. Morphologi- cally, ES cell colonies were seen to be less well defined with colonies often touching and merging into irregular colonies (Figure 1(b)). The fibroblast-free culture of ES cells in the presence of LIF showed a much lower increase in cell numbers compared to culture on feeders and cell attachment to the culture surface was also poor (data not shown). 3.2. Optimizing ES Cells Seeding Density To assess for optimum cell seeding density, feeder layer free culture was established on gelatin-coated tissue cul- ture surface. These cells were transferred onto gelatine coated (0.1%) tissue culture surface and cultured using serum containing medium with LIF present in the me- dium. Cell growth was assessed by microscopy observa- tions and the Alamar blue assay at different time points (on each culture day from day 1 to day10). Four different original plating densities were used in the study; 5 × 10⁴ cells/ml, 105 cells/ml, 2 × 10⁵ cells/ml and 5 × 10⁵ cells/ml. Light microscopy observations showed that ES cells attached to the culture plates and formed defined colo- nies, which at the lower plating densities of 5 × 10⁴ and 105 cells/ml, were small isolated clusters as compared to the higher plating densities of 2 × 10⁵ or 5 × 10⁵ cells/ml, where the cells formed large defined clusters comprising Table 1. ES cell total counts cultured on mouse fibroblast feeder layer +/-LIF in the culture medium. The original cells plating density on each flask was 200,000 cells/ml. Culture conditions Cells original density Cells final density Feeder layer cellsLIF(Cells/ml) (Cells/ml) Y Y 200,000 4,000,000 Y N 200,000 2,950,000 N Y 200,000 800,000 C opyright © 2011 SciRes. JBNB  Assessment of Biological Properties of Mouse Embryonic Stem Cells Characteristics Prior to Differentiation Copyright © 2011 SciRes. JBNB 381 (a) (b) Figure 1. (a) Morphological appearance of mouse embryonic stem cells maintained on mouse fibroblast feeder layers plus LIF (Magnification × 10); (b) Mouse embryonic stem cells maintained on mouse fibroblast feeder layers in the absence of LIF (Magnificat i o n × 10). 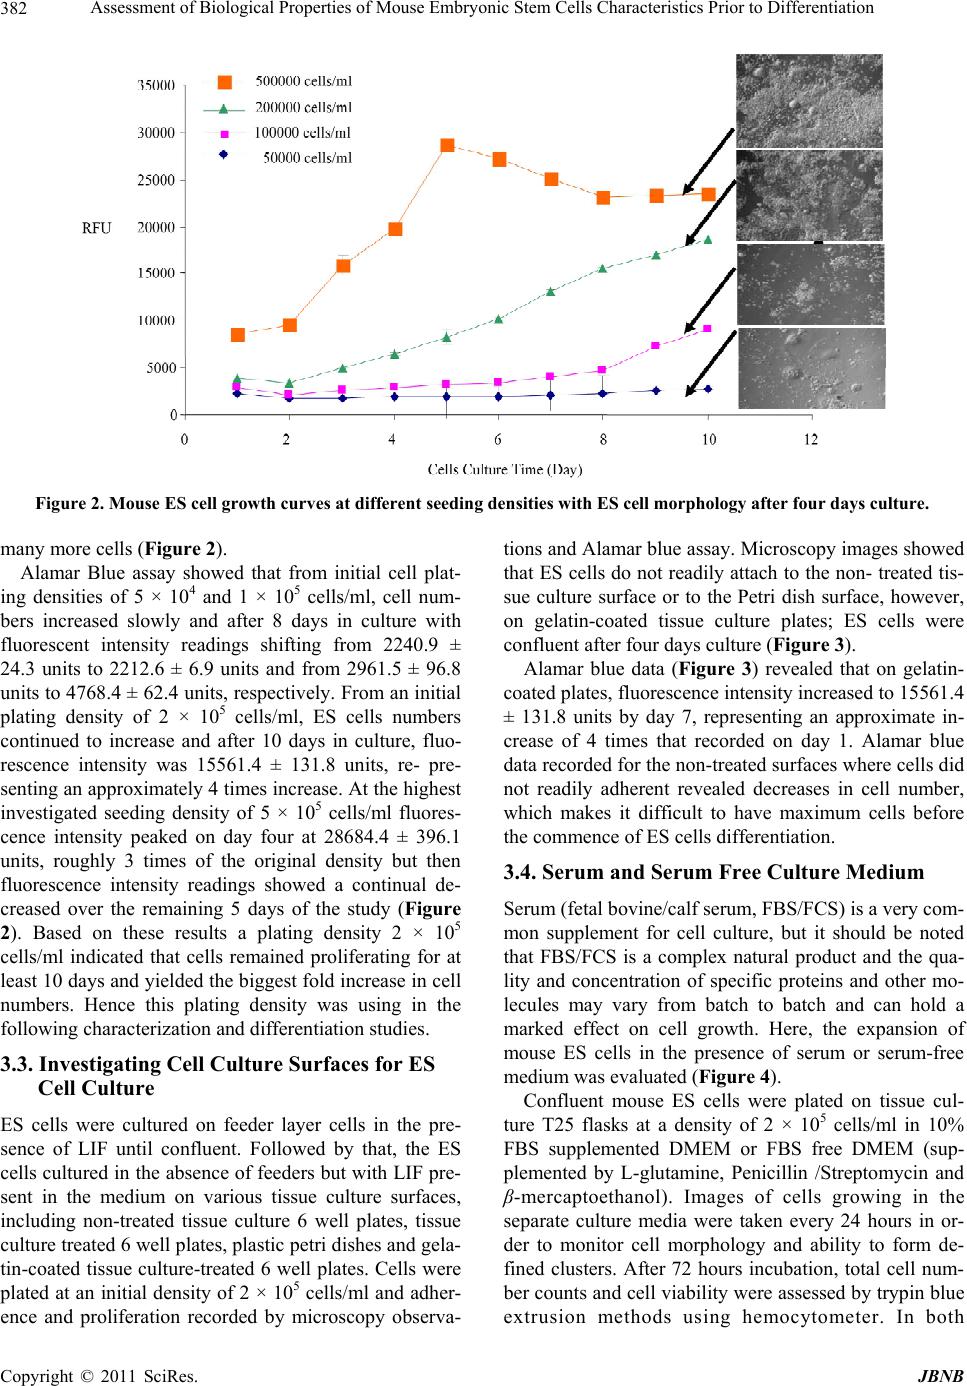 Assessment of Biological Properties of Mouse Embryonic Stem Cells Characteristics Prior to Differentiation 382 Figure 2. Mouse ES cell growth curves at different seeding densities with ES cell morphology after four days culture. many more cells (Figure 2). Alamar Blue assay showed that from initial cell plat- ing densities of 5 × 10⁴ and 1 × 10⁵ cells/ml, cell num- bers increased slowly and after 8 days in culture with fluorescent intensity readings shifting from 2240.9 ± 24.3 units to 2212.6 ± 6.9 units and from 2961.5 ± 96.8 units to 4768.4 ± 62.4 units, respectively. From an initial plating density of 2 × 10⁵ cells/ml, ES cells numbers continued to increase and after 10 days in culture, fluo- rescence intensity was 15561.4 ± 131.8 units, re- pre- senting an approximately 4 times increase. At the highest investigated seeding density of 5 × 10⁵ cells/ml fluores- cence intensity peaked on day four at 28684.4 ± 396.1 units, roughly 3 times of the original density but then fluorescence intensity readings showed a continual de- creased over the remaining 5 days of the study (Figure 2). Based on these results a plating density 2 × 10⁵ cells/ml indicated that cells remained proliferating for at least 10 days and yielded the biggest fold increase in cell numbers. Hence this plating density was using in the following characterization and differentiation studies. 3.3. Investigating Cell Culture Surfaces for ES Cell Culture ES cells were cultured on feeder layer cells in the pre- sence of LIF until confluent. Followed by that, the ES cells cultured in the absence of feeders but with LIF pre- sent in the medium on various tissue culture surfaces, including non-treated tissue culture 6 well plates, tissue culture treated 6 well plates, plastic petri dishes and gela- tin-coated tissue culture-treated 6 well plates. Cells were plated at an initial density of 2 × 10⁵ cells/ml and adher- ence and proliferation recorded by microscopy observa- tions and Alamar blue assay. Microscopy images showed that ES cells do not readily attach to the non- treated tis- sue culture surface or to the Petri dish surface, however, on gelatin-coated tissue culture plates; ES cells were confluent after four days culture (Figure 3). Alamar blue data (Figure 3) revealed that on gelatin- coated plates, fluorescence intensity increased to 15561.4 ± 131.8 units by day 7, representing an approximate in- crease of 4 times that recorded on day 1. Alamar blue data recorded for the non-treated surfaces where cells did not readily adherent revealed decreases in cell number, which makes it difficult to have maximum cells before the commence of ES cells differentiation. 3.4. Serum and Serum Free Culture Medium Serum (fetal bovine/calf serum, FBS/FCS) is a very com- mon supplement for cell culture, but it should be noted that FBS/FCS is a complex natural product and the qua- lity and concentration of specific proteins and other mo- lecules may vary from batch to batch and can hold a marked effect on cell growth. Here, the expansion of mouse ES cells in the presence of serum or serum-free medium was evaluated (Figure 4). Confluent mouse ES cells were plated on tissue cul- ture T25 flasks at a density of 2 × 10⁵ cells/ml in 10% FBS supplemented DMEM or FBS free DMEM (sup- plemented by L-glutamine, Penicillin /Streptomycin and β-mercaptoethanol). Images of cells growing in the separate culture media were taken every 24 hours in or- der to monitor cell morphology and ability to form de- fined clusters. After 72 hours incubation, total cell num- ber counts and cell viability were assessed by trypin blue extrusion methods using hemocytometer. In both C opyright © 2011 SciRes. JBNB 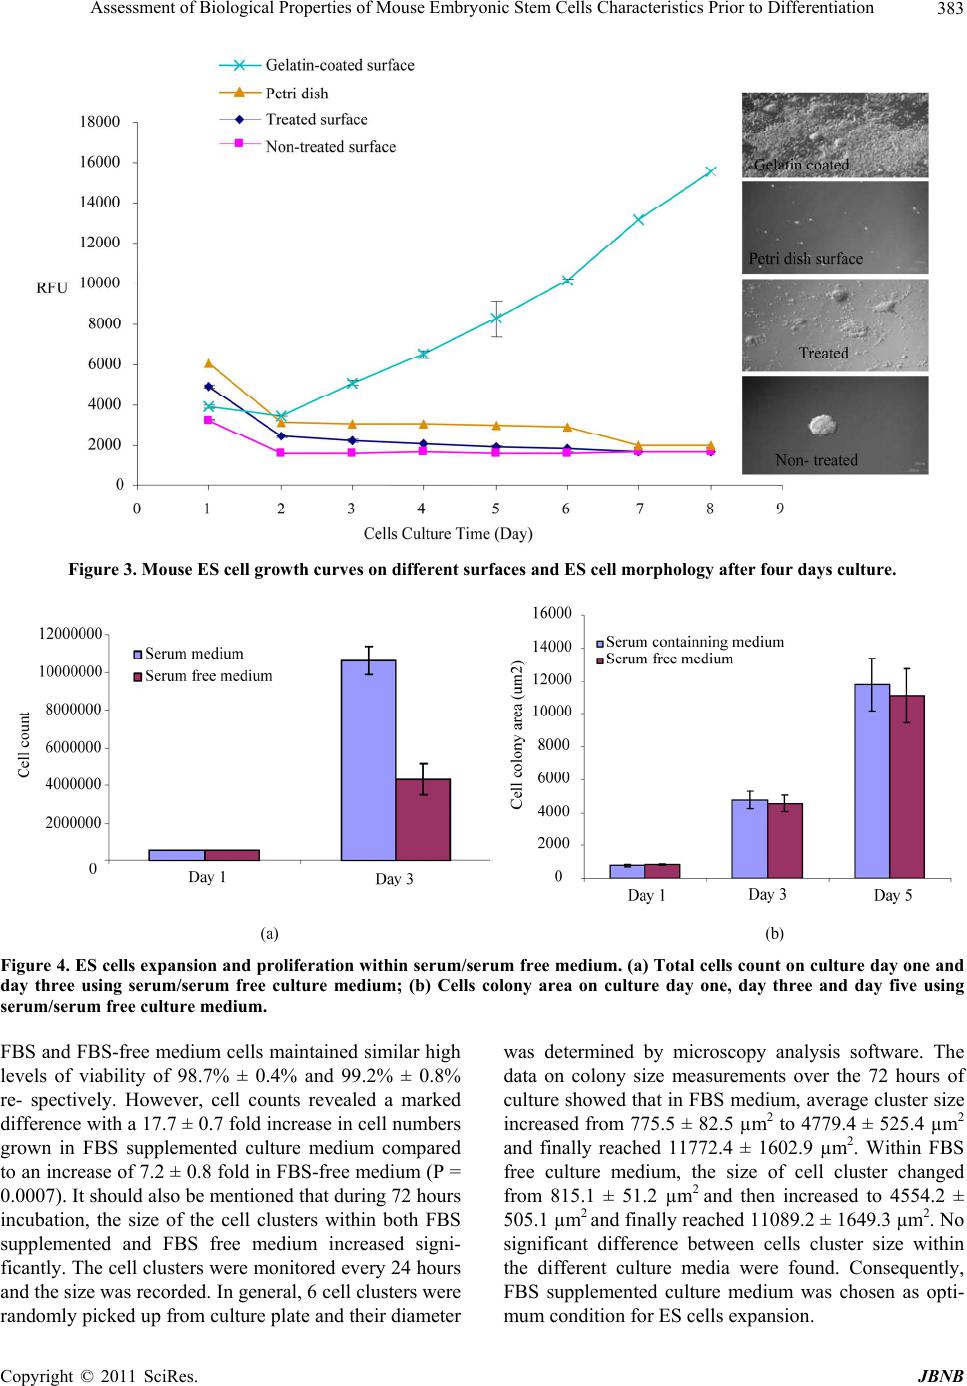 Assessment of Biological Properties of Mouse Embryonic Stem Cells Characteristics Prior to Differentiation383 Figure 3. Mouse ES cell growth curves on different surfaces and ES cell morphology after four days culture. Figure 4. ES cells expansion and proliferation wi thin serum/serum free medium. (a) Total cells count on culture day one and day three using serum/serum free culture medium; (b) Cells colony area on culture day one, day three and day five using serum/serum free culture medium. FBS and FBS-free medium cells maintained similar high levels of viability of 98.7% ± 0.4% and 99.2% ± 0.8% re- spectively. However, cell counts revealed a marked difference with a 17.7 ± 0.7 fold increase in cell numbers grown in FBS supplemented culture medium compared to an increase of 7.2 ± 0.8 fold in FBS-free medium (P = 0.0007). It should also be mentioned that during 72 hours incubation, the size of the cell clusters within both FBS supplemented and FBS free medium increased signi- ficantly. The cell clusters were monitored every 24 hours and the size was recorded. In general, 6 cell clusters were randomly picked up from culture plate and their diameter was determined by microscopy analysis software. The data on colony size measurements over the 72 hours of culture showed that in FBS medium, average cluster size increased from 775.5 ± 82.5 µm2 to 4779.4 ± 525.4 µm2 and finally reached 11772.4 ± 1602.9 µm2. Within FBS free culture medium, the size of cell cluster changed from 815.1 ± 51.2 µm2 and then increased to 4554.2 ± 505.1 µm2 and finally reached 11089.2 ± 1649.3 µm2. No significant difference between cells cluster size within the different culture media were found. Consequently, FBS supplemented culture medium was chosen as opti- mum condition for ES cells expansion. Copyright © 2011 SciRes. JBNB 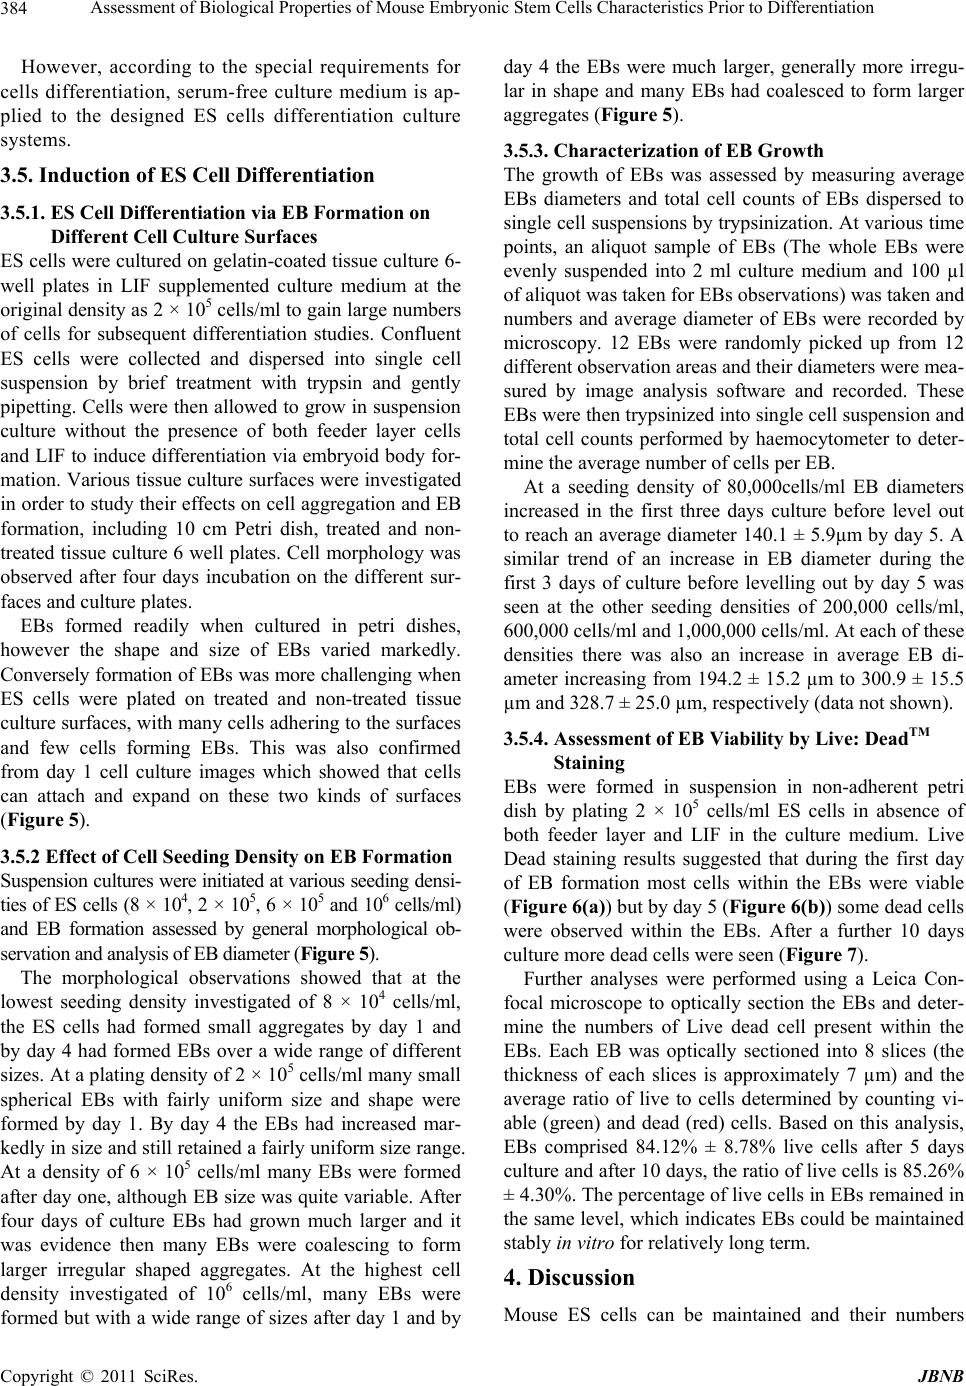 Assessment of Biological Properties of Mouse Embryonic Stem Cells Characteristics Prior to Differentiation 384 However, according to the special requirements for cells differentiation, serum-free culture medium is ap- plied to the designed ES cells differentiation culture systems. 3.5. Induction of ES Cell Differentiation 3.5.1. ES Cell Differentiation via EB Formation on Different Cell Culture Surfaces ES cells were cultured on gelatin-coated tissue culture 6- well plates in LIF supplemented culture medium at the original density as 2 × 10⁵ cells/ml to gain large numbers of cells for subsequent differentiation studies. Confluent ES cells were collected and dispersed into single cell suspension by brief treatment with trypsin and gently pipetting. Cells were then allowed to grow in suspension culture without the presence of both feeder layer cells and LIF to induce differentiation via embryoid body for- mation. Various tissue culture surfaces were investigated in order to study their effects on cell aggregation and EB formation, including 10 cm Petri dish, treated and non- treated tissue culture 6 well plates. Cell morphology was observed after four days incubation on the different sur- faces and culture plates. EBs formed readily when cultured in petri dishes, however the shape and size of EBs varied markedly. Conversely formation of EBs was more challenging when ES cells were plated on treated and non-treated tissue culture surfaces, with many cells adhering to the surfaces and few cells forming EBs. This was also confirmed from day 1 cell culture images which showed that cells can attach and expand on these two kinds of surfaces (Figure 5). 3.5.2 Effect of Cell Seeding Density on EB Formation Suspension cultures were initiated at various seeding densi- ties of ES cells (8 × 10⁴, 2 × 10⁵, 6 × 10⁵ and 106 cells/ml) and EB formation assessed by general morphological ob- servation and analysis of EB diameter (Figure 5 ). The morphological observations showed that at the lowest seeding density investigated of 8 × 10⁴ cells/ml, the ES cells had formed small aggregates by day 1 and by day 4 had formed EBs over a wide range of different sizes. At a plating density of 2 × 10⁵ cells/ml many small spherical EBs with fairly uniform size and shape were formed by day 1. By day 4 the EBs had increased mar- kedly in size and still retained a fairly uniform size range. At a density of 6 × 10⁵ cells/ml many EBs were formed after day one, although EB size was quite variable. After four days of culture EBs had grown much larger and it was evidence then many EBs were coalescing to form larger irregular shaped aggregates. At the highest cell density investigated of 106 cells/ml, many EBs were formed but with a wide range of sizes after day 1 and by day 4 the EBs were much larger, generally more irregu- lar in shape and many EBs had coalesced to form larger aggregates (Figure 5). 3.5.3. Char acterization of EB Growt h The growth of EBs was assessed by measuring average EBs diameters and total cell counts of EBs dispersed to single cell suspensions by trypsinization. At various time points, an aliquot sample of EBs (The whole EBs were evenly suspended into 2 ml culture medium and 100 µl of aliquot was taken for EBs observations) was taken and numbers and average diameter of EBs were recorded by microscopy. 12 EBs were randomly picked up from 12 different observation areas and their diameters were mea- sured by image analysis software and recorded. These EBs were then trypsinized into single cell suspension and total cell counts performed by haemocytometer to deter- mine the average number of cells per EB. At a seeding density of 80,000cells/ml EB diameters increased in the first three days culture before level out to reach an average diameter 140.1 ± 5.9µm by day 5. A similar trend of an increase in EB diameter during the first 3 days of culture before levelling out by day 5 was seen at the other seeding densities of 200,000 cells/ml, 600,000 cells/ml and 1,000,000 cells/ml. At each of these densities there was also an increase in average EB di- ameter increasing from 194.2 ± 15.2 µm to 300.9 ± 15.5 µm and 328.7 ± 25.0 µm, respectively (data not shown). 3.5.4. Assessment of EB Viability by Live: DeadTM Staining EBs were formed in suspension in non-adherent petri dish by plating 2 × 10⁵ cells/ml ES cells in absence of both feeder layer and LIF in the culture medium. Live Dead staining results suggested that during the first day of EB formation most cells within the EBs were viable (Figure 6(a)) but by day 5 (Figure 6(b)) some dead cells were observed within the EBs. After a further 10 days culture more dead cells were seen (Figure 7). Further analyses were performed using a Leica Con- focal microscope to optically section the EBs and deter- mine the numbers of Live dead cell present within the EBs. Each EB was optically sectioned into 8 slices (the thickness of each slices is approximately 7 µm) and the average ratio of live to cells determined by counting vi- able (green) and dead (red) cells. Based on this analysis, EBs comprised 84.12% ± 8.78% live cells after 5 days culture and after 10 days, the ratio of live cells is 85.26% ± 4.30%. The percentage of live cells in EBs remained in the same level, which indicates EBs could be maintained stably in vitro for relatively long term. 4. Discussion Mouse ES cells can be maintained and their numbers C opyright © 2011 SciRes. JBNB 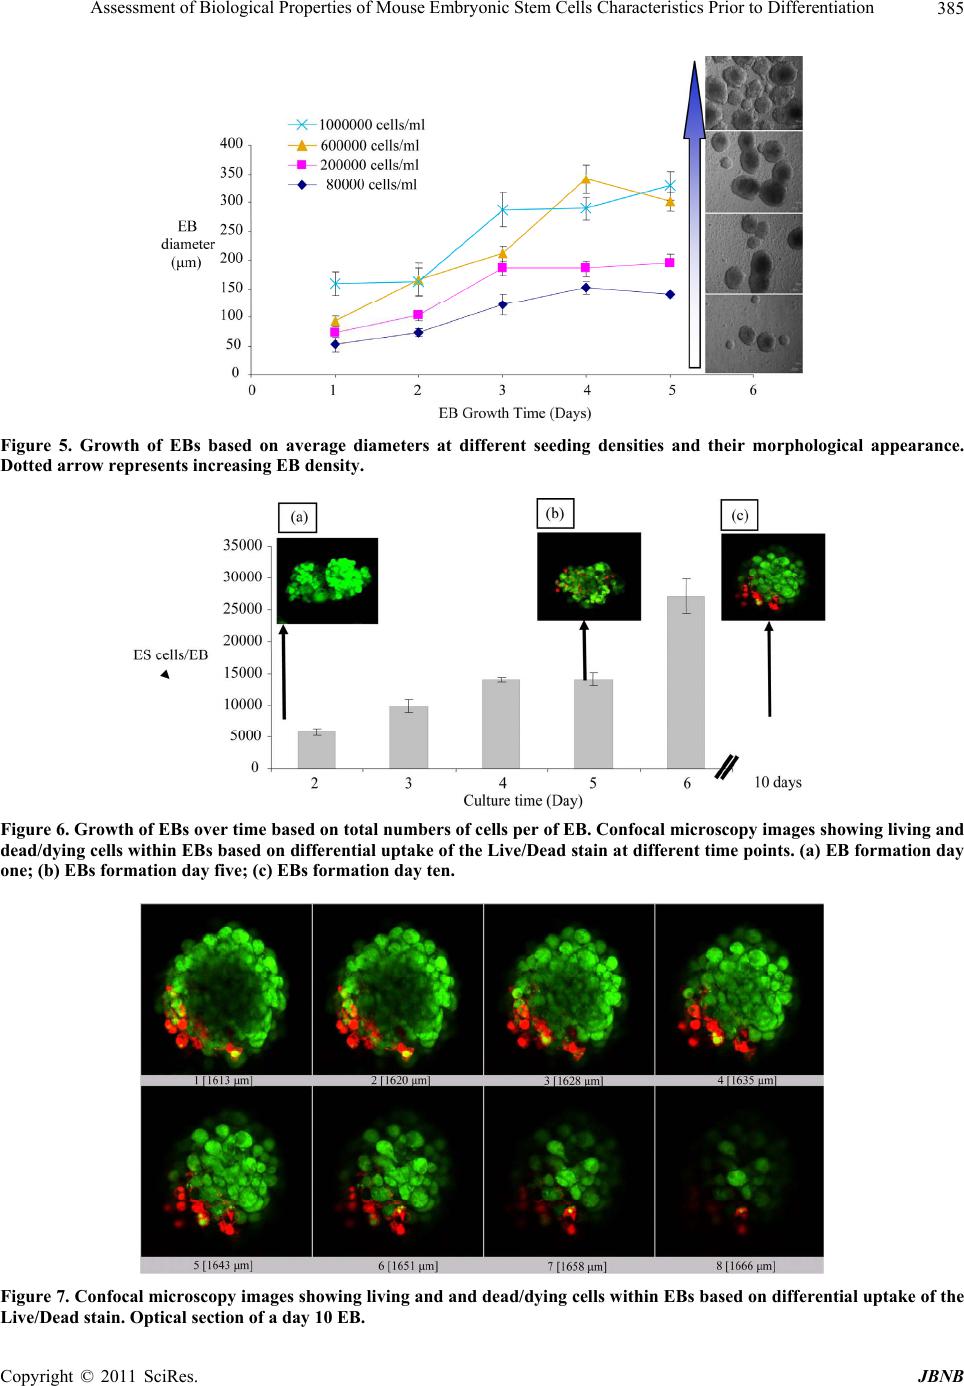 Assessment of Biological Properties of Mouse Embryonic Stem Cells Characteristics Prior to Differentiation Copyright © 2011 SciRes. JBNB 385 Figure 5. Growth of EBs based on average diameters at different seeding densities and their morphological appearance. Dotted arrow represents increasing EB density. Figure 6. Growth of EBs over time based on total numbers of cells per of EB. Confocal microscopy images showing living and dead/dying cells within EBs based on differential uptake of the Live/Dead stain at different time points. (a) EB formation day one; (b) EBs formation day five; (c) EBs formation day ten. Figure 7. Confocal microscopy images showing living and and dead/dying cells within EBs based on differential uptake of the Live/Dead stain. Optical section of a day 10 EB.  Assessment of Biological Properties of Mouse Embryonic Stem Cells Characteristics Prior to Differentiation 386 expanded by culture on feeder layer cells with LIF pre- sent in the culture medium. This study also showed that changes in seeding density can significantly influence cell number expansion rates. Culturing ES cells in the absence of feeder layer cells and LIF stimulates EB for- mation when cultured in non-adherent culture plates such as Petri dishes. Formation of EBs particularly numbers, size of EBs formed, rates of cell proliferation within EBs and viability of cells can be controlled based on seeding density. All these factors are important for optimizing approaches to co-ordinate differentiation towards a spe- cific cell type. Stem cells can be defined as cells that must choose to transit through alternative “gates” of self-renewal and differentiation at each division [10]. It has been proven that when effectively maintained under particular culture conditions to prevent their differentiation, these cells can self-renew continuously for a long period of time [10]. It is particular important to maintain self-renewal capacity by culturing ES cells on layers of mitotically-arrested embryonic fibroblast cells and inclusion of the cytokine LIF in the culture medium. In this study, to gain maxi- mum amount of cells, ES cells were cultivated on gela- tine-coated tissue culture flasks with LIF present in the culture medium. Results indicated that cells could ex- pand on the surface and formed well defined clusters by applying optimized original seeding density. LIF exerts its effects by binding to a two-part receptor com- plex that consists of the LIF receptor and the gp130 receptor. The binding of LIF triggers the activation of the latent transcription factor STAT3, a necessary event in vitro for the continued proliferation of mouse ES cells [11]. It was also reported that two transcription factors, STAT3 and Oct-4, may interact and affect the function of a common set of target genes [12]. If ES cells are to be used effectively in the clinic to treat, for example, regenerative diseases affecting tissues like the pancreas, an important step is to be able to con- sistently supply a large number of pluripotent cells that can be then guided towards the desired differentiated cell type, such as pancreatic islet cells. The purpose of this study was to investigate the basic fundamental effects of cell seeding densities, culture conditions on ES cell growth and initial differentiation via EB formation with the aim of optimizing conditions from which to investi- gate differentiation of ES cells into pancreatic islet cells capable of synthesizing and secreting insulin in response to specific stimuli. Investigation of several seeding den- sities and analysis of growth by Alamar blue assay over several days suggested that a seeding density of 2 × 10⁵ cells/ml produced the growth curves consistent with rapid and sustained proliferation. At lower seeding den- sities, cells grew much more slowly, whereas at higher densities while cells initially grew rapidly within 4 - 5 days they apparently stopped growing and cell numbers actually declined. The changing of cells seeding density also produced changes in morphology of the ES cell colonies and particularly at higher seeding densities with the well defined colonies that characterize ES cell growth quickly merging into and overgrowing each other and is known to stimulate differentiation. Serum, usually from fetal calves, is an extremely complex mixture of many small and large bio-molecules with different, physiologically balanced growth pro- moting and growing inhibiting activities. A concentration 5% - 20% v/v serum is usually needed for optimum cell growth. Due to the endocrinal differentiation require- ments, the induction of insulin-producing cells from mouse ES cells was carried out in serum-free conditions in the later sections. In the context of developing culture conditions to promote application of stem cells in the clinic, use of FCS is a significant issue as it may contain potentially harmful xenogeneic compounds. Bovine se- rum proteins may be internalized in stem cells stimu- lating immunogenicity [13,14], consequently a host of potential problems can arise including viral trans- mis- sion and immunological reactions due to the bovine pro- tein attachment to cells in culture that act as antigenic substrates once transplanted [15]. Another key goal was to evaluate serum-supplement and serum-free culture medium and optimize the culture medium for ES cells’ expansion. The data from these studies demonstrated that the mouse ES cells can be ex- panded in both serum-supplemented and serum-free cul- ture medium. The cells remained viable over several days of culture and formed characteristic well defined colonies. Not surprisingly, the rate of expansion of cell numbers was significantly lower compared to cells cul- tured in FCS-containing medium although culture in se- rum-free conditions still produced numbers of cells for subsequent differentiation experiments and may have had the added advantage that the factors to which the cells had been exposed could be defined. Formation of EBs has been shown to be an important step in the process of ES cell in vitro differentiation. Induction of EB formation in the suspension culture has been applied to initiate the differentiation of ES cells into a variety of differentiated cell types. For mouse ES cells, neural progenitors [16], vascular cells [17,18], cardio- myocytes [19], chondrocytes [20], hepatic cells [21], insulin-producing cells [22,23] and germ cells [24] are induced from EBs formation in suspension culture. For human ES cells, neural cells [5], hematopoietic cells [5], cardiomyocytes [25], insulin-producing cells [26], and endothelial cells [27] are induced from EBs and as dis- cussed above in the culture of ES cells induction of EB C opyright © 2011 SciRes. JBNB  Assessment of Biological Properties of Mouse Embryonic Stem Cells Characteristics Prior to Differentiation387 formation can be variable and can have marked effects on the subsequent differentiation. Suspension culture is the most basic method that is used for EB formation from both mouse and human ES cells and while there is a certain amount of variability associated with this ap- proach it generally produces the highest yields of differ- entiating cells. Although this method can be used to get large amount of EBs, it can only offer limited control over the size of EBs. To improve the homogeneity of EBs formed in suspension culture, rotating suspension culture was introduced [28]. The use of this rotation cul- ture system improved oxygen supply and enabled high density culture. In this study, approaches to optimize EB formation in simple suspension culture have been inves- tigated focussing on investigating fundamental bio- physical stimuli such as seeding densities, and adhesion to cell culture plates. Methylcellulose culture was originally employed to form cell aggregates of a cloned origin [29]. When ES cells are plated in semi-solid methylcellulose media, they tend to remain as single cells and these single cells can develop into cells aggregations (EBs). Therefore, me- thylcellulose culture allows reproducible formation of EBs from single ES cells and it has been used to induce haematopoietic differentiation [30] and endothelial cells differentiation [31]. Hanging drop method provides good control over EBs size and shape since the number of ES cells aggregated in a hanging drop can be controlled by varying the num- ber of cells in the initial cells suspension. The hanging drop method, in which cells are dispersed in 15 - 20 μl drops suspended from the lid of a Petri dish, has been used to more precisely control the microenvironment for EB formation. This method is normally used to get fairly homogeneous EBs since individual EBs are not able to agglomerate each physically separated drops. It has been reported that hanging drop method can be used to gener- ate broad range of cell types including neuronal cells [32], lymphoid [33], cardiomyocytes [34], smooth mus- cle cells [35], chondrocytes [36], renal cells [37], adipo- cytes [38], hepatocytes [39], insulin-producing cells [40], and gametes [41]. However it is not ideal for large scale applications since the liquid volume of a drop is limited due to maintaining hanging drops on the lid by surface tension. Medium exchange for a drop is not practically possible and it is difficult for a direct microscopic ob- servation during cultivation. In this study suspension culture was used to form EBs since there is no special requirement for the size distribu- tion of EBs and this method holds the benefit of practi- cally easy operation in the cells culture process. At this experiment stage, there is no need to produce large amount of EBs, hence large scale EBs culture system was not introduced, such as rotary suspension culture system. Results also indicated that EBs are formed only on non/low-adherent surface in the suspension culture. Moreover, EBs should be induced only after one day in the suspension culture with all the explored original plating densities. It has been demonstrated [6] that indi- vidual mouse ES cells could form EBs with high effi- ciency (at least 42%). This finding implied the use of methylcellulose differentiation cultures that induce single cell colony formation. Along with the increase of ES cells original plating density, EBs size increase within same incubation time as well. However, after 5 days in- cubation, the size of EBs started from 1 × 10⁶cells/ml is in the same level with the culture from 6 × 10⁵ cells/ml. Cell culture images and EBs size growth indicate that EBs agglomerations between two or more EBs appeared during the incubation process. In this culture system, the control of EBs’ aggregation and agglomeration is very important since the centre of very large aggregates may experience cell death due to limitations in nutrients and oxygen delivery [42]. However in this study, we de- monstrated that with optimized culture conditions, with plating cell density of 2 × 10⁵cells/ml on non-adherent Petri dish, ES cells’ viability can be maintained at high level for at least 10 days. A two-step mechanism for mouse EB agglomeration has been reported [43]. First, cell-cell adhesion molecule E-cadherin was determined to mediate attachment between neighbouring EBs. Fo- llowing attachment, cells actively migrated and re- mod- elled, assimilating cells into a single spheroid. Based on this finding, it has also been demonstrated that EB ag- glomeration can be controlled by ES cells mass encapsu- lation [44]. 5. Conclusions An optimized cell culture condition has been determined which can maintain ES cells in an undifferentiated stage and holding high self renew ability. After large amounts of ES cells were achieved, EBs were formed in suspen- sion culture and the size and agglomeration of EBs can be controlled by optimizing starting ES cells densities. ES cells viability remained at a high level within EBs structures during in vitro incubation. High standard ES cells culture can strongly secure the reproducible ES cells based differentiation strategy. Considerable research is now carried out on human stem cells, but the use of animal stem cells still plays a crucial role in characterising biological structure and function. REFERENCES [1] A. G. Smith, “Embryo-Derived Stem Cells: Of Mice and Copyright © 2011 SciRes. JBNB  Assessment of Biological Properties of Mouse Embryonic Stem Cells Characteristics Prior to Differentiation 388 Men,” Annual Review of Cell and Developmental Biology, Vol. 17, 2001, pp. 435-462. doi:10.1146/annurev.cellbio.17.1.435 [2] P. W Andrews, et al., “Pluripotent Embryonal Carcinoma Clones Derived from the Human Teratocarcinoma Cell Line Tera-2,” Differentiation in Vivo and in Vitro. Labo- ratory Investigation, Vol. 50, No. 2, 1984, pp. 147-162. [3] G. Hopfl, M. Gassmann, and I. Desbaillets, “Differenti- ating Embryonic Stem Cells into Embryoid Bodies,” Methods in Molecular Biology, Vol. 254, 2004, pp. 79- 98. [4] T. C. Doetschman, et al., “The in Vitro Development of Blastocyst-Derived Embryonic Stem Cell lines: Forma- tion of Visceral Yolk Sac, Blood Islands and Myocar- dium,” Journal of Embryology & Experimental Morpho- logy, Vol. 87, 1985, pp. 27-45. [5] J. Itskovitz-Eldor, et al., Differentiation of human em- bryonic stem cells into embryoid bodies compromising the three embryonic germ layers. Molecular Medicine Vol. 6, No. 2, 2000, pp. 88-95. [6] S. M .Dang, et al., “Efficiency of Embryoid Body For- mation and Hematopoietic Development from Embryonic Stem Cells in Different Culture Systems,” Biotechnology and Bioengineering, Vol. 78, No. 4, 2002, pp. 442-453. doi:10.1002/bit.10220 [7] C. M. Cameron, W. S. Hu and D. S. Kaufman, “Improved Development of Human Embryonic Stem Cell-Derived Embryoid Bodies by Stirred Vessel Cultivation,” Bio- technology and Bioengineering, Vol. 94, No. 5, 2006, pp. 938-948. doi:10.1002/bit.20919 [8] S. M. Dang, and P. W. Zandstra, “Scalable Production of Embryonic Stem Cell-Derived Cells,” Methods in Mo- lecular Biology, Vol. 290, No. 1, 2005, pp. 353-364. [9] S. Gerecht-Nir, S. Cohen and J. Itskovitz-Eldor, “Bio- reactor Cultivation Enhances the Efficiency of Human Embryoid Body (HEB) Formation and Differentiation,” Biotechnology and Bioengineering, Vol. 86, No. 5, 2004, pp. 493-502. doi:10.1002/bit.20045 [10] Y. Suda, et al., “Mouse Embryonic Stem Cells Exhibit Indefinite Proliferative Potential,” Journal of Cellular Physiology, Vol. 133, No. 1, 1987, pp. 197-201. doi:10.1002/jcp.1041330127 [11] T. Burdon, et al., “Signaling Mechanisms Regulating Selfrenewal and Differentiation of Pluripotent Embryonic Stem Cells,” Cells Tissues Organs, Vol. 165, No. 3-4, 1999, pp. 131-143. [12] H. Niwa, J. Miyazaki, and A. G. Smith, “Quantitative Expression of Oct-3/4 Defines Differentiation, Dediffe- rentiation or Self-Renewal of ES Cells,” Nature Genetics, Vol. 24, No. 4, 2000, pp. 372-376. doi:10.1038/74199 [13] M. J Martin, et al., “Human Embryonic Stem Cells Ex- press an Immunogenic Nonhuman Sialic Acid,” Nature Medicine, Vol. 11, No. 2, 2005, pp. 228-232. [14] J. L. Spees, et al., “Internalized Antigens Must Be Re- moved to Prepare Hypoimmunogenic Mesenchymal Stem Cells for Cell and Gene Therapy,” Molecular Therapy, Vol. 9, No. 5, 2004, pp. 747-756. doi:10.1016/j.ymthe.2004.02.012 [15] A. Heiskanen, et al., “N-Glycolylneuraminic Acid Xe- noantigen Contamination of Human Embryonic and Mesenchymal Stem Cells is Substantially Reversible,” Stem Cells, Vol. 25, No. 1, 2007, pp. 197-202. doi:10.1634/stemcells.2006-0444 [16] N. Plachta, et al., “Developmental Potential of Defined Neural Progenitors Derived from Mouse Embryonic Stem Cells,” Development, Vol. 131, No. 21, 2004, pp. 5449- 5456. doi:10.1242/dev.01420 [17] W. Risau, et al., “Vasculogenesis and Angiogenesis in Embryonic-Stem-Cell-Derived Embryoid Bodies,” De- velopment, Vol. 102, No. 3, 1988, pp. 471-478. [18] O. Feraud, Y. Cao and D. Vittet, “Embryonic Stem Cell- Derived Embryoid Bodies Development in Collagen Gels Recapitulates Sprouting Angiogenesis,” Laboratory In- vestigation, Vol. 81, No. 12, 2001, pp. 1669-1681. [19] M. G. Klug, et al., “Genetically Selected Cardiomyocytes from Differentiating Embronic Stem Cells form Stable Intracardiac Grafts,” Journal of Clinical Investigation, Vol. 98, No. 1, 1996, pp. 216-224. doi:10.1172/JCI118769 [20] N. S. Hwang, et al., “Enhanced Chondrogenic Differen- tiation of Murine Embryonic Stem Cells in Hydrogels with Glucosamine,” Biomaterials, Vol. 27, No. 36, 2006, pp. 6015-6023. doi:10.1016/j.biomaterials.2006.06.033 [21] E. A. Jones, et al., “Hepatic Differentiation of Murine Embryonic Stem Cells,” Experimental Cell Research, Vol. 272, No. 1, 2002, pp. 15-22. doi:10.1006/excr.2001.5396 [22] Y. Moritoh, et al., “Analysis of Insulin-Producing Cells during in Vitro Differentiation from Feeder-Free Em- bryonic Stem Cells,” Diabetes, Vol. 52, No. 5, 2004, pp. 1163-1168. doi:10.2337/diabetes.52.5.1163 [23] N. Lumelsky, et al., “Differentiation of Embryonic Stem Cells to Insulin-Secreting Structures Similar to Pancreatic Islets,” Science, Vol. 292, No. 5520, 2001, pp. 1389- 1394. doi:10.1126/science.1058866 [24] Y. Toyooka, et al., “Embryonic Stem Cells can Form Germ Cells in Vitro,” Proceedings of the National Aca- demy of Sciences, USA, Vol. 100, No. 20, 2003, pp. 11457-11462. doi:10.1073/pnas.1932826100 [25] I. Kehat, et al., “Human Embryonic Stem Cells can Dif- ferentiate into Myocytes with Structural and Functional Properties of Cardiomyocytes,” Journal of Clinical In- vestigation, Vol. 108, No. 3, 2001, pp. 407- 414. [26] S. Assady, et al., “Insulin Production by Human Em- bryonic Stem Cells,” Diabetes, Vol. 50, No. 8, 2001, pp. 1691-1697. doi:10.2337/diabetes.50.8.1691 [27] S. Levenberg, et al., “Endothelial Cells Derived from Human Embryonic Stem Cells,” Proceedings of the Na- tional Academy of Sciences, U S A, Vol. 99, No. 7, 2002, pp. 4391-4396. doi:10.1073/pnas.032074999 [28] R. Zweigerdt, et al., “Generation of Confluent Cardio- myocyte Monolayers Derived from Embryonic Stem Cells in Suspension: A Cell source for New Therapies C opyright © 2011 SciRes. JBNB  Assessment of Biological Properties of Mouse Embryonic Stem Cells Characteristics Prior to Differentiation Copyright © 2011 SciRes. JBNB 389 and Screening Strategies,” Cytotherapy, Vol. 5, No. 5, 2003, pp. 399-413. doi:10.1080/14653240310003062 [29] M. A. Rundnick and M. W. Mcburney, “Cell Culture Methods and Induction of Differentiation of Embryonal Carcinoma Cell lines,” Teratocarcinomas and Embryonic Stem Cells: A Practical Approach, IRL Press, Washing- ton, D.C., 1987, pp. 19-49. [30] A. Goedecke, M. Wobus, M. Krech, N. Münch, K. Rich- ter, K. Hölig and M. Bornhauser, “Differential Effect of Platelet-Rich Plasma and Fetal Calf Serum on Bone Marrow-Derived Human Mesenchymal Stromal Cells eExpanded in Vitro,” Journal of Tissue Engineering and Regenerative Medicine, Vol. 5, No. 8, 2011, p. 648. [31] T. M. Maul, D. W. Chew, A. Nieponice and D. A. Vorp, “Mechanical Stimuli Differentially Control Stem Cell Behavior: Morphology, Proliferation, and Differentia- tion,” Biomechanics and Modeling in Mechanobiology, Vol. 10, No. 1, 2011, pp. 145-160. [32] Z. He, et al., “Effect of Leukemia Inhibitory Factor on Embryonic Stem Cell Differentiation: Implications for Supporting Neuronal Differentiation,” Acta Pharma- cologica Sinica, Vol. 27, No. 1, 2006, pp. 80-90. doi:10.1111/j.1745-7254.2006.00254.x [33] A. J. Potocnik, H. Kohler and K. Eichmann, “Hemato- lymphoid in Vivo Reconstitution Potential of Sub-popu- lations Derived from in Vitro Differentiated Embryonic Stem Cells,” Proceedings of the National Academy of Sciences of the USA, Vol. 94, No. 19, 1997. pp. 10295- 10300. doi:10.1073/pnas.94.19.10295 [34] J. M Metzger, W. I. Lin and L. C. Samuelson, “Transition in Cardiac Contractile Sensitivity to Calcium during the in Vitro Differentiation of Mouse Embryonic Stem Cells,” Journal of Cell Biology, Vol. 126, No. 3, 1994, pp. 701-711. doi:10.1083/jcb.126.3.701 [35] T. Yamada, et al., “In Vitro Functional Gut-Like Organ Formation from Mouse Embryonic Stem Cells,” Stem Cells, Vol. 20, No. 1, 2002, pp. 41-49. doi:10.1634/stemcells.20-1-41 [36] C. Hegert, et al., “Differentiation Plasticity of Chon-m drocytes Derived from Mouse Embryonic Stem Cells,” Journal of Cell Science, Vol. 115, No. 23, 2002, pp. 4617-4628. doi:10.1242/jcs.00171 [37] J. Kramer, et al., “Cells Differentiated from Mouse Em- bryonic Stem Cells via EmbryoidBodies Express Renal Marker Molecules,” Differentiation, Vol. 74, No. 2-3, 2006, pp. 91- 104. [38] C. Dani, et al., “Differentiation of Embryonic Stem Cells into Adipocytes in Vitro,” Journal of Cell Science, Vol. 110, No. 11, 1997, pp. 1279-1285. [39] T. Yamada, et al., “In Vitro Differentiation of Embryonic Stem Cells into Hepatocyte-Like Cells Identified by Cel- lular Uptake of Indocyanine Green,” Stem Cells, Vol. 20, No. 2, 2002, pp. 146-154. doi:10.1634/stemcells.20-2-146 [40] A. Shiroi, et al., “Identification of Insulin-Producing Cells Derived from Embryonic Stem Cells by Zinc-Che- lating Dithizone,” Stem Cells, Vol. 20, No. 4, 2002, pp. 284-292. doi:10.1634/stemcells.20-4-284 [41] N. Geijsen, et al., “Derivation of Embryonic Germ Cells and Male Gametes from Embryonic Stem Cells,” Nature, Vol. 427, No. 6970, 2004, pp. 148-154. doi:10.1038/nature02247 [42] E. Y. Fok and P. W. Zandstra, “Shear-Controlled Single- Step Mouse Embryonic Stem Cell Expansion and Em- bryoid Body-Based Differentiation,” Stem Cells, Vol. 23, No. 9, 2005. pp. 1333-1342. doi:10.1634/stemcells.2005-0112 [43] K. Sasaki, I. H. S. Takei, H. S. No, D. Tomotsune, Y. Kano, T. Yokoyama, S. Sirasawa, A. Mogi, S. Yoshie, S. Sasaki, S. Yamada, K. Matsumoto, M. Mizuguchi, F. Yue and Y. Tanaka, “Hepatocyte Differentiation from Human ES Cells Using the Simple Embryoid Body Formation Method and the Staged-Additional Cocktail,” Scientific World Journal, Vol. 1, No. 9, 2009, pp. 884-890. doi:10.1100/tsw.2009.97 [44] A. Sen, M. S. Kallos and L. A. Behie, “Expansion of Mammalian Neural Stem Cells in Bioreactors: Effect of Power Input and Medium Viscosity,” Brain Research, Vol. 134, No. 1-2, 2002, pp. 103-113.
|