 American Journal of Anal yt ical Chemistry, 2011, 2, 710-717 doi:10.4236/ajac.2011.26081 Published Online October 2011 (http://www.SciRP.org/journal/ajac) Copyright © 2011 SciRes. AJAC Measuring Conditions for the Determination of Lead in Iron-Matrix Samples Using Graphite Atomizers with/without a Platform in Graphite Furnace Atomic Absorption Spectrometry Syun Morimoto, Tetsuya Ashino, Kazuaki Wagatsuma* Institute for Materials Research, Tohoku University, Ka tahira, Sendai, Japan E-mail: *wagatuma@imr.tohoku.ac.jp Received June 27, 2011; revised August 2, 2011; accepted August 15, 2011 Abstract In graphite furnace atomic absorption spectrometry (GF-AAS), the atomization process of lead occurring in graphite atomizers with/without a platform plate was investigated when palladium was added to an iron-matrix sample solution containing trace amounts of lead. Absorption profiles of a lead line were meas- ured at various compositions of iron and palladium. Variations in the gas temperature were also estimated with the progress of atomization, by using a two-line method under the assumption of a Boltzmann distribu- tion. Each addition of iron and palladium increased the lead absorbance in both the atomizers, indicating that iron or palladium became an effective matrix modifier for the determination of lead. Especially, palladium played a significant role for controlling chemical species of lead at the charring stage in the platform-type atomizer, to change several chemical species to a single species and eventually to yield a dominant peak of the lead absorbance at the atomizing stage. Furthermore, the addition of palladium delayed the peak after the gas atmosphere in the atomizer was heated to a higher temperature. These phenomena would be because the temperature of the platform at the charring stage was elevated more slowly compared to that of the furnace wall, and also because a thermally-stable compound, such as a palladium-lead solid solution, was produced by their metallurgical reaction during heating of the charring stage. A platform-type atomizer with palladium as the matrix modifier is recommended for the determination of lead in GF-AAS. The optimum condition for this was obtained in a coexistence of 1.0 × 10⁻² g/dm3 palladium, when the charring at 973 K and then the atomizing at 3073 K were conducted. Keywords: Graphite Furnace Atomic Absorption Spectrometry, Platform Atomizer, Gas Temperature, Matrix Modifier, Lead, Iron, Palladium 1. Introduction Several metallic elements, such as Cu, Pb, As and Bi, exert a negative influence on the quality of manufactured steel materials; for example, their segregation at grain boundaries or their precipitation may cause cracking dur- ing hot rolling in the steel-making process [1,2]. These elements are called tramp elements, because they are hardly removed through the conventional refining proc- ess and thus remain as impur ities during recycling of the steel materials. It is therefore required that trace amounts of these elements are accurately determined to control the mechanical properties of commercial steel products. Graphite-furnace atomic absorption spectrometry (GF- AAS) [3] is usually employed for the determination of metallic elements having a concentration level of 10–6% [4-7], and thus can be applied to the tramp elements in steel materials [7]. It is known in GF-AAS that the absorption signal of an analyte element is varied by co-existing matrix elements in the sample solution, called a matrix effect, even if the temperatures of GF are optimized. Therefore, the matrix elements are usually pre-removed in the analytical ap- plication of GF-AAS; however, it is in most cases fol- lowed by a time-consuming chemical procedure. Koba- yashi el al. reported on the direct determination of tramp 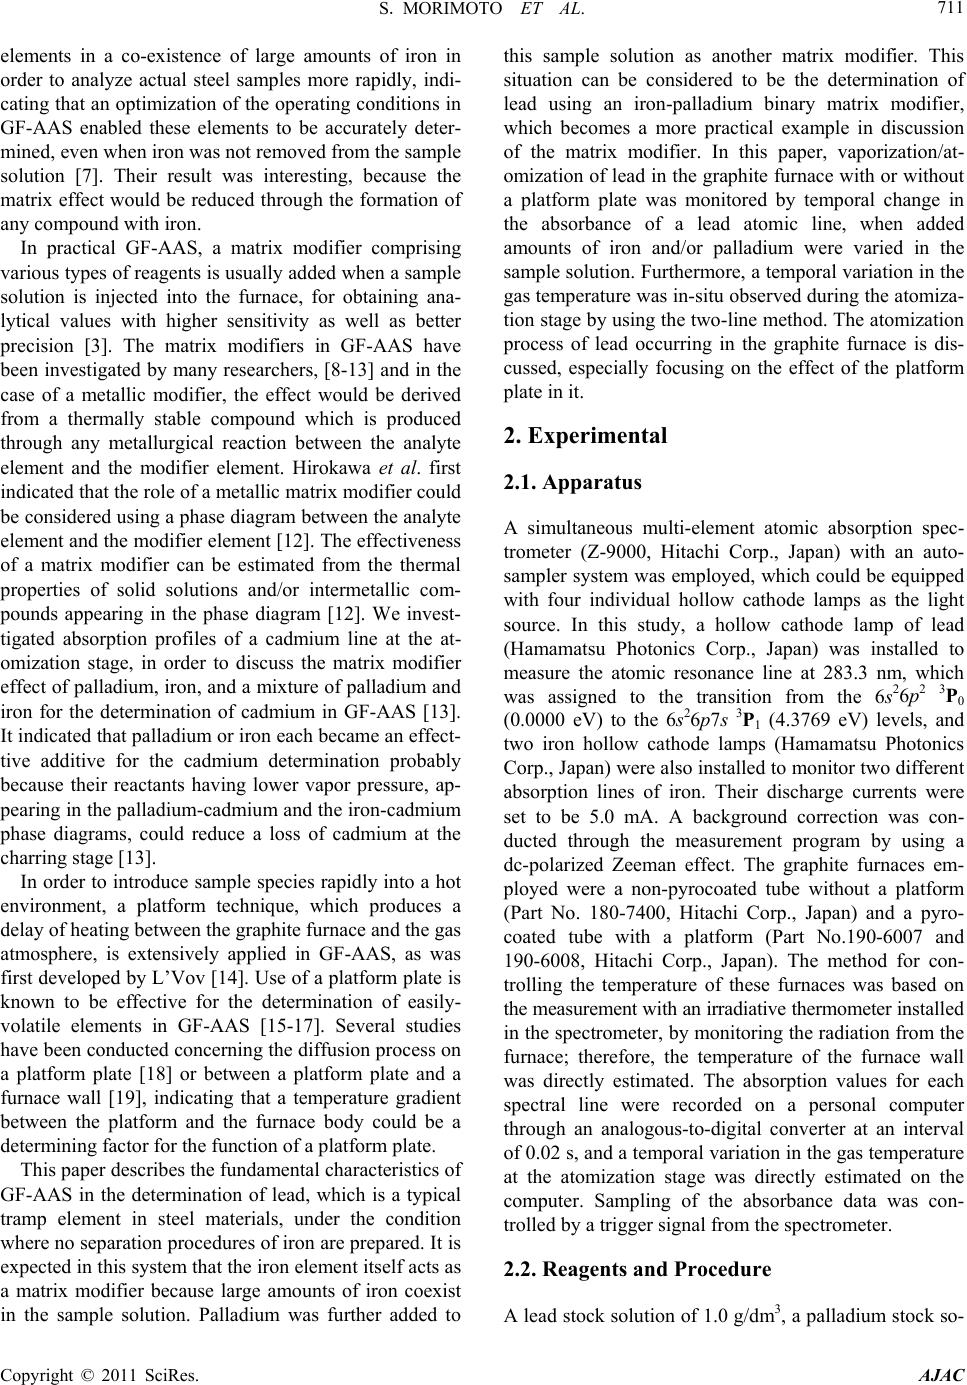 S. MORIMOTO ET AL. Copyright © 2011 SciRes. AJAC 711 elements in a co-existence of large amounts of iron in order to analyze actual steel samples more rapidly, indi- cating that an optimization of the operating condition s in GF-AAS enabled these elements to be accurately deter- mined, even when iron was not removed from the sample solution [7]. Their result was interesting, because the matrix effect would be reduced through the formation of any compound with iron. In practical GF-AAS, a matrix modifier comprising various types of reagents is usually added when a sample solution is injected into the furnace, for obtaining ana- lytical values with higher sensitivity as well as better precision [3]. The matrix modifiers in GF-AAS have been investigated by many researchers, [8-13] and in the case of a metallic modifier, the effect would be derived from a thermally stable compound which is produced through any metallurgical reaction between the analyte element and the modifier element. Hirokawa et al. first indicated that the role of a metallic matrix mo difier could be considered using a phase diagram between the analyte element and the modifier element [12]. The effectiveness of a matrix modifier can be estimated from the thermal properties of solid solutions and/or intermetallic com- pounds appearing in the phase diagram [12]. We invest- tigated absorption profiles of a cadmium line at the at- omization stage, in order to discuss the matrix modifier effect of palladium, iron, and a mixture of palladium and iron for the determination of cadmium in GF-AAS [13]. It indicated that palladium or iron each became an effect- tive additive for the cadmium determination probably because their reactants having lower vapor pressure, ap- pearing in the palladium-cadmium and the iron-cadmium phase diagrams, could reduce a loss of cadmium at the charring stage [13]. In order to introduce sample species rapidly into a hot environment, a platform technique, which produces a delay of heating between the graphite furnace and the gas atmosphere, is extensively applied in GF-AAS, as was first developed by L’Vov [14]. Use of a platform plate is known to be effective for the determination of easily- volatile elements in GF-AAS [15-17]. Several studies have been conducted concerning the diffusion process on a platform plate [18] or between a platform plate and a furnace wall [19], indicating that a temperature gradient between the platform and the furnace body could be a determini ng factor for the funct i on of a platf orm plate. This paper describes the fundamental characteristics of GF-AAS in the determination of lead, which is a typical tramp element in steel materials, under the condition where no separatio n proced ures of iron ar e prepared. It is expected in this system that the iron element itself acts as a matrix modifier because large amounts of iron coexist in the sample solution. Palladium was further added to this sample solution as another matrix modifier. This situation can be considered to be the determination of lead using an iron-palladium binary matrix modifier, which becomes a more practical example in discussion of the matrix modifier. In this paper, vaporization/at- omization of lead in the graphite furnace with or without a platform plate was monitored by temporal change in the absorbance of a lead atomic line, when added amounts of iron and/or palladium were varied in the sample solution. Furthermore, a temporal variation in the gas temperature was in-situ observed during the atomiza- tion stage by using the two-line method. The atomization process of lead occurring in the graphite furnace is dis- cussed, especially focusing on the effect of the platform plate in it. 2. Experimental 2.1. Apparatus A simultaneous multi-element atomic absorption spec- trometer (Z-9000, Hitachi Corp., Japan) with an auto- sampler system was employed, which could be equipped with four individual hollow cathode lamps as the light source. In this study, a hollow cathode lamp of lead (Hamamatsu Photonics Corp., Japan) was installed to measure the atomic resonance line at 283.3 nm, which was assigned to the transition from the 6s26p2 3P0 (0.0000 eV) to the 6s26p7s 3P1 (4.3769 eV) levels, and two iron hollow cathode lamps (Hamamatsu Photonics Corp., Japan) were also installed to monitor two different absorption lines of iron. Their discharge currents were set to be 5.0 mA. A background correction was con- ducted through the measurement program by using a dc-polarized Zeeman effect. The graphite furnaces em- ployed were a non-pyrocoated tube without a platform (Part No. 180-7400, Hitachi Corp., Japan) and a pyro- coated tube with a platform (Part No.190-6007 and 190-6008, Hitachi Corp., Japan). The method for con- trolling the temperature of these furnaces was based on the measure ment wi th an irrad iativ e ther mo meter in s ta l l e d in the spectrometer, by monitoring the radiation from the furnace; therefore, the temperature of the furnace wall was directly estimated. The absorption values for each spectral line were recorded on a personal computer through an analogous-to-digital converter at an interval of 0.02 s, and a temporal variation in the gas temperature at the atomization stage was directly estimated on the computer. Sampling of the absorbance data was con- trolled by a trigger signal from the spectrometer. 2.2. Reagents and Procedure A lead stock solution of 1.0 g/dm3, a palladium stock so-  S. MORIMOTO ET AL. Copyright © 2011 SciRes. AJAC 712 lution of 3.0 g/dm3, and an iron stock solution of 2.0 g/dm3 were prepared by dissolving each pure metal (99.9%) with 7 M-nitric acid for lead and palladium or with 7M-nitric acid containing a small amount of hydro- chloric acid for iron. They were further diluted with de-ionized water for a working solution containing lead of 1.0 × 10⁻⁴ g/dm3 and appropriate amounts of palla- dium and/or iron. The concentration of palladium or iron in the working solution was each varied from 0, 1.0 × 10⁻⁴, 1.0 × 10⁻³, 1.0 × 10⁻², to 1.0 × 10⁻¹ g/dm3. The pre- pared sample solutions were injected into the furnace at a volume of 2 × 10⁻⁵ dm3. The temperature program during heating of the fur- nace was optimized when a test solution containing lead of 1.0 × 10⁻⁴ g/dm3 and iron of 1.0 × 10⁻³ g/dm3 was measured at various charring and atomizing temperatures. The drying stage was carr ied out at 353 - 423 K for 30 s and the cleaning stage at 3273 K for 10 s. The charring temperature was determined at 973 K for lead, because it began to be vaporized at the charring stage at higher temperatures. The charring stage was conducted by holding the corresponding charring temperature for 30 s. The atomizing stage was held for 8 s at a temperature of 3073 K. At the drying, charring, and cleaning stages, argon gas was introduced into the furnace at a flow rate of about 0.2 dm3/min to remove water and other volatile species; however, no gas flow was required only at the atomization stage to keep the analyte species in the fur- nace and thus to obtain a better sensitivity. 2.3. Two-Line Method The principle of the two-line method has already been described elsewhere [20]. This method is based on the difference in the number density between two energy levels, which can be determined by a characteristic tem- perature under thermodynamic equilibrium [21]. The temperature can be estimated from the absorbance ratio between two spectral lines of a probe element whose lower energy levels are different. Variations in the gas temperature directly depend upon the spatial and tempo- ral distribution of the probe element in the furnace and thus relate to its diffusion behavior [20]. The gas tem- perature is usually different from the furnace wall tem- perature, which is monitored in conven tional temperature control for GF-AAS. We discussed the diffusion of ana- lyte elements in the furnace with the progress of atomi- zation, by comparing the gas temperatures which were estimated between iron and nickel as the probe element [22]. The gas temperature could yield dynamic informa- tion on the gas atmosphere where the sample volume was expanding in the graphite furnace. In this study, a pair of iron atomic lines, Fe I 372.0 nm and Fe I 373.7 nm, was employed as probe lines for the temperature measurement. The former line is assigned to the transition from the 3d64s2 5D4 (0.0000 eV) to the 3d64s4p 5F5 (3.3319 eV) levels having a gA value of 1.467 × 10⁸ s–1, and the latter line to the transition from the 3d64s2 5D3 (0.0516 eV) to the 3 d64s4p 5F4 (3.3682 eV) levels having a gA value of 0.994 × 10⁸ s –1 [23]. The energy difference between the 3d64s2 5D4 and the 3d64s2 5D3 levels is the most important factor in determining the temperature [13]. 2.4. Phase Diagram In our previous paper, we discussed the matrix modifier effect of iron and palladium on the determination of cadmium by using the corresponding phase diagrams [13]. It indicated that both the elements became effective modifiers because their compounds could reduce a loss of cadmium at the heating stages before the atomization while cadmium alone was easily evaporated. Lead is less volatile than cadmium. The temperature representing a va por pressure of 1.3 Pa is rep orted at 573 K for cadmium and at 991 K for lead, although their melting points are similar: 594 K for cadmium and 601 K for lead. On the other hand, palladium and iron are much less evaporated compared to lead. The temperature representing a vapor pressure of 1.3 Pa is reported at 1839 K for palladium and at 1720 K for iron. It can be thus considered that the addition of palladium or iron is generally effective in the determination of lead in GF-AAS due to hindering of the evaporation loss, when large amounts of them comprise the sample matrix in- cluding a trace amount of lead. Lead and cadmium have a similar metallurgical fea- ture on the phase diagram relating to iron or palladium, where similar metallic phases are formed at the corre- sponding compositions and temperatures. In a lead-pal- ladium binary alloy system, lead can be soluble in the solid palladium up to the composition of ca 30 atomic % Pb, where a stable solid solution between palladium and lead is produced [24]. The formation of the solid solu tion is expected to reduce the vaporization of lead, because the melting temperature becomes much higher compared to pure lead. On the other hand, in a lead-iron binary alloy system, they are mutually insoluble not only in the liquid state but in the solid phase all over the chemical compositions, meaning that neither solid solution phases nor intermetallic compounds are produced between lead and iron [24]. In this case, a modifier effect by any compound formation is not expected. However, because a two-phase separation occurs at temperatures of more than the melting poin t of lead due to a large difference in specific gravity between lead and iron, lead clusters  S. MORIMOTO ET AL. Copyright © 2011 SciRes. AJAC 713 would be covered with excess amounts of iron matrix, which eventually reduces the vaporization of lead physic- cally. 3. Results and Discussion 3.1. Absorption Profile of Lead Line during the Atomization Stage Figure 1 shows temporal changes in the absorbance for the lead and the iron lines during an atomization stage, together with those of the wall and the gas temperatures, when the iron element coexists or is not in the sample solution. A graphite tube without a platform (a normal tube cuvette) was employed as the atomization source. After a charring temperature of 973 K had been kept for 30 s, it took 1.0 s to rise from the charring stage to an atomizing stage of 3073 K and then the temperature was held for 6 s, as shown using a straight line in Figure 1. The gas temperature in the atomization process was es- timated from the absorption of the iron sp ectral lines: Fe I 372.0 nm and Fe I 373.7nm, after the charring stage. The absorbance for lead of 1.0 × 10⁻⁴ g/dm3 was meas- ured when iron of 1.0 × 10⁻³ g/dm3 was in the sample solution or absent. The lead absorbance reaches a maxi- mum at a duration time of 0.40 - 0.42 s when the wall temperature is on the way of heating to the atomizing temperature programmed at 3073 K, whereas an iron peak appears at a duration time of 1.4 s after the wall temperature rises up to 3073 K. As also shown in Figure 1, a maximum peak of the gas temperature appears to be 2550 K at a duration time of 1.6 s, whereas the peak of the lead absorbance appears earlier at lower gas tem- perature. This effect is because the absorption of lead Figure 1. Temporal variations in the absorbance of Pb I 283.3 nm (a, b) and Fe I 372.0 nm (c), and in the wall (d) and the gas temperatures (e) at an atomization stage after a charring at 973 K for 30 s. The absorbance of the Pb I line is measured with (a)/without (b) an iron matrix of 1.0 × 10⁻³ g/dm3. A normal tube cuvette is employed as the atomiza- tion source. begins to be detected when the furnace wall enables lead atoms to be vaporized, regardless of the gas temperature in the furnace, which indicates that the vaporization of lead is mainly controlled by thermal conduct with the graphite furn ace. It is also found in Figure 1 that the lead absorbance in the iron-containing sample is 1.45-times larger than that in the iron-free sample. Therefore, the iron element becomes a matrix modifier to improve the detection sensitivity of lead in GF-AAS. Figure 2 shows temporal variations in the absorption profile of lead and iron, in the same samples and under the same heating conditions as in Figure 1 except that a graphite tube with a platform (a platform cuvette) is em- ployed as the atomizer. The lead absorbance of the iron-free sample has a broad maximum peak at a dura- tion time of 1.28 s, whereas that of the iron-containing sample comprises the first peak at 1.28 s and the second peak at 1.68 s having much larger intensity. It is likely to see that the broad peak in the iron-free sample also com- prises the first peak having larger intensity and the sec- ond peak being a shoulder. Differing from the result of the normal tube cuvette (see Figure 1), these absorp- tion peaks appear after the furnace wall is heated up to the atomizing temperature programmed at 3073 K, and the absorption peak of iron also appears after a slight delay at a duration time of 2.68 s. The reason for the peak splitting of the lead absorbance would be that two different chemical species of lead are left at the charring stage, which is attributed to lower temperature of the platform compared to the wall temperature. The tem- perature of the platform is elevated more slowly due to indirect irradiative heating ; as a result, the appearance of the absorbance peaks becomes more delayed and broad- ened, compared to those using the normal tube cuvette. The splitting of the absorption peak is not favorable for the determination of lead in analytical applications. The Figure 2. Absorption profiles corresponding to Figure 1, when a platform cuvette is employed instead of the normal tube cuvette. 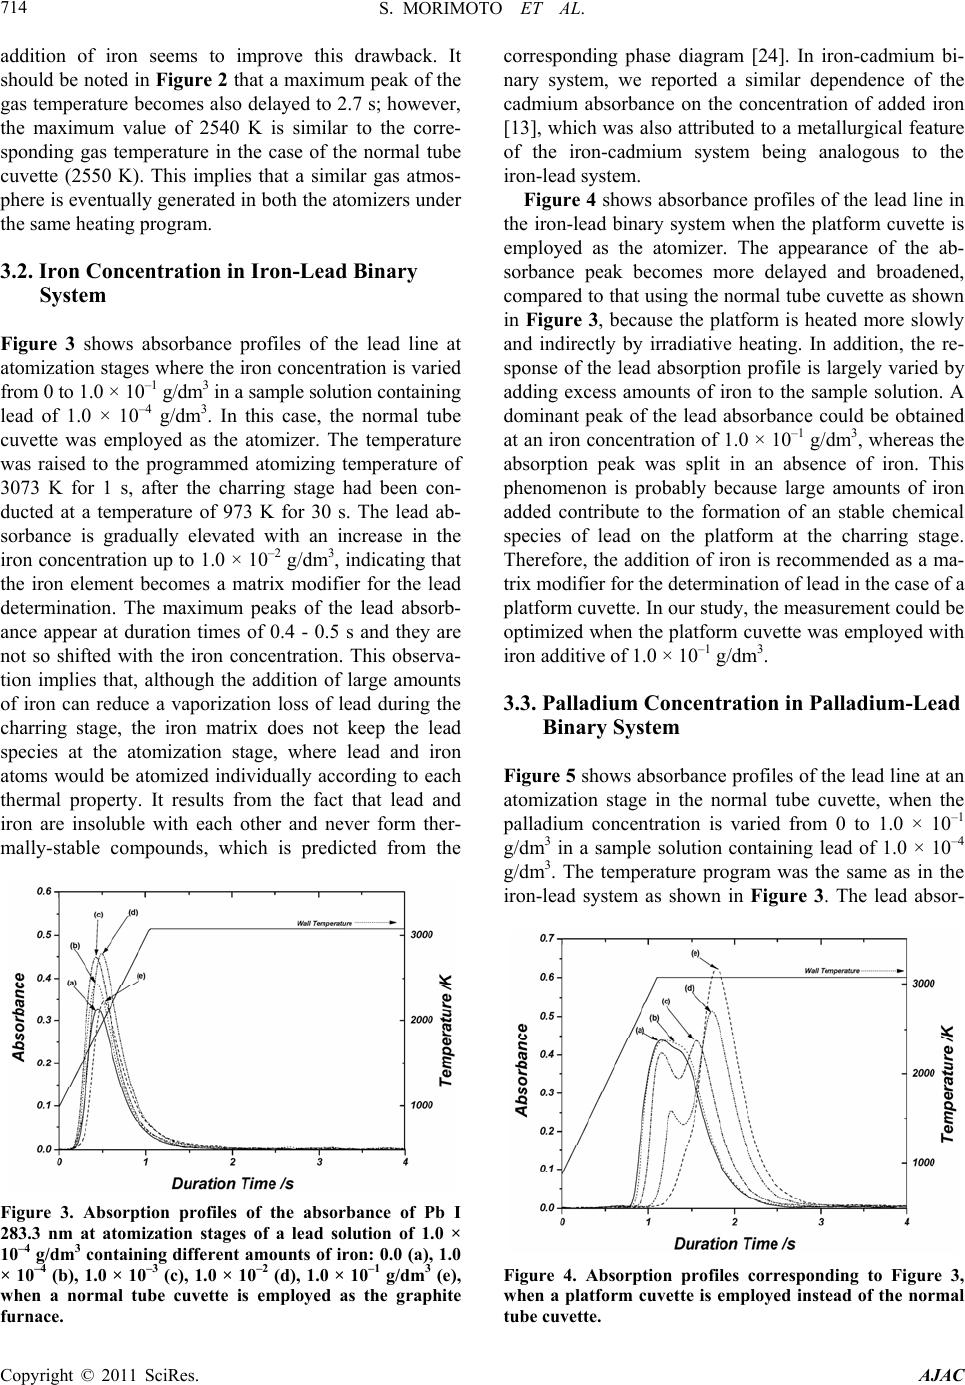 S. MORIMOTO ET AL. Copyright © 2011 SciRes. AJAC 714 addition of iron seems to improve this drawback. It should be noted in Figure 2 that a maximum peak of the gas temperature becomes also delayed to 2.7 s; however, the maximum value of 2540 K is similar to the corre- sponding gas temperature in the case of the normal tube cuvette (2550 K). This implies that a similar gas atmos- phere is eventually generated in both the atomizers under the same heating program. 3.2. Iron Concentration in Iron-Lead Binary System Figure 3 shows absorbance profiles of the lead line at atomization stages where the iron concentration is varied from 0 to 1.0 × 10⁻¹ g/dm3 in a sample solution cont a i n i n g lead of 1.0 × 10⁻⁴ g/dm3. In this case, the normal tube cuvette was employed as the atomizer. The temperature was raised to the programmed atomizing temperature of 3073 K for 1 s, after the charring stage had been con- ducted at a temperature of 973 K for 30 s. The lead ab- sorbance is gradually elevated with an increase in the iron concentratio n up to 1.0 × 10⁻² g/dm3, indicating that the iron element becomes a matrix modifier for the lead determination. The maximum peaks of the lead absorb- ance appear at duration times of 0.4 - 0.5 s and they are not so shifted with the iron concentration. This observa- tion implies that, although the addition of large amounts of iron can reduce a vaporization loss of lead during the charring stage, the iron matrix does not keep the lead species at the atomization stage, where lead and iron atoms would be atomized individually according to each thermal property. It results from the fact that lead and iron are insoluble with each other and never form ther- mally-stable compounds, which is predicted from the Figure 3. Absorption profiles of the absorbance of Pb I 283.3 nm at atomization stages of a lead solution of 1.0 × 10⁻⁴ g/dm3 containing different amounts of iron: 0.0 (a), 1.0 × 10⁻⁴ (b), 1.0 × 10⁻³ (c), 1.0 × 10⁻² (d), 1.0 × 10⁻¹ g/dm3 (e), when a normal tube cuvette is employed as the graphite furnace. corresponding phase diagram [24]. In iron-cadmium bi- nary system, we reported a similar dependence of the cadmium absorbance on the concentration of added iron [13], which was also attributed to a metallurgical feature of the iron-cadmium system being analogous to the iron-lead system. Figure 4 shows absorbance profiles of the lead line in the iron-lead binary system when the platform cuvette is employed as the atomizer. The appearance of the ab- sorbance peak becomes more delayed and broadened, compared to that using the normal tube cuvette as show n in Figure 3, because the platform is heated more slowly and indirectly by irradiative heating. In addition, the re- sponse of the lead absorption profile is largely varied by adding excess amounts of iron to the sample solution. A dominant peak of the lead absorbance could be obtained at an iron concentration of 1.0 × 10⁻¹ g/dm3, whereas the absorption peak was split in an absence of iron. This phenomenon is probably because large amounts of iron added contribute to the formation of an stable chemical species of lead on the platform at the charring stage. Therefore, the addition of iron is recommended as a ma- trix modifier for the determination of lead in the case of a platform cuvette. In our study, the measurement could be optimized when the platform cuvette was employed with iron additive of 1.0 × 10⁻¹ g/dm3. 3.3. Palladium Concentration in Palladium-Lead Binary System Figure 5 shows absorbance profiles of the lead line at an atomization stage in the normal tube cuvette, when the palladium concentration is varied from 0 to 1.0 × 10⁻¹ g/dm3 in a sample solution containing lead of 1.0 × 10⁻⁴ g/dm3. The temperature program was the same as in the iron-lead system as shown in Figure 3. The lead absor- Figure 4. Absorption profiles corresponding to Figure 3, when a platform cuvette is employed instead of the normal tube cuvette. 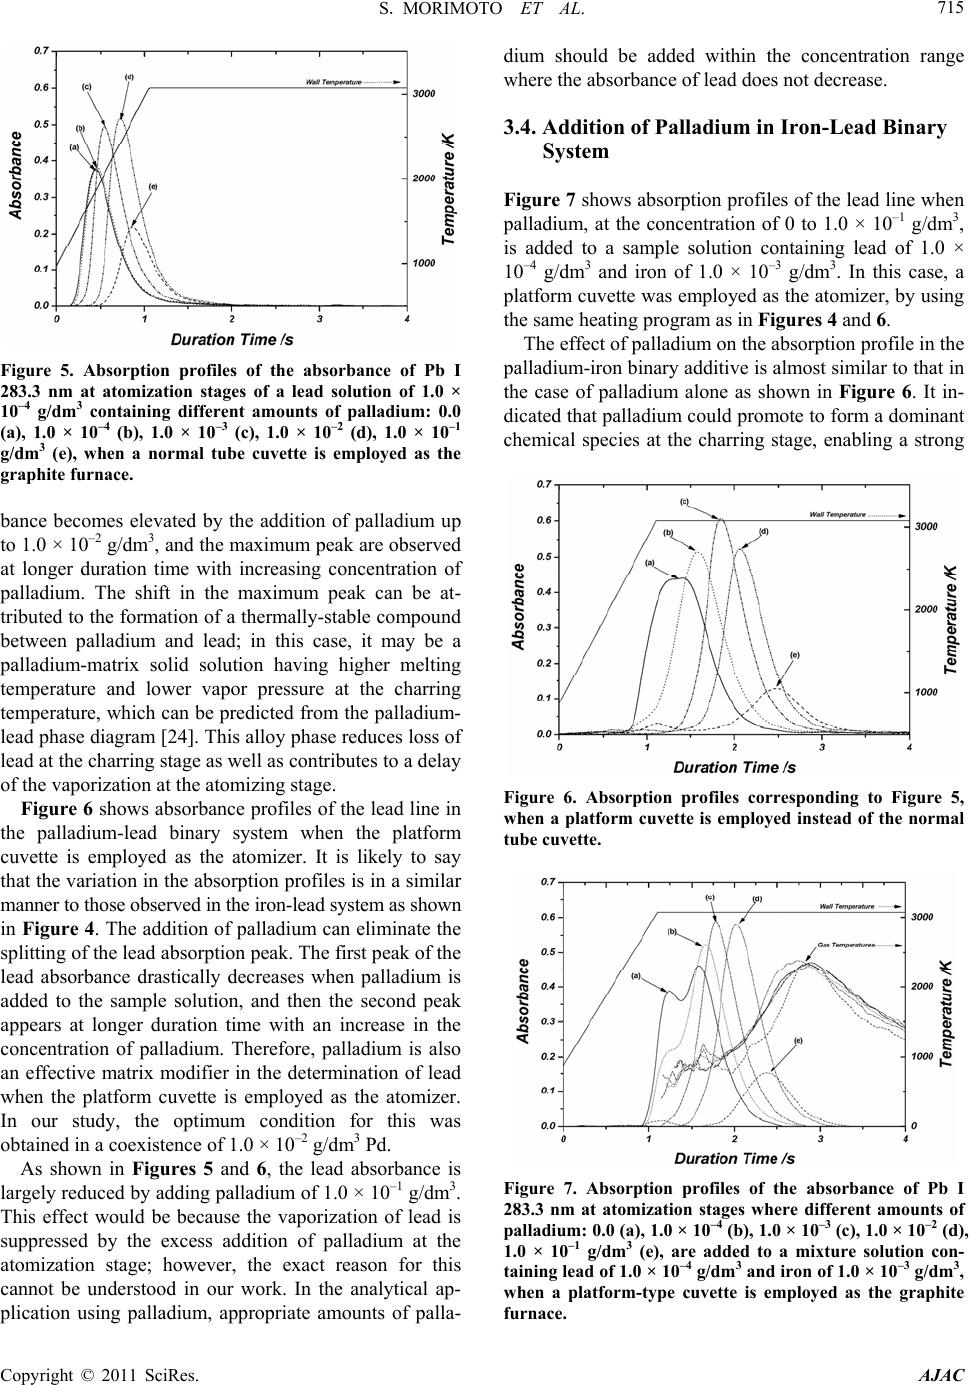 S. MORIMOTO ET AL. Copyright © 2011 SciRes. AJAC 715 Figure 5. Absorption profiles of the absorbance of Pb I 283.3 nm at atomization stages of a lead solution of 1.0 × 10⁻⁴ g/dm3 containing different amounts of palladium: 0.0 (a), 1.0 × 10⁻⁴ (b), 1.0 × 10⁻³ (c), 1.0 × 10⁻² (d), 1.0 × 10⁻¹ g/dm3 (e), when a normal tube cuvette is employed as the graphite furnace. bance becomes elevated by the addition of palladium up to 1.0 × 10⁻² g/dm3, and t he ma ximu m p eak are observed at longer duration time with increasing concentration of palladium. The shift in the maximum peak can be at- tributed to the formation of a thermally-stable compound between palladium and lead; in this case, it may be a palladium-matrix solid solution having higher melting temperature and lower vapor pressure at the charring temperature, which can be predicted from the palladium- lead phase diagram [24]. This alloy phase reduces loss of lead at the charring stage as well as contributes to a delay of the vaporization at the atomizing stage. Figure 6 shows absorbance profiles of the lead line in the palladium-lead binary system when the platform cuvette is employed as the atomizer. It is likely to say that the variation in the ab sorption profiles is in a similar manner to those observed i n t he i ron-l ead sy st em as shown in Figure 4. The addition of palladium can eliminate the splitting of the lead absorption peak. The first peak of the lead absorbance drastically decreases when palladium is added to the sample solution, and then the second peak appears at longer duration time with an increase in the concentration of palladium. Therefore, palladium is also an effective matrix modifier in the determination of lead when the platform cuvette is employed as the atomizer. In our study, the optimum condition for this was obtained in a coexistence of 1.0 × 10⁻² g/dm3 Pd. As shown in Figures 5 and 6, the lead absorbance is largely reduced by adding palladium of 1.0 × 10⁻¹ g/dm3. This effect would be because the vaporization of lead is suppressed by the excess addition of palladium at the atomization stage; however, the exact reason for this cannot be understood in our work. In the analytical ap- plication using palladium, appropriate amounts of palla- dium should be added within the concentration range where the absorbance of lead does not de cr ease. 3.4. Addition of Palladium in Iron-Lead Binary System Figure 7 shows absorption pro files of the lead line when palladium, at the concentration of 0 to 1.0 × 10⁻¹ g/dm3, is added to a sample solution containing lead of 1.0 × 10⁻⁴ g/dm3 and iron of 1.0 × 10⁻³ g/dm3. In this case, a platform cuvette was employed as the atomizer, by using the same heating program as in Figures 4 and 6. The effect of palladium on the absorption profile in the palladium-iron binary additive is almost similar to that in the case of palladium alone as shown in Figure 6. It in- dicated that palladium could promote to form a dominant chemical species at the charring stage, enabling a strong Figure 6. Absorption profiles corresponding to Figure 5, when a platform cuvette is employed instead of the normal tube cuvette. Figure 7. Absorption profiles of the absorbance of Pb I 283.3 nm at atomization stages where different amounts of palladi um: 0. 0 (a), 1. 0 × 10–4 (b), 1.0 × 10⁻³ (c), 1.0 × 10⁻² (d), 1.0 × 10⁻¹ g/dm3 (e), are added to a mixture solution con- taining lead of 1.0 × 10⁻⁴ g/dm3 and iron of 1.0 × 10⁻³ g/dm3, when a platform-type cuvette is employed as the graphite furnace. 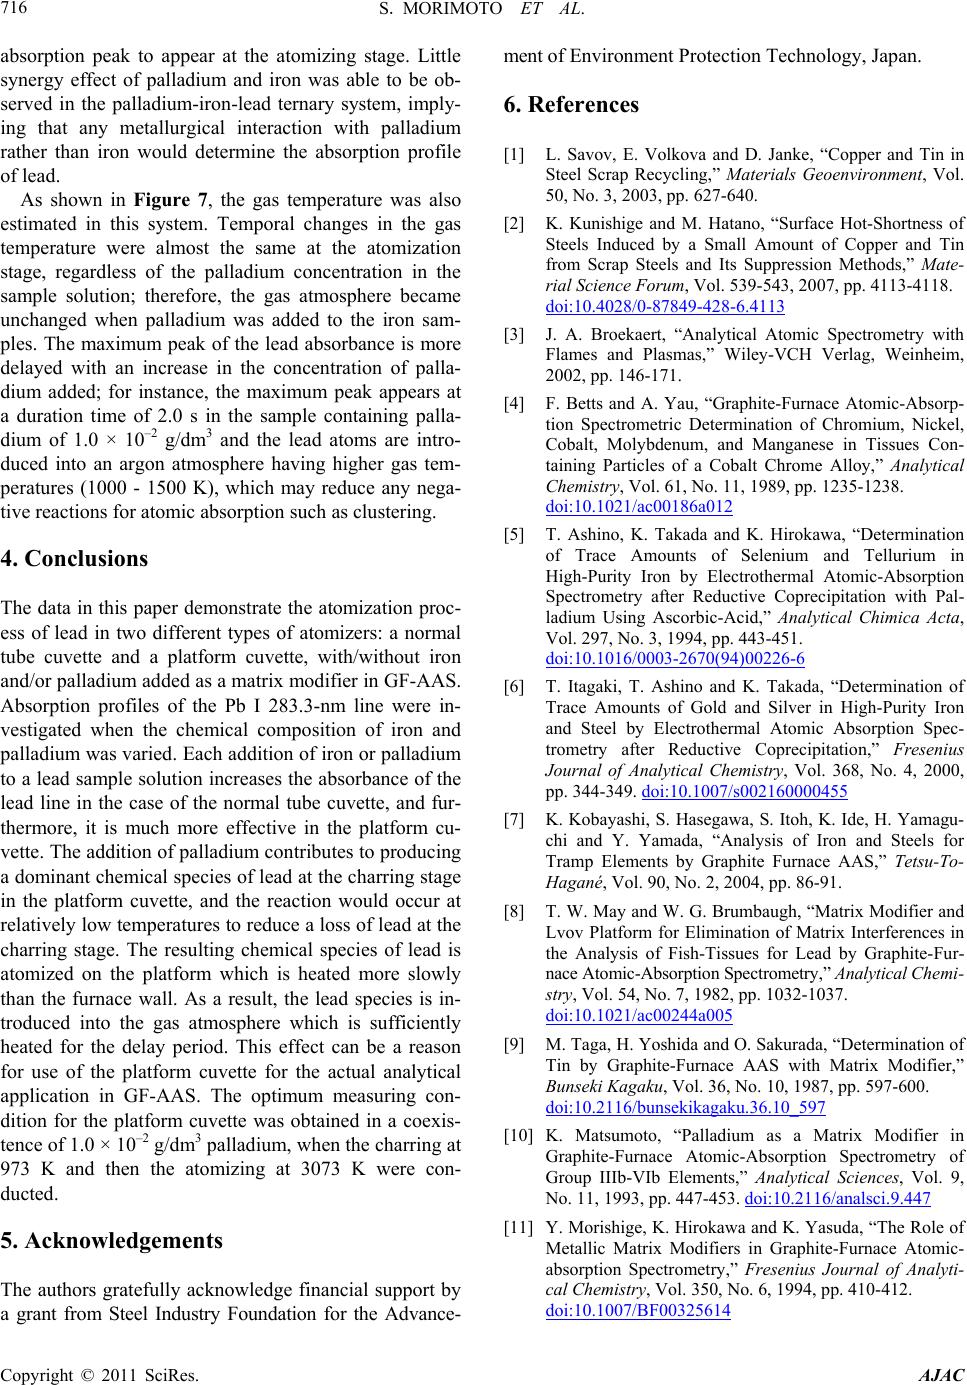 S. MORIMOTO ET AL. Copyright © 2011 SciRes. AJAC 716 absorption peak to appear at the atomizing stage. Little synergy effect of palladium and iron was able to be ob- served in the palladium-iron-lead ternary system, imply- ing that any metallurgical interaction with palladium rather than iron would determine the absorption profile of lead. As shown in Figure 7, the gas temperature was also estimated in this system. Temporal changes in the gas temperature were almost the same at the atomization stage, regardless of the palladium concentration in the sample solution; therefore, the gas atmosphere became unchanged when palladium was added to the iron sam- ples. The maximum peak of the lead absorbance is more delayed with an increase in the concentration of palla- dium added; for instance, the maximum peak appears at a duration time of 2.0 s in the sample containing palla- dium of 1.0 × 10⁻² g/dm3 and the lead atoms are intro- duced into an argon atmosphere having higher gas tem- peratures (1000 - 1500 K), which may reduce any nega- tive reactions for atomic absorption such as clustering. 4. Conclusions The data in this paper demonstrate the atomization proc- ess of lead in two different types of atomizers: a normal tube cuvette and a platform cuvette, with/without iron and/or palladium added as a matrix modifier in GF-AAS. Absorption profiles of the Pb I 283.3-nm line were in- vestigated when the chemical composition of iron and palladium was varied. Each addition of iron or palladium to a lead sample solution increases the absorbance of the lead line in the case of the normal tube cuvette, and fur- thermore, it is much more effective in the platform cu- vette. The addition of palladium contributes to producing a dominant chemical species of lead at the charring stage in the platform cuvette, and the reaction would occur at relatively low temperatures to reduce a loss of lead at the charring stage. The resulting chemical species of lead is atomized on the platform which is heated more slowly than the furnace wall. As a result, the lead species is in- troduced into the gas atmosphere which is sufficiently heated for the delay period. This effect can be a reason for use of the platform cuvette for the actual analytical application in GF-AAS. The optimum measuring con- dition for the platform cuvette was obtained in a coexis- tence of 1.0 × 10⁻² g/dm3 palladium, when the charring at 973 K and then the atomizing at 3073 K were con- ducted. 5. Acknowledgements The authors gratefully acknowledge financial support by a grant from Steel Industry Foundation for the Advance- ment of Environment Protection Technology, Japan. 6. References [1] L. Savov, E. Volkova and D. Janke, “Copper and Tin in Steel Scrap Recycling,” Materials Geoenvironment, Vol. 50, No. 3, 2003, pp. 627-640. [2] K. Kunishige and M. Hatano, “Surface Hot-Shortness of Steels Induced by a Small Amount of Copper and Tin from Scrap Steels and Its Suppression Methods,” Mate- rial Science Forum, Vol. 539-543, 2007, pp. 4113-4118. doi:10.4028/0-87849-428-6.4113 [3] J. A. Broekaert, “Analytical Atomic Spectrometry with Flames and Plasmas,” Wiley-VCH Verlag, Weinheim, 2002, pp. 146-171. [4] F. Betts and A. Yau, “Graphite-Furnace Atomic-Absorp- tion Spectrometric Determination of Chromium, Nickel, Cobalt, Molybdenum, and Manganese in Tissues Con- taining Particles of a Cobalt Chrome Alloy,” Analytical Chemistry, Vol. 61, No. 11, 1989, pp. 1235-1238. doi:10.1021/ac00186a012 [5] T. Ashino, K. Takada and K. Hirokawa, “Determination of Trace Amounts of Selenium and Tellurium in High-Purity Iron by Electrothermal Atomic-Absorption Spectrometry after Reductive Coprecipitation with Pal- ladium Using Ascorbic-Acid,” Analytical Chimica Acta, Vol. 297, No. 3, 1994, pp. 443-451. doi:10.1016/0003-2670(94)00226-6 [6] T. Itagaki, T. Ashino and K. Takada, “Determination of Trace Amounts of Gold and Silver in High-Purity Iron and Steel by Electrothermal Atomic Absorption Spec- trometry after Reductive Coprecipitation,” Fresenius Journal of Analytical Chemistry, Vol. 368, No. 4, 2000, pp. 344-349. doi:10.1007/s002160000455 [7] K. Kobayashi, S. Hasegawa, S. Itoh, K. Ide, H. Yamagu- chi and Y. Yamada, “Analysis of Iron and Steels for Tramp Elements by Graphite Furnace AAS,” Tetsu-To- Hagané, Vol. 90, No. 2, 2004, pp. 86-91. [8] T. W. May and W. G. Brumbaugh, “Matrix Modifier and Lvov Platform for Elimination of Matrix Interferences in the Analysis of Fish-Tissues for Lead by Graphite-Fur- nace Atomic-Absorption Spectrometry,” Analytical Chemi- stry, Vol. 54, No. 7, 1982, pp. 1032-1037. doi:10.1021/ac00244a005 [9] M. Taga, H. Yoshida and O. Sakurada, “Determination of Tin by Graphite-Furnace AAS with Matrix Modifier,” Bunseki Kagaku, Vol. 36, No. 10, 1987, pp. 597-600. doi:10.2116/bunsekikagaku.36.10_597 [10] K. Matsumoto, “Palladium as a Matrix Modifier in Graphite-Furnace Atomic-Absorption Spectrometry of Group IIIb-VIb Elements,” Analytical Sciences, Vol. 9, No. 11, 1993, pp. 447-453. doi:10.2116/analsci.9.447 [11] Y. Morishige, K. Hirokawa and K. Yasuda, “The Role of Metallic Matrix Modifiers in Graphite-Furnace Atomic- absorption Spectrometry,” Fresenius Journal of Analyti- cal Chemistry, Vol. 350, No. 6, 1994, pp. 410-412. doi:10.1007/BF00325614 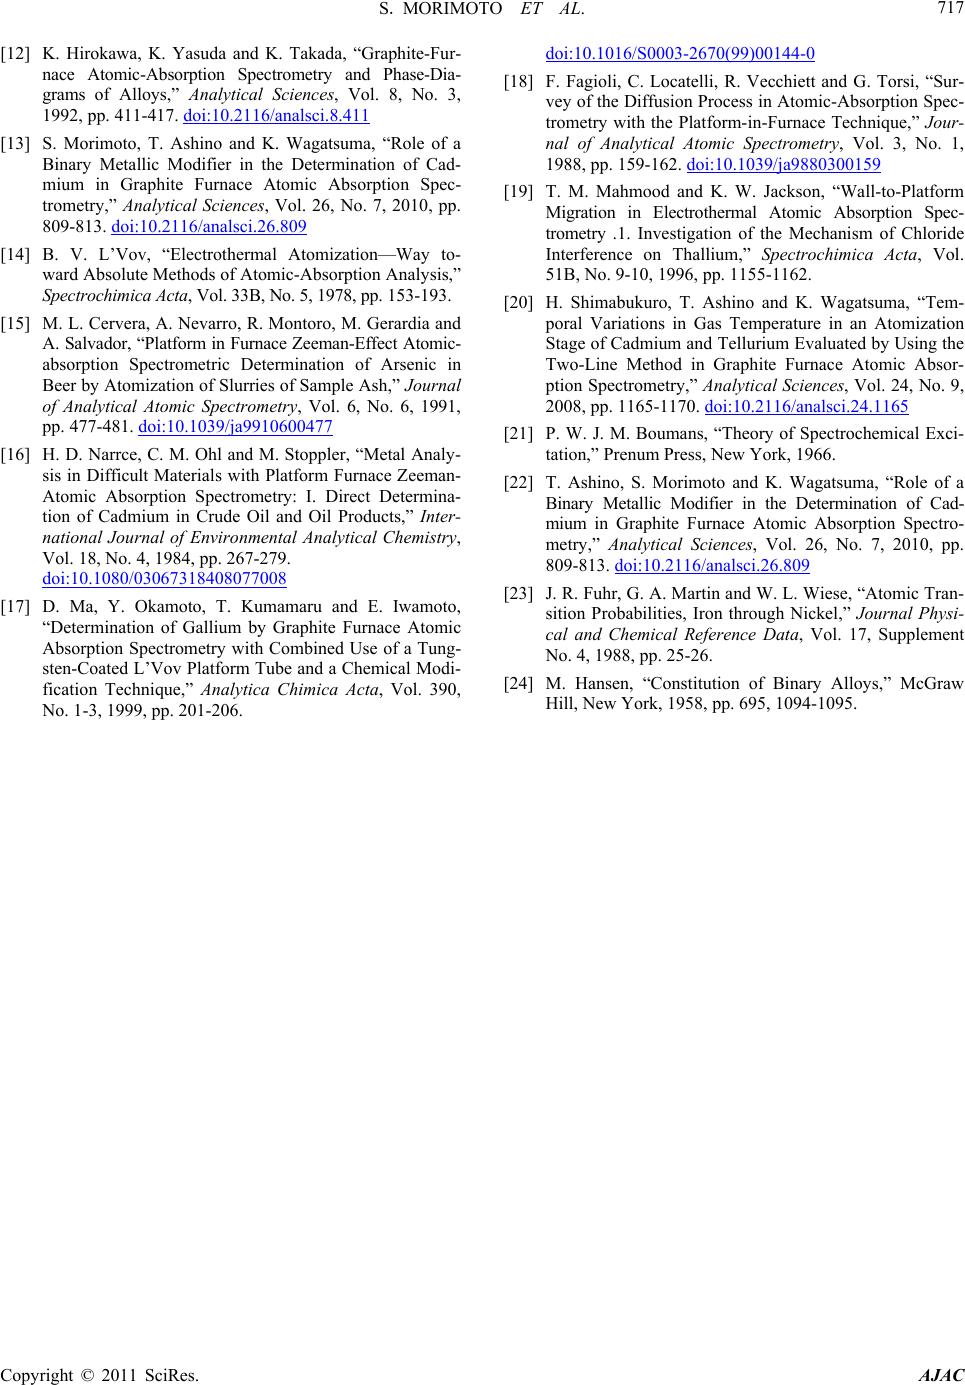 S. MORIMOTO ET AL. Copyright © 2011 SciRes. AJAC 717 [12] K. Hirokawa, K. Yasuda and K. Takada, “Graphite-Fur- nace Atomic-Absorption Spectrometry and Phase-Dia- grams of Alloys,” Analytical Sciences, Vol. 8, No. 3, 1992, pp. 411-417. doi:10.2116/analsci.8.411 [13] S. Morimoto, T. Ashino and K. Wagatsuma, “Role of a Binary Metallic Modifier in the Determination of Cad- mium in Graphite Furnace Atomic Absorption Spec- trometry,” Analytical Sciences, Vol. 26, No. 7, 2010, pp. 809-813. doi:10.2116/analsci.26.809 [14] B. V. L’Vov, “Electrothermal Atomization—Way to- ward Absolute Methods of Atomic-Absorption Analysis,” Spectrochimica Acta, Vo l . 33B, N o . 5, 1 9 7 8 , pp. 153-193. [15] M. L. Cervera, A. Nevarro, R. Montoro, M. Gerardia and A. Salvador, “Platform in Furnace Zeeman-Effect Atomic- absorption Spectrometric Determination of Arsenic in Beer by Atomization of Slurries of Sample Ash,” Journal of Analytical Atomic Spectrometry, Vol. 6, No. 6, 1991, pp. 477-481. doi:10.1039/ja9910600477 [16] H. D. Narrce, C. M. Ohl and M. Stoppler, “Metal Analy- sis in Difficult Materials with Platform Furnace Zeeman- Atomic Absorption Spectrometry: I. Direct Determina- tion of Cadmium in Crude Oil and Oil Products,” Inter- national Journal of Environmental Analytical Chemistry, Vol. 18, No. 4, 1984, pp. 267-279. doi:10.1080/03067318408077008 [17] D. Ma, Y. Okamoto, T. Kumamaru and E. Iwamoto, “Determination of Gallium by Graphite Furnace Atomic Absorption Spectrometry with Combined Use of a Tung- sten-Coated L’Vov Platform Tube and a Chemical Modi- fication Technique,” Analytica Chimica Acta, Vol. 390, No. 1-3, 1999, pp. 201-206. doi:10.1016/S0003-2670(99)00144-0 [18] F. Fagioli, C. Locatelli, R. Vecchiett and G. Torsi, “Sur- vey of the Diffusion Process in Atomic-Absorption Spec- trometry with the Platform-in-Furnace Technique,” Jour- nal of Analytical Atomic Spectrometry, Vol. 3, No. 1, 1988, pp. 159-162. doi:10.1039/ja9880300159 [19] T. M. Mahmood and K. W. Jackson, “Wall-to-Platform Migration in Electrothermal Atomic Absorption Spec- trometry .1. Investigation of the Mechanism of Chloride Interference on Thallium,” Spectrochimica Acta, Vol. 51B, No. 9-10, 1996, pp. 1155-1162. [20] H. Shimabukuro, T. Ashino and K. Wagatsuma, “Tem- poral Variations in Gas Temperature in an Atomization Stage of Cadmium and Tellurium Evaluated by Using the Two-Line Method in Graphite Furnace Atomic Absor- ption Spectrometry,” Analytical Sciences, Vol. 24, No. 9, 2008, pp. 1165-1170. doi:10.2116/analsci.24.1165 [21] P. W. J. M. Boumans, “Theory of Spectrochemical Exci- tation,” Prenum Press, New York, 1966. [22] T. Ashino, S. Morimoto and K. Wagatsuma, “Role of a Binary Metallic Modifier in the Determination of Cad- mium in Graphite Furnace Atomic Absorption Spectro- metry,” Analytical Sciences, Vol. 26, No. 7, 2010, pp. 809-813. doi:10.2116/analsci.26.809 [23] J. R. Fuhr, G. A. Ma rtin and W. L. Wiese, “Atomi c Tran - sition Probabilities, Iron through Nickel,” Journal Physi- cal and Chemical Reference Data, Vol. 17, Supplement No. 4, 1988, pp. 25-26. [24] M. Hansen, “Constitution of Binary Alloys,” McGraw Hill, New York, 1958, pp. 695, 1094-1095.
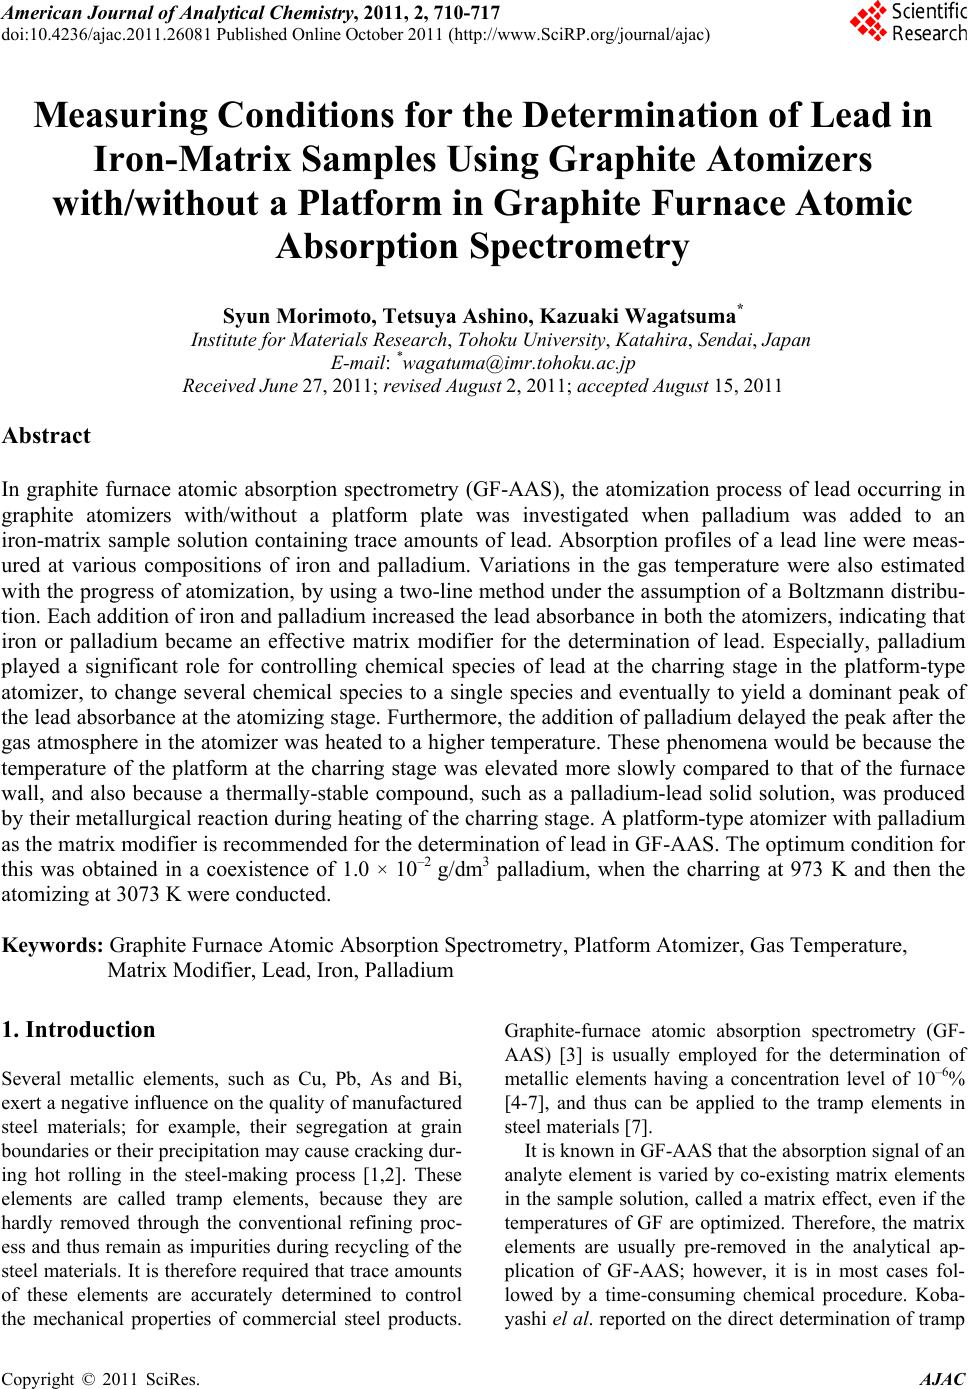
|