 American Journal of Anal yt ical Chemistry, 2011, 2, 697-709 doi:10.4236/ajac.2011.26080 PublishedOnline October 2011 (http://www.SciRP.org/journal/ajac) Copyright © 2011 SciRes. AJAC A New Thioamide Derivative for Separ atio n a nd Preconcentration of Multi Elements in Aquatic Environment by Cloud Point Extraction Mohamed M. Hassanien1,2*, Ali M. Hassan3, Wael I. Mortada4, Ahmed A. El-Asmy5 1Chemistry Department, Industrial Education College, Beni-Suef University, Beni-Suef, Egypt 2Chemistry Department, Faculty of Science, Al-Jouf University, Saudia, Arabia 3Chemistry Department, Faculty of Science, Al-Azhar University, Cairo, Egypt 4Clinical Chemistry Department, Urology and Nephr ol o gy Ce nt er, Mansoura University, Mansoura, Egypt 5Chemistry Department, Faculty of Science, Mansoura University, Mansoura, Egypt E-mail: *mmhassanien2002@yahoo.com Received May 27, 2011; revised July 20, 2011; accepted August 10, 2011 Abstract 2-(pyridine-2-yl)-N-p-chlorohydrazinecarbothioamide (HCPTS) was synthesized, characterized and suc- cessfully applied for the preconcentration of Cu(II), Ni(II), Zn(II), Cd(II), Co(II), Pb(II), Fe(II), and Hg(II) in water, blood, and urine samples prior to graphite furnace atomic absorption determination (GFAAS); Hg was determined by cold vapor technique. Under the optimum experimental conditions (i.e. pH = 8, 10–4 M of HCPTS, 0.05% w/v of Triton X-114), calibration graphs were linear in the range of 0.02 to 200 ng·mL–1 for Co(II), Cd(II), Pb(II) and Ni(II); 0.03 to 200 ng·mL–1 for Cu(II); 0.07 to 200 ng·mL–1 for Fe(II) and Zn(II) and 0.02 to 150 ng·mL–1 for Hg(II). The enrichment factors were 43, 51, 41, 46, 54, 40, 45 and 52 for Cu(II), Ni(II),Zn (II), Cd(II), Co(II), Pb(II), Fe(II), and Hg(II), respectively. The limit of detection were found to be 0.019, 0.094, 0.0514, 0.052, 0.0165, 0.047, 0.068 and 0.041 ng·mL–1 for Cu(II), Ni(II), Zn(II), Cd(II), Co(II), Pb(II), Fe(II), and Hg(II), respectively. The developed method was applied to the determination of these metal ions in water, blood and urine samples with satisfactory results. Keywords: Heavy Metals, Preconcentration, Cloud Point Extraction, 2-(Pyridine-2-Yl)-N-P-Chlorohydrazinecarbothioamide 1. Introduction Heavy metals are of the great importance for the life. Some of these such as Cu, Zn, Co, Fe are essential to humans [1]. Others such as Hg, Cd and Pb are toxic fol- lowing occupational and environmental exposure [2]. Due to the low concentration of these metals in the envi- ronmental and biological samples and interfering effects, a preconcentration/separation technique is generally ne- cessary prior to the determination. For this purpose, various analytical procedures have been used, such as adsorption on activated carbon [3,4] co-precipitation [5,6] column extraction [7,8] ion-selective electrode [9,10] liquid–liquid extraction (LLE) [11] and cloud-point ex- traction (CPE) [12-22]. CPE has attracted considerable attention mainly be- cause it complies with the “Green Chemistry” principle [23], as the amount of organic solvent is much less than that of traditional liquid extraction. Moreover, It is sim- ple, cheap, highly efficient, fast, and of lower toxicity than those extractions that use organic solvents. This method has been applied for extraction and preconcen- tration of some metal ions such as Cu, Ni, Co and Zn in water samples [12], Ag, Zn, and Pb in environmental samples [13], Mo in sea water [14], Cd, Pb, Pd and Ag in environmental samples [15], Cr, Pb, Cu, Ni, Bi, and Cd in environmental samples [16], Cd, Cu, Co and Ni in water [17], U, Th, Zr and Hf in aqueous samples [18], Be in water [19], La, Eu and Lu [20], Rh [21] and Yb, Gd, Eu, Sm, Sc, Ho in biological samples [22]. The cloud point is the temperature above which aque- ous solutions of non-ionic and zwitter ionic surfactants become turbid. Specifically, above the cloud point the solution is separated into two phases: a rich phase con- 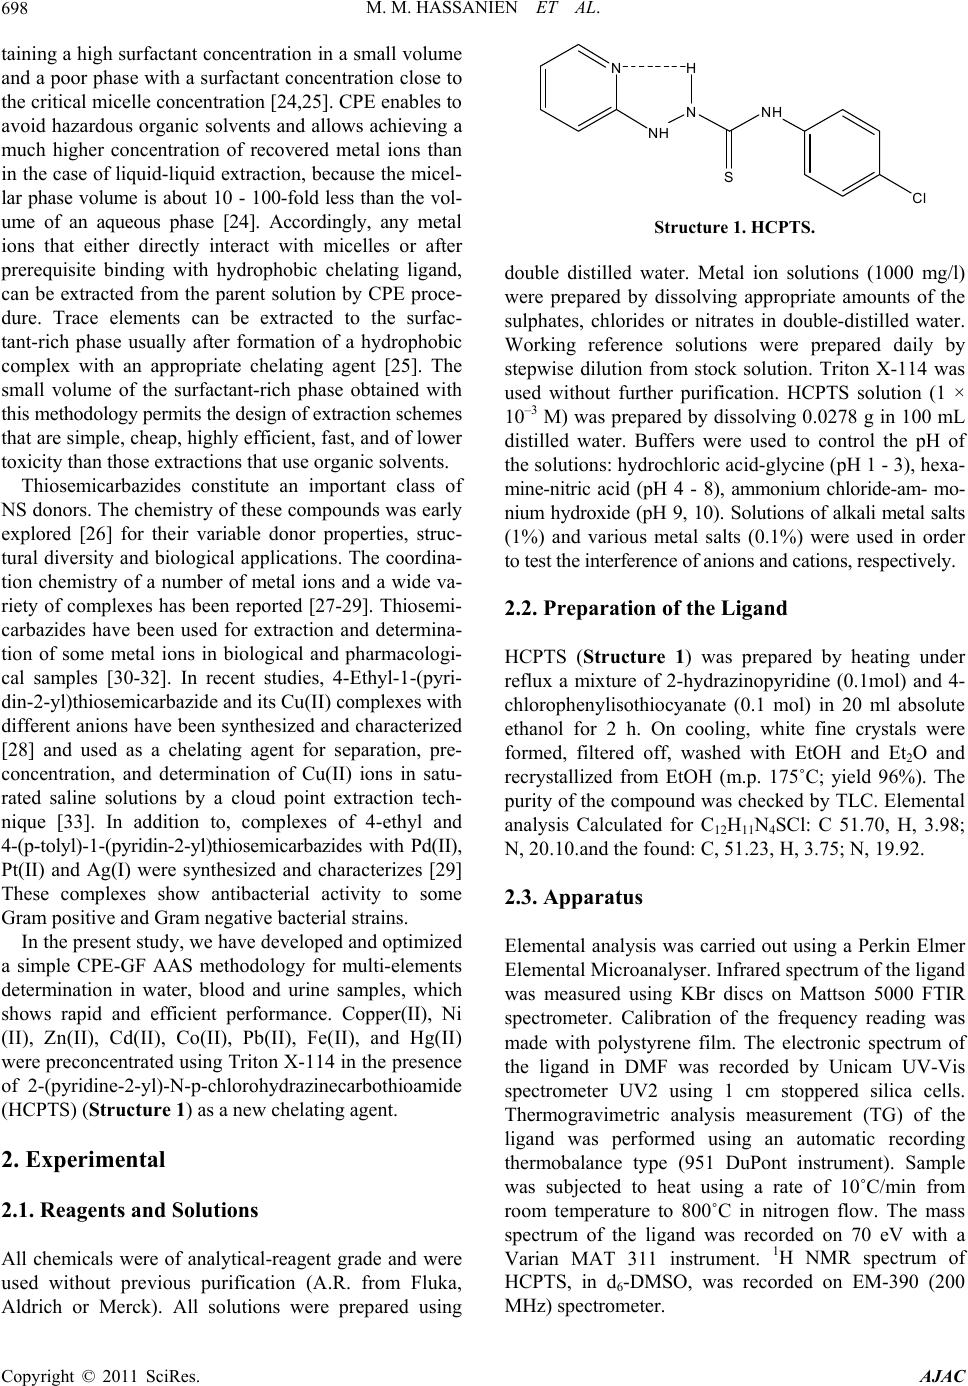 M. M. HASSANIEN ET AL. 698 taining a high surfactant concentration in a small volume and a poor phase with a surfactant concentration close to the critical micelle concentration [24,25]. CPE enables to avoid hazardous organic solvents and allows achieving a much higher concentration of recovered metal ions than in the case of liquid-liquid extraction, because the micel- lar phase volume is about 10 - 100-fold less than the vol- ume of an aqueous phase [24]. Accordingly, any metal ions that either directly interact with micelles or after prerequisite binding with hydrophobic chelating ligand, can be extracted from the parent solution by CPE proce- dure. Trace elements can be extracted to the surfac- tant-rich phase usually after formation of a hydrophobic complex with an appropriate chelating agent [25]. The small volume of the surfactant-rich phase obtained with this methodology permits the design of extraction schemes that are simple, cheap, highly efficient, fast, and of lower toxicity than those extractions that use organic solvents. Thiosemicarbazides constitute an important class of NS donors. The chemistry of these compounds was early explored [26] for their variable donor properties, struc- tural diversity and biological applications. The coordina- tion chemistry of a number of metal ions and a wide va- riety of complexes has been reported [27-29]. Thiosemi- carbazides have been used for extraction and determina- tion of some metal ions in biological and pharmacologi- cal samples [30-32]. In recent studies, 4-Ethyl-1-(pyri- din-2-yl)thiosemicarbazide and its Cu(II) complexes with different anions have been synthesized and characterized [28] and used as a chelating agent for separation, pre- concentration, and determination of Cu(II) ions in satu- rated saline solutions by a cloud point extraction tech- nique [33]. In addition to, complexes of 4-ethyl and 4-(p-tolyl)-1-(pyridin-2-yl)thiosemicarbazides with Pd(II), Pt(II) and Ag(I) were synthesized and characterizes [29] These complexes show antibacterial activity to some Gram positive and Gram negative bacterial strains. In the present study, we have developed and optimized a simple CPE-GF AAS methodology for multi-elements determination in water, blood and urine samples, which shows rapid and efficient performance. Copper(II), Ni (II), Zn(II), Cd(II), Co(II), Pb(II), Fe(II), and Hg(II) were preconcentrated using Triton X-114 in the presence of 2-(pyridine-2-yl)-N-p-chlorohydrazinecarbothioamide (HCPTS) (Structure 1) as a new chelating agent. 2. Experimental 2.1. Reagents and Solutions All chemicals were of analytical-reagent grade and were used without previous purification (A.R. from Fluka, Aldrich or Merck). All solutions were prepared using N NH NNH S Cl H Structure 1. HCPTS. double distilled water. Metal ion solutions (1000 mg/l) were prepared by dissolving appropriate amounts of the sulphates, chlorides or nitrates in double-distilled water. Working reference solutions were prepared daily by stepwise dilution from stock solution. Triton X-114 was used without further purification. HCPTS solution (1 × 10⁻³ M) was prepared by dissolving 0.0278 g in 100 mL distilled water. Buffers were used to control the pH of the solutions: hydrochloric acid-glycine (pH 1 - 3), hexa- mine-nitric acid (pH 4 - 8), ammonium chloride-am- mo- nium hydroxide (pH 9, 10). Solutions of alkali metal salts (1%) and various metal salts (0.1%) were used in order to test the interference of anions and cations, respectively. 2.2. Preparation of the Ligand HCPTS (Structure 1) was prepared by heating under reflux a mixture of 2-hydrazinopyridine (0.1mol) and 4- chlorophenylisothiocyanate (0.1 mol) in 20 ml absolute ethanol for 2 h. On cooling, white fine crystals were formed, filtered off, washed with EtOH and Et2O and recrystallized from EtOH (m.p. 175˚C; yield 96%). The purity of the compound was checked by TLC. Elemental analysis Calculated for C12H11N4SCl: C 51.70, H, 3.98; N, 20.10.and the found: C, 51.23, H, 3.75; N, 19.92. 2.3. Apparatus Elemental analysis was carried out using a Perkin Elmer Elemental Microanalyser. Infrared spectrum of the ligand was measured using KBr discs on Mattson 5000 FTIR spectrometer. Calibration of the frequency reading was made with polystyrene film. The electronic spectrum of the ligand in DMF was recorded by Unicam UV-Vis spectrometer UV2 using 1 cm stoppered silica cells. Thermogravimetric analysis measurement (TG) of the ligand was performed using an automatic recording thermobalance type (951 DuPont instrument). Sample was subjected to heat using a rate of 10˚C/min from room temperature to 800˚C in nitrogen flow. The mass spectrum of the ligand was recorded on 70 eV with a Varian MAT 311 instrument. 1H NMR spectrum of HCPTS, in d6-DMSO, was recorded on EM-390 (200 MHz) spectrometer. Copyright © 2011 SciRes. AJAC 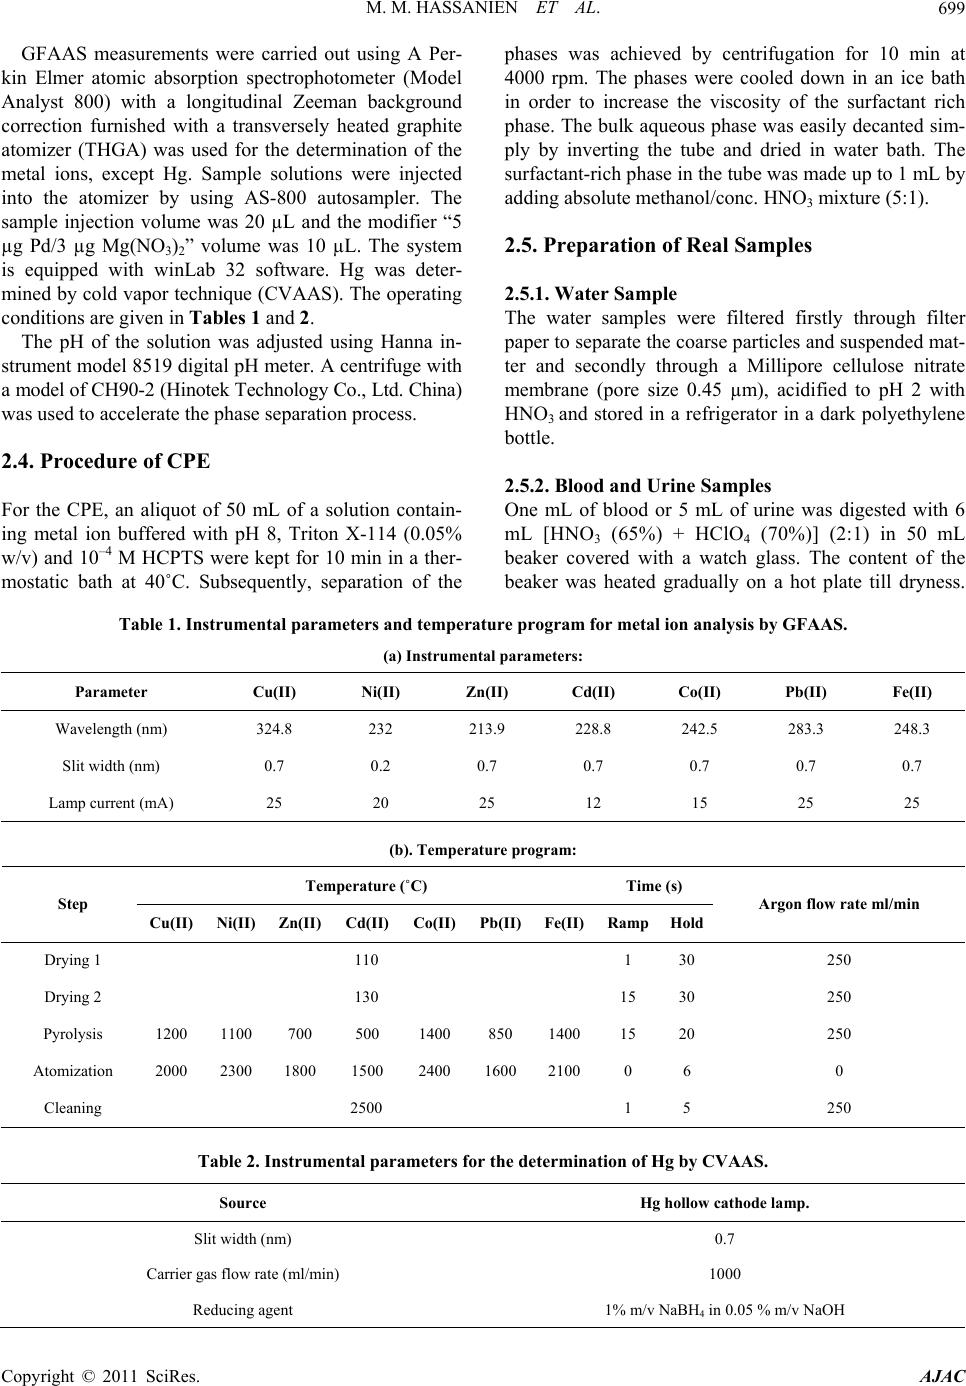 M. M. HASSANIEN ET AL. Copyright © 2011 SciRes. AJAC 699 GFAAS measurements were carried out using A Per- kin Elmer atomic absorption spectrophotometer (Model Analyst 800) with a longitudinal Zeeman background correction furnished with a transversely heated graphite atomizer (THGA) was used for the determination of the metal ions, except Hg. Sample solutions were injected into the atomizer by using AS-800 autosampler. The sample injection volume was 20 µL and the modifier “5 µg Pd/3 µg Mg(NO3)2” volume was 10 µL. The system is equipped with winLab 32 software. Hg was deter- mined by cold vapor technique (CVAAS). The operating conditions are given in Tables 1 and 2. The pH of the solution was adjusted using Hanna in- strument model 8519 digital pH meter. A centrifuge with a model of CH90-2 (Hinotek Technology Co., Ltd. China) was used to accelerate the phase separation process. 2.4. Procedure of CPE For the CPE, an aliquot of 50 mL of a solution contain- ing metal ion buffered with pH 8, Triton X-114 (0.05% w/v) and 10–4 M HCPTS were kept for 10 min in a ther- mostatic bath at 40˚C. Subsequently, separation of the phases was achieved by centrifugation for 10 min at 4000 rpm. The phases were cooled down in an ice bath in order to increase the viscosity of the surfactant rich phase. The bulk aqueous phase was easily decanted sim- ply by inverting the tube and dried in water bath. The surfactant-rich phase in the tube was made up to 1 mL by adding absolute methanol/conc. HNO3 mixture (5:1). 2.5. Preparation of Real Samples 2.5.1. Water S ampl e The water samples were filtered firstly through filter paper to separate the coarse particles and suspended mat- ter and secondly through a Millipore cellulose nitrate membrane (pore size 0.45 µm), acidified to pH 2 with HNO3 and stored in a refrigerator in a dark polyethylene bottle. 2.5.2. Blood a nd Uri ne S am pl es One mL of blood or 5 mL of urine was digested with 6 mL [HNO3 (65%) + HClO4 (70%)] (2:1) in 50 mL beaker covered with a watch glass. The content of the beaker was heated gradually on a hot plate till dryness. Table 1. Instrumental parameters and temperature program for metal ion analysis by GFAAS. (a) Instrumental parameters: Fe(II) Pb(II) Co(II) Cd(II) Zn(II) Ni(II) Cu(II) Parameter 248.3 283.3 242.5 228.8 213.9 232 324.8 Wavelength (nm) 0.7 0.7 0.7 0.7 0.7 0.2 0.7 Slit width (nm) 25 25 15 12 25 20 25 Lamp current (mA) (b). Temperature program: Time (s) Temperature (˚C) Argon flow rate ml/min HoldRampFe(II)Pb(II)Co(II)Cd(II)Zn(II) Ni(II)Cu(II) Step 250 30 1 110 Drying 1 250 30 15 130 Drying 2 250 20 15 1400850 1400 500 700 11001200 Pyrolysis 0 6 0 21001600 2400 1500 1800 23002000 Atomization 250 5 1 2500 Cleaning Table 2. Instrumental parameters for the determination of Hg by CVAAS. Source Hg hollow cathode lamp. Slit width (nm) 0.7 Carrier gas flow rate (ml/min) 1000 Reducing agent 1% m/v NaBH4 in 0.05 % m/v NaOH  M. M. HASSANIEN ET AL. Copyright © 2011 SciRes. AJAC 700 All heating steps were carried out under a hood with necessary precautions. After increasing the pH to about 3 using 1 M NaOH, the volume was completed to 10 mL volumetric flask. Aliquots of 5 mL of the digested sam- ples were analyzed according to the prescribed proce- dure. 3. Result and Discussion 3.1. Characterization of the Ligand (HCPTS) The IR spectrum of HCPTS exhibits characteristic bands at 3262, 3172 and 3131 cm–1 attributed to ν(N4H), ν(N1H) and ν(N2H), respectively [28]. The ν(C=N)Py appearing as a strong band at 1598 cm–1. The appearance of the (C=N)Py and N2H at lower values suggests intramolecu- lar hydrogen bonding [29]. Also, two bands at 1512 and 1450 cm–1 were observed and assigned to thioamide I and III, respectively. Moreover, two sharp bands at 783 and 723 cm–1 were attributed to ν(C=S) and ρ(NH) [28]. The absence of any band due to ν(SH) in the range 2500 - 2600 cm–1 [28] indicated that the ligand exists in the thione form. The absorption spectrum of HCPTS in DMF showed a band at 35,714 cm–1 and three shoulders at 31,250, 24,390 and 23,148 cm–1 attributing to (π→π*)Py, (π→π*)C=S, (n→π*)Py and (n→π*)C=S [29] transitions, respectively. The TGA curve of HEPTS indicates a thermal stability till 167˚C coincident with its melting point (175˚C). The curve showed two decomposition steps. The first from 167 to 219˚C is corresponding to the loss of C5H4N and ClC6H4 (Found 68.2%; Calcd. 68%), the second from 219 to 347 is attributed to the loss of N3H3 (Found 15.9%, Calcd. 16.1%), leaving a residue of C + S (Found 15.9%, Calcd. 15.8%). The 1H NMR spectrum of HCPTS in d6-DMSO sh- owed signals due to the protons of the phenyl and pyri- dine [29]. The three singlet signals at 8.54, 9.79 and 9.91 ppm are attributed to the N2H, N1H and N4H protons, respectively. The N2H signal appears in the aromatic region confirming an intramolecular H-bond. The other NH protons are shifted up field due to the inductive ef- fect of pyridyl and phenyl rings as electron donor groups [29]. The mass spectrum of HCPTS shows the final peak at 280 amu [(C12H11N4SCl), calculated molecular weight 278.76 amu], and other peaks at 171, 111 and 77 amu may correspond to various fragments. The peak described at 171 amu is assigned to the fragment [C7H5NSCl]+, corresponding to the loss of [C5H6N3]+. The peak at 111 is corresponding to the fragment [C6H4Cl]+, correspond- ing to the loss of [CHNS]+ fragment. Peak at 77 repre- sent the fragment C6H4 with the loss of Cl. 3.2. Effect of pH on CPE The formation of metal complexes and its stability are important factors for the CPE. The pH plays a unique role on metal chelate formation and subsequent extrac- tion. The extraction depends on the pH at which complex formation occurs. The effects of the pH on the percent- age extraction recovery of Co(II), Hg(II), Cd(II), Fe(II), Pb(II), Ni(II), Zn(II) and Cu(II) were investigated at dif- ferent pH (1 - 10). Where the percentage extraction re- covery is the percentage of the concentration of metal found in spiked sample to the actual concentration. The results are shown in Figure 1. It was observed that Pb(II) and Cu(II) were extracted quantitatively (>95%) at pH 5; Co(II), Ni(II) and Zn(II) at pH 6; Hg and Fe(II) at pH 7; Cd(II) pH 8. At lower pH values, the extraction is not quantitative, and at higher pH values, the hydrolysis of cations occurs except for Co and Cd(II) a result, pH 8 was chosen as the working pH for the multi determina- tion of these metals. 3.3. Effect of HCPTS Concentration The extraction recoveries of the metals depend on the concentrations of the chelating agent. In order to select the optimum concentrations of HCPTS, the effects of the concentration of the HCPTS on the recoveries were in- vestigated in the range of 1 × 10⁻⁵ to 1.6 × 10⁻⁴ M; the results are shown in Figure 2. For all metals, the maxi- mum recoveries were obtained at 10–4 M of HCPTS. Therefore, these concentrations were selected as the op- timum concentration of the chelating agent. 0246810 20 30 40 50 60 70 80 90 100 110 Co Hg Cd Fe Pb Ni Zn Cu Recovery % pH Figure 1. Influence of the pH on the recovery of extraction for the metal ions. Conditions: 10 ng·mL–1 each metal; 50 mL cold aqueous solution; 10-4 mol·L–1 of the ligand; 0.05% w/v Triton X-114; 40˚C. 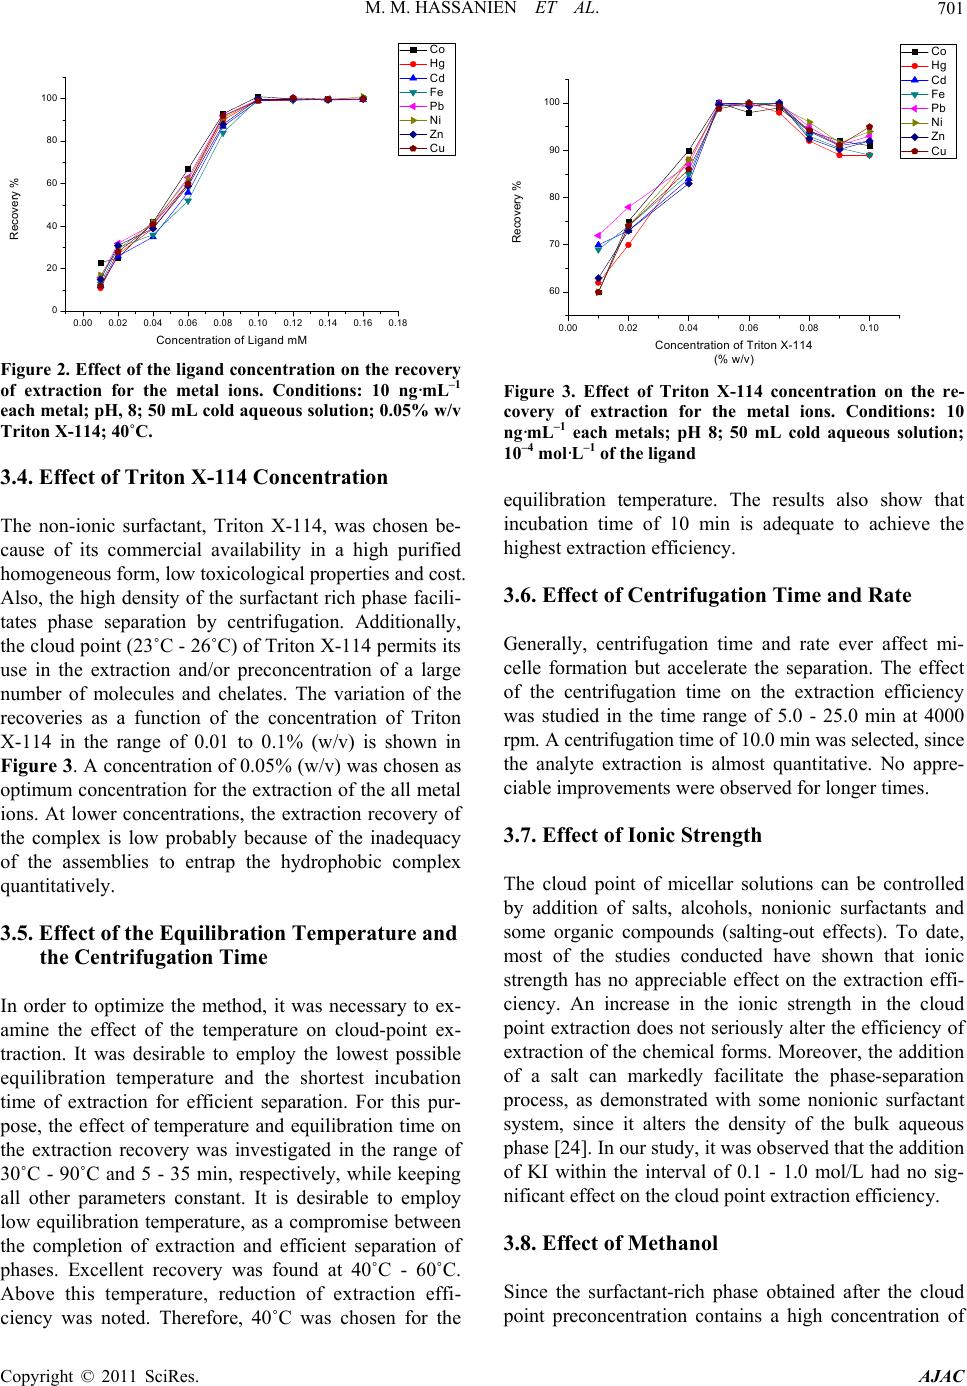 M. M. HASSANIEN ET AL.701 0.00 0.02 0.04 0.06 0.08 0.10 0.12 0.14 0.16 0.18 0 20 40 60 80 100 Co Hg Cd Fe Pb Ni Zn Cu Recovery % Concentration of Li and mM Figure 2. Effect of the ligand concentration on the recovery of extraction for the metal ions. Conditions: 10 ng·mL–1 each metal; pH, 8; 50 mL cold aqueous solution; 0.05% w/v Triton X-114; 40˚C. 3.4. Effect of Triton X-114 Concentration The non-ionic surfactant, Triton X-114, was chosen be- cause of its commercial availability in a high purified homogeneous form, low toxicological properties and cost. Also, the high density of the surfactant rich phase facili- tates phase separation by centrifugation. Additionally, the cloud point (23˚C - 26˚C) of Triton X-114 permits its use in the extraction and/or preconcentration of a large number of molecules and chelates. The variation of the recoveries as a function of the concentration of Triton X-114 in the range of 0.01 to 0.1% (w/v) is shown in Figure 3. A concentration of 0.05% (w/v) was chosen as optimum concentration for the extraction of the all metal ions. At lower concentrations, the extraction recovery of the complex is low probably because of the inadequacy of the assemblies to entrap the hydrophobic complex quantitatively. 3.5. Effect of the Equilibration Temperature and the Centrifugation Time In order to optimize the method, it was necessary to ex- amine the effect of the temperature on cloud-point ex- traction. It was desirable to employ the lowest possible equilibration temperature and the shortest incubation time of extraction for efficient separation. For this pur- pose, the effect of temperature and equilibration time on the extraction recovery was investigated in the range of 30˚C - 90˚C and 5 - 35 min, respectively, while keeping all other parameters constant. It is desirable to employ low equilibration temperature, as a compromise between the completion of extraction and efficient separation of phases. Excellent recovery was found at 40˚C - 60˚C. Above this temperature, reduction of extraction effi- ciency was noted. Therefore, 40˚C was chosen for the 0.00 0.02 0.04 0.06 0.08 0.10 60 70 80 90 100 Co Hg Cd Fe Pb Ni Zn Cu Recovery % Concentration of Triton X-114 (% w/v) Figure 3. Effect of Triton X-114 concentration on the re- covery of extraction for the metal ions. Conditions: 10 ng·mL–1 each metals; pH 8; 50 mL cold aqueous solution; 10–4 mol·L–1 of the ligand equilibration temperature. The results also show that incubation time of 10 min is adequate to achieve the highest extraction efficiency. 3.6. Effect of Centrifugation Time and Rate Generally, centrifugation time and rate ever affect mi- celle formation but accelerate the separation. The effect of the centrifugation time on the extraction efficiency was studied in the time range of 5.0 - 25.0 min at 4000 rpm. A centrifugation time of 10.0 min was selected, since the analyte extraction is almost quantitative. No appre- ciable improvements were observed for longer times. 3.7. Effect of Ionic Strength The cloud point of micellar solutions can be controlled by addition of salts, alcohols, nonionic surfactants and some organic compounds (salting-out effects). To date, most of the studies conducted have shown that ionic strength has no appreciable effect on the extraction effi- ciency. An increase in the ionic strength in the cloud point extraction does not seriously alter the efficiency of extraction of the chemical forms. Moreover, the addition of a salt can markedly facilitate the phase-separation process, as demonstrated with some nonionic surfactant system, since it alters the density of the bulk aqueous phase [24]. In our study, it was observed that the addition of KI within the interval of 0.1 - 1.0 mol/L had no sig- nificant effect on the cloud point extraction efficiency. 3.8. Effect of Methanol Since the surfactant-rich phase obtained after the cloud point preconcentration contains a high concentration of Copyright © 2011 SciRes. AJAC 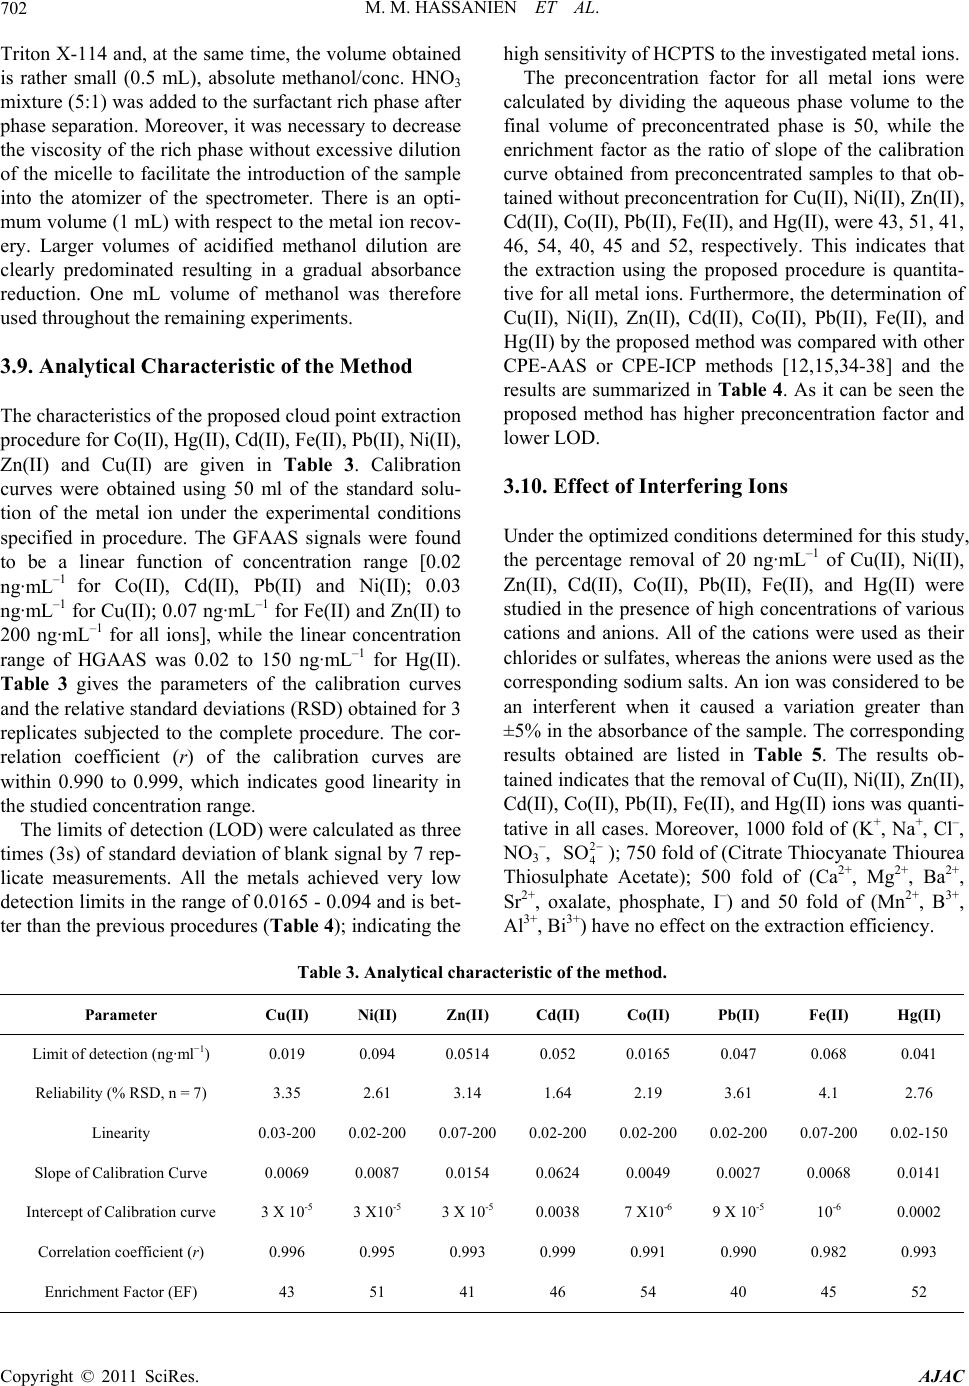 M. M. HASSANIEN ET AL. Copyright © 2011 SciRes. AJAC 702 Triton X-114 and, at the same time, the volume obtained is rather small (0.5 mL), absolute methanol/conc. HNO3 mixture (5:1) was added to the surfactant rich phase after phase separation. Moreover, it was necessary to decrease the viscosity of the rich phase without excessive dilution of the micelle to facilitate the introduction of the sample into the atomizer of the spectrometer. There is an opti- mum volume (1 mL) with respect to the metal ion recov- ery. Larger volumes of acidified methanol dilution are clearly predominated resulting in a gradual absorbance reduction. One mL volume of methanol was therefore used throughout the remaining experiments. 3.9. Analytical Characteristic of the Method The characteristics of the proposed cloud point extraction procedure for Co(II), Hg(II), Cd(II), Fe(II), Pb(II), Ni(II), Zn(II) and Cu(II) are given in Table 3. Calibration curves were obtained using 50 ml of the standard solu- tion of the metal ion under the experimental conditions specified in procedure. The GFAAS signals were found to be a linear function of concentration range [0.02 ng·mL–1 for Co(II), Cd(II), Pb(II) and Ni(II); 0.03 ng·mL–1 for Cu(II); 0.07 ng·mL–1 for Fe(II) and Zn(II) to 200 ng·mL–1 for all ions], while the linear concentration range of HGAAS was 0.02 to 150 ng·mL–1 for Hg(II). Table 3 gives the parameters of the calibration curves and the relative standard deviations (RSD) obtained for 3 replicates subjected to the complete procedure. The cor- relation coefficient (r) of the calibration curves are within 0.990 to 0.999, which indicates good linearity in the studied concentration range. The limits of detection (LOD) were calculated as three times (3s) of standard deviation of blank signal by 7 rep- licate measurements. All the metals achieved very low detection limits in the range of 0.0165 - 0.094 and is bet- ter than the previous procedures (Tabl e 4 ); indicating the high sensitivity of HCPTS to the investigated metal ions. The preconcentration factor for all metal ions were calculated by dividing the aqueous phase volume to the final volume of preconcentrated phase is 50, while the enrichment factor as the ratio of slope of the calibration curve obtained from preconcentrated samples to that ob- tained without preconcentration for Cu(II), Ni(II), Zn(II), Cd(II), Co(II), Pb(II), Fe(II), and Hg(II), were 43, 51, 41, 46, 54, 40, 45 and 52, respectively. This indicates that the extraction using the proposed procedure is quantita- tive for all metal ions. Furthermore, the determination of Cu(II), Ni(II), Zn(II), Cd(II), Co(II), Pb(II), Fe(II), and Hg(II) by the proposed method was compared with other CPE-AAS or CPE-ICP methods [12,15,34-38] and the results are summarized in Table 4 . As it can be seen the proposed method has higher preconcentration factor and lower LOD. 3.10. Effect of Interfering Ions Under the optimized conditions determined for this study, the percentage removal of 20 ng·mL–1 of Cu(II), Ni(II), Zn(II), Cd(II), Co(II), Pb(II), Fe(II), and Hg(II) were studied in the presence of high concentrations of various cations and anions. All of the cations were used as their chlorides or sulfates, whereas the anions were used as the corresponding sodium salts. An ion was considered to be an interferent when it caused a variation greater than ±5% in the absorbance of the sample. The corresponding results obtained are listed in Table 5. The results ob- tained indicates that the removal of Cu(II), Ni(II), Zn(II), Cd(II), Co(II), Pb(II), Fe(II), and Hg(II) ions was quanti- tative in all cases. Moreover, 1000 fold of (K+, Na+, Cl–, NO3 –, 2 4 SO ); 750 fold of (Citrate Thiocyanate Thiourea Thiosulphate Acetate); 500 fold of (Ca2+, Mg2+, Ba2+, Sr2+, oxalate, phosphate, I–) and 50 fold of (Mn2+, B3+, Al3+, Bi3+) have no effect on the extraction efficiency. Table 3. Analytical characteristic of the method. Hg(II) Fe(II) Pb(II) Co(II) Cd(II) Zn(II) Ni(II) Cu(II) Parameter 0.041 0.068 0.047 0.0165 0.052 0.0514 0.094 0.019 Limit of detection (ng·ml−1) 2.76 4.1 3.61 2.19 1.64 3.14 2.61 3.35 Reliability (% RSD, n = 7) 0.02-150 0.07-200 0.02-200 0.02-200 0.02-200 0.07-200 0.02-200 0.03-200 Linearity 0.0141 0.0068 0.0027 0.0049 0.0624 0.0154 0.0087 0.0069 Slope of Calibration Curve 0.0002 10-6 9 X 10⁻⁵ 7 X10⁻⁶ 0.0038 3 X 10⁻⁵ 3 X10⁻⁵ 3 X 10⁻⁵ Intercept of Calibration curve 0.993 0.982 0.990 0.991 0.999 0.993 0.995 0.996 Correlation coefficient (r) 52 45 40 54 46 41 51 43 Enrichment Factor (EF) 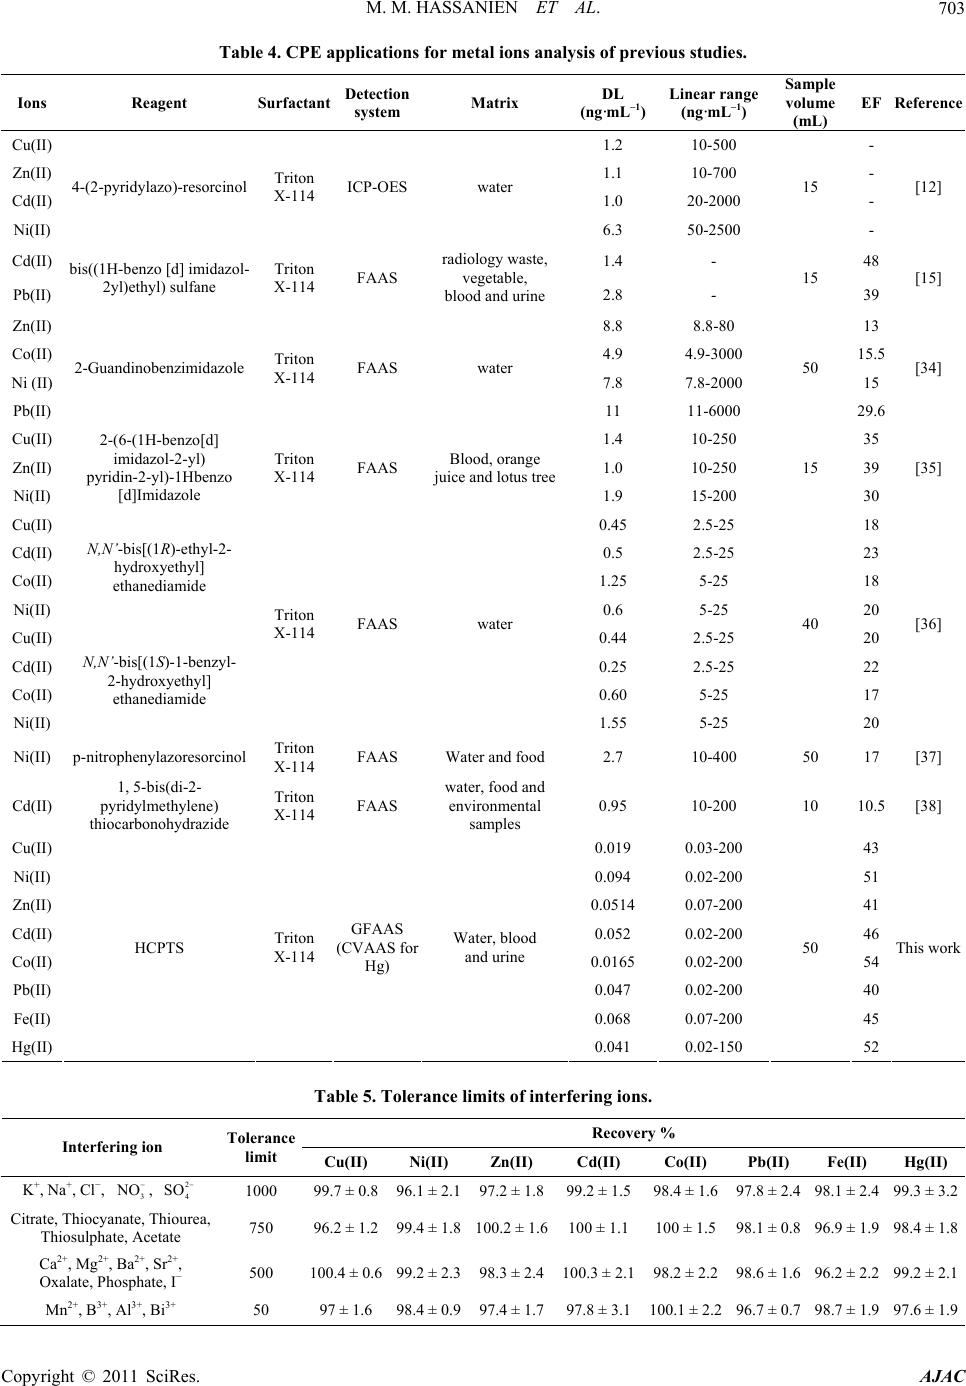 M. M. HASSANIEN ET AL.703 Table 4. CPE applications for metal ions analysis of previous studies. Ions Reagent Surfactant Detection system Matrix DL (ng·mL–1)Linear range (ng·mL–1) Sample volume (mL) EF Reference Cu(II) 1.2 10-500 - Zn(II) 1.1 10-700 - Cd(II) 1.0 20-2000 - Ni(II) 4-(2-pyridylazo)-resorcinol Triton X-114 ICP-OESwater 6.3 50-2500 15 - [12] Cd(II) 1.4 - 48 Pb(II) bis((1H-benzo [d] imidazol- 2yl)ethyl) sulfane Triton X-114 FAAS radiology waste, vegetable, blood and urine 2.8 - 15 39 [15] Zn(II) 8.8 8.8-80 13 Co(II) 4.9 4.9-3000 15.5 Ni (II) 7.8 7.8-2000 15 Pb(II) 2-Guandinobenzimidazole Triton X-114 FAAS water 11 11-6000 50 29.6 [34] Cu(II) 1.4 10-250 35 Zn(II) 1.0 10-250 39 Ni(II) 2-(6-(1H-benzo[d] imidazol-2-yl) pyridin-2-yl)-1Hbenzo [d]Imidazole Triton X-114 FAAS Blood, orange juice and lotus tree 1.9 15-200 15 30 [35] Cu(II) 0.45 2.5-25 18 Cd(II) 0.5 2.5-25 23 Co(II) 1.25 5-25 18 Ni(II) N,N’-bis[(1R)-ethyl-2- hydroxyethyl] ethanediamide 0.6 5-25 20 Cu(II) 0.44 2.5-25 20 Cd(II) 0.25 2.5-25 22 Co(II) 0.60 5-25 17 Ni(II) N,N’-bis[(1S)-1-benzyl- 2-hydroxyethyl] ethanediamide Triton X-114 FAAS water 1.55 5-25 40 20 [36] Ni(II) p-nitrophenylazoresorcinolTriton X-114 FAAS Water and food 2.7 10-400 50 17[37] Cd(II) 1, 5-bis(di-2- pyridylmethylene) thiocarbonohydrazide Triton X-114 FAAS water, food and environmental samples 0.95 10-200 10 10.5[38] Cu(II) 0.019 0.03-200 43 Ni(II) 0.094 0.02-200 51 Zn(II) 0.0514 0.07-200 41 Cd(II) 0.052 0.02-200 46 Co(II) 0.0165 0.02-200 54 Pb(II) 0.047 0.02-200 40 Fe(II) 0.068 0.07-200 45 Hg(II) HCPTS Triton X-114 GFAAS (CVAAS for Hg) Water, blood and urine 0.041 0.02-150 50 52 This work Table 5. Tolerance limits of interfering ions. Recovery % Interfering ion Tolerance limit Cu(II) Ni(II) Zn(II) Cd(II) Co(II) Pb(II) Fe(II) Hg(II) K+, Na+, Cl−, , 3 NO2 4 SO 1000 99.7 ± 0.8 96.1 ± 2.197.2 ± 1.899.2 ± 1.598.4 ± 1.697.8 ± 2.4 98.1 ± 2.499.3 ± 3.2 Citrate, Thiocyanate, Thiourea, Thiosulphate, Acetate 750 96.2 ± 1.2 99.4 ± 1.8100.2 ± 1.6100 ± 1.1100 ± 1.598.1 ± 0.8 96.9 ± 1.998.4 ± 1.8 Ca2+, Mg2+, Ba2+, Sr2+, Oxalate, Phosphate, I− 500 100.4 ± 0.699.2 ± 2.398.3 ± 2.4100.3 ± 2.198.2 ± 2.298.6 ± 1.6 96.2 ± 2.299.2 ± 2.1 Mn2+, B3+, Al3+, Bi3+ 50 97 ± 1.6 98.4 ± 0.997.4 ± 1.797.8 ± 3.1100.1 ± 2.296.7 ± 0.7 98.7 ± 1.997.6 ± 1.9 Copyright © 2011 SciRes. AJAC  M. M. HASSANIEN ET AL. 704 Table 6. Recovery of trace metal ions from spiked real samples after application of presented procedure. Sample Ion Added (ng·mL–1) Found (ng·mL–1) Recovery % - 2.1 Cu 1.0 3.15 105 - 1.09 Ni 1.0 2.04 95 - 0.54 Zn 1.0 1.51 97 - 0.12 Cd 1.0 1.08 96 - 0.29 Co 1.0 1.32 103 - 1.7 Pb 1.0 2.66 96 - 32.6 Fe 10.0 43.1 105 - 0.2 Tap Water Hg 1.0 1.16 96 - 924 Cu 100 1027 103 - 0.84 Ni 1.0 1.86 102 - 5,579 Zn 1000 6591 101 - 0.92 Cd 1.0 1.90 98 - 0.12 Co 1.0 1.11 99 - 55.6 Pb 10.0 65.8 102 - 556 Fe 100 660 104 - 2.43 Blood Hg 1.0 3.44 101 - 34.8 Cu 10.0 45.1 103 - 2.45 Ni 1.0 3.46 101 - 375 Zn 100 478 103 - 0.84 Cd 1.0 1.85 101 - 1.21 Co 1.0 2.20 99 - 9.6 Pb 10.0 19.8 102 - 152 Fe 100 255 103 - 2.13 Urine Hg 1.0 3.15 102 Copyright © 2011 SciRes. AJAC 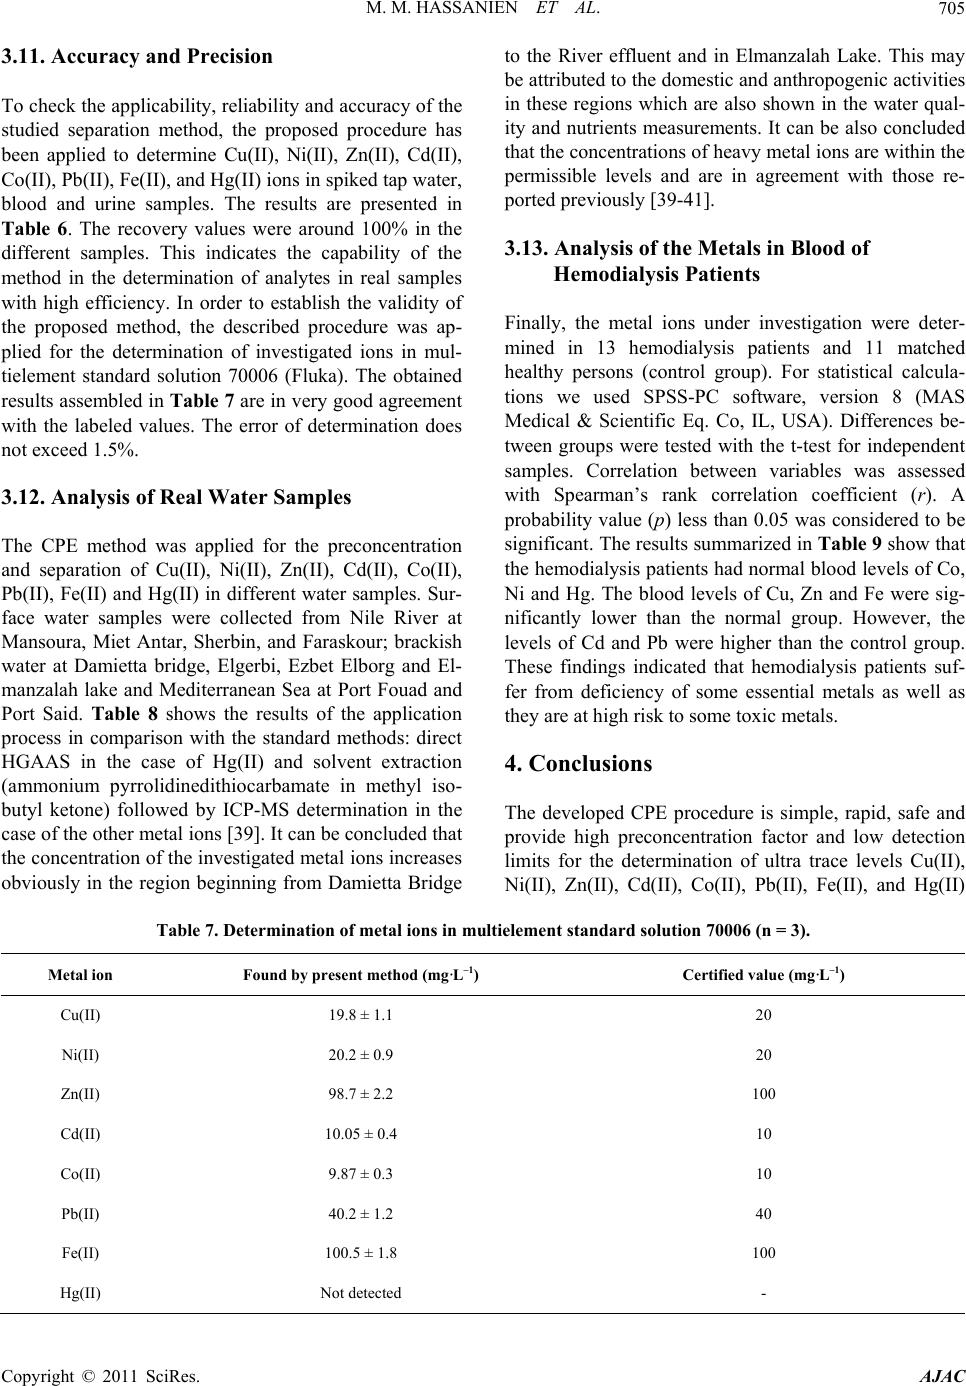 M. M. HASSANIEN ET AL. Copyright © 2011 SciRes. AJAC 705 3.11. Accuracy and Precision To check the applicability, reliability and accuracy of the studied separation method, the proposed procedure has been applied to determine Cu(II), Ni(II), Zn(II), Cd(II), Co(II), Pb(II), Fe(II), and Hg(II) ions in spiked tap water, blood and urine samples. The results are presented in Table 6. The recovery values were around 100% in the different samples. This indicates the capability of the method in the determination of analytes in real samples with high efficiency. In order to establish the validity of the proposed method, the described procedure was ap- plied for the determination of investigated ions in mul- tielement standard solution 70006 (Fluka). The obtained results assembled in Table 7 are in very good agreement with the labeled values. The error of determination does not exceed 1.5%. 3.12. Analysis of Real Water Samples The CPE method was applied for the preconcentration and separation of Cu(II), Ni(II), Zn(II), Cd(II), Co(II), Pb(II), Fe(II) and Hg(II) in different water samples. Sur- face water samples were collected from Nile River at Mansoura, Miet Antar, Sherbin, and Faraskour; brackish water at Damietta bridge, Elgerbi, Ezbet Elborg and El- manzalah lake and Mediterranean Sea at Port Fouad and Port Said. Table 8 shows the results of the application process in comparison with the standard methods: direct HGAAS in the case of Hg(II) and solvent extraction (ammonium pyrrolidinedithiocarbamate in methyl iso- butyl ketone) followed by ICP-MS determination in the case of the other metal ions [39]. It can be concluded that the concentration of the investigated metal ions increases obviously in the region beginning from Damietta Bridge to the River effluent and in Elmanzalah Lake. This may be attributed to the domestic and anthropogenic activities in these regions which are also shown in the water qual- ity and nutrients measurements. It can be also concluded that the concentrations of heavy metal ions are within the permissible levels and are in agreement with those re- ported previously [39-41]. 3.13. Analysis of the Metals in Blood of Hemodialysis Patients Finally, the metal ions under investigation were deter- mined in 13 hemodialysis patients and 11 matched healthy persons (control group). For statistical calcula- tions we used SPSS-PC software, version 8 (MAS Medical & Scientific Eq. Co, IL, USA). Differences be- tween groups were tested with the t-test for independent samples. Correlation between variables was assessed with Spearman’s rank correlation coefficient (r). A probability value (p) less than 0.05 was considered to be significant. The results summarized in Table 9 show that the hemodialysis patients had normal blood levels of Co, Ni and Hg. The blood levels of Cu, Zn and Fe were sig- nificantly lower than the normal group. However, the levels of Cd and Pb were higher than the control group. These findings indicated that hemodialysis patients suf- fer from deficiency of some essential metals as well as they are at high risk to some toxic metals. 4. Conclusions The developed CPE procedure is simple, rapid, safe and provide high preconcentration factor and low detection limits for the determination of ultra trace levels Cu(II), Ni(II), Zn(II), Cd(II), Co(II), Pb(II), Fe(II), and Hg(II) Table 7. Determination of metal ions in multielement standard solution 70006 (n = 3). Metal ion Found by present method (mg·L–1) Certified value (mg·L–1) Cu(II) 19.8 ± 1.1 20 Ni(II) 20.2 ± 0.9 20 Zn(II) 98.7 ± 2.2 100 Cd(II) 10.05 ± 0.4 10 Co(II) 9.87 ± 0.3 10 Pb(II) 40.2 ± 1.2 40 Fe(II) 100.5 ± 1.8 100 Hg(II) Not detected - 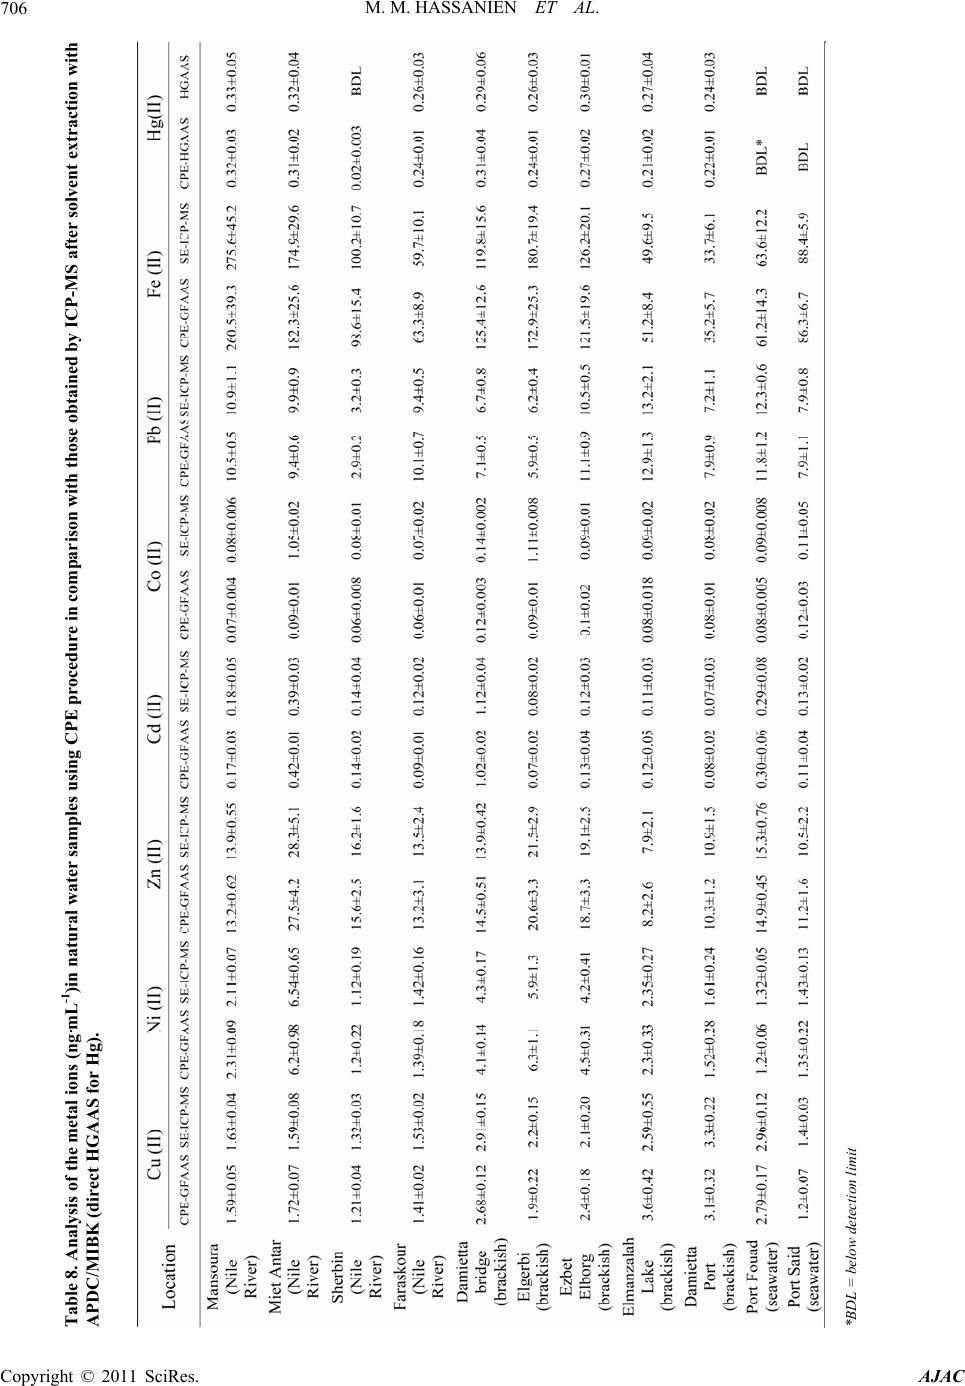 M. M. HASSANIEN ET AL. 706 Table 8. Analysis of the metal ions (ng·mL-1)in natural water samples using CPE procedure in comparison with those obtained by ICP-MS after solvent extraction with APDC/MIBK (direct HGAAS for Hg). *BDL = below detection limit Copyright © 2011 SciRes. AJAC 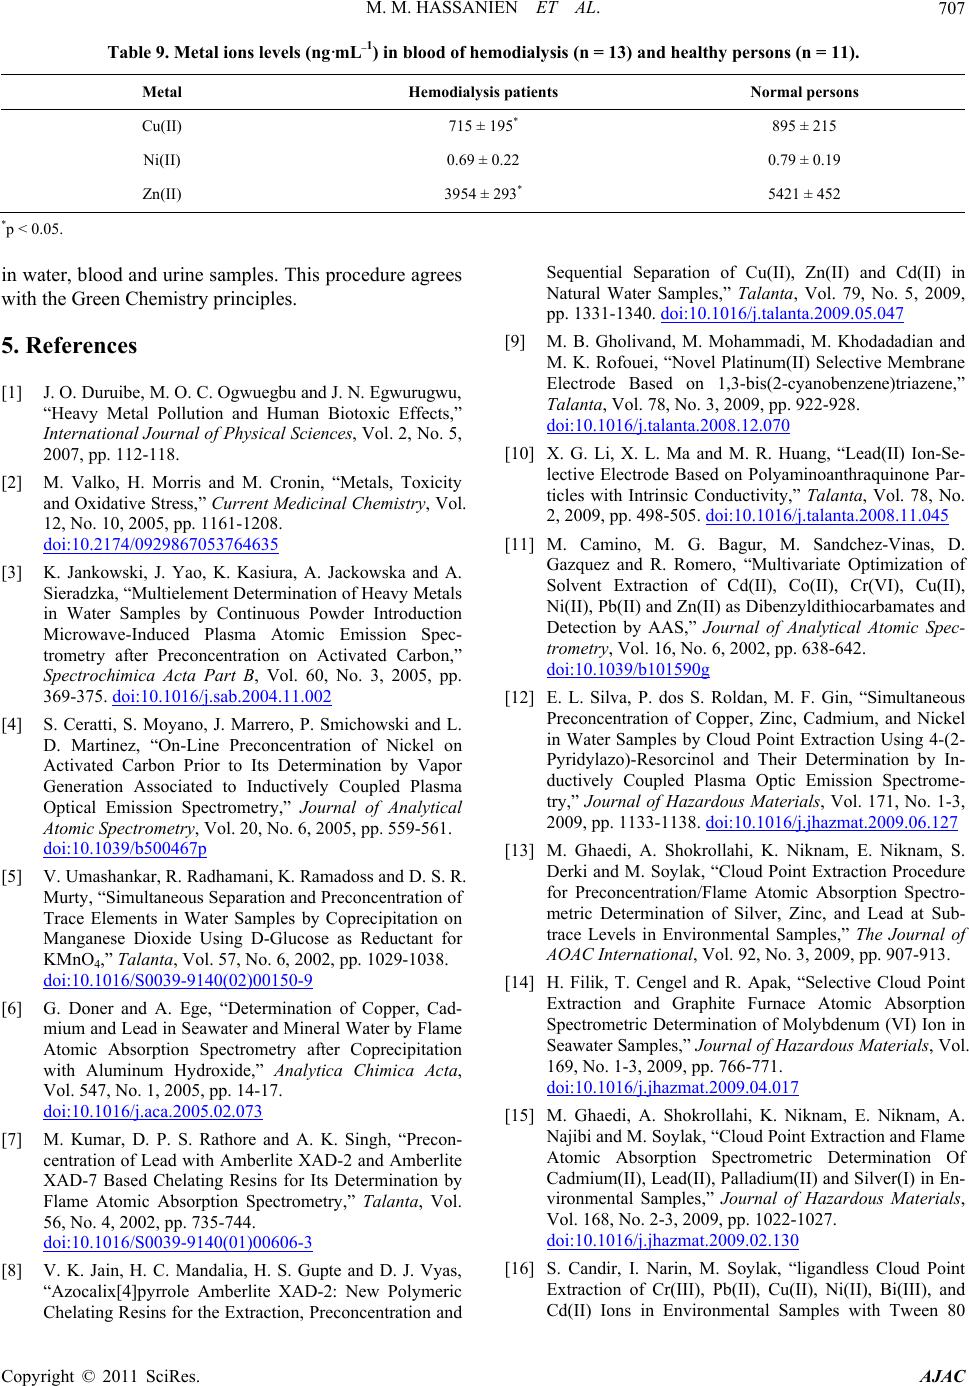 M. M. HASSANIEN ET AL. Copyright © 2011 SciRes. AJAC 707 Table 9. Metal ions levels (ng·mL–1) in blood of hemodialysis (n = 13) and healthy persons (n = 11). Metal Hemodialysis patients Normal persons Cu(II) 715 ± 195* 895 ± 215 Ni(II) 0.69 ± 0.22 0.79 ± 0.19 Zn(II) 3954 ± 293* 5421 ± 452 *p < 0.05. in water, blood and urine samples. This procedure agrees with the Green Chemistry principles. 5. References [1] J. O. Duruibe, M. O. C. Ogwuegbu and J. N. Egwurugwu, “Heavy Metal Pollution and Human Biotoxic Effects,” International Journal of Physical Sciences, Vol. 2, No. 5, 2007, pp. 112-118. [2] M. Valko, H. Morris and M. Cronin, “Metals, Toxicity and Oxidative Stress,” Current Medicinal Chemistry, Vol. 12, No. 10, 2005, pp. 1161-1208. doi:10.2174/0929867053764635 [3] K. Jankowski, J. Yao, K. Kasiura, A. Jackowska and A. Sieradzka, “Multielement Determination of Heavy Metals in Water Samples by Continuous Powder Introduction Microwave-Induced Plasma Atomic Emission Spec- trometry after Preconcentration on Activated Carbon,” Spectrochimica Acta Part B, Vol. 60, No. 3, 2005, pp. 369-375. doi:10.1016/j.sab.2004.11.002 [4] S. Ceratti, S. Moyano, J. Marrero, P. Smichowski and L. D. Martinez, “On-Line Preconcentration of Nickel on Activated Carbon Prior to Its Determination by Vapor Generation Associated to Inductively Coupled Plasma Optical Emission Spectrometry,” Journal of Analytical Atomic Spectrometry, Vol. 20, No. 6, 2005, pp. 559-561. doi:10.1039/b500467p [5] V. Umashankar, R. Radhamani, K. Ramadoss and D. S. R. Murty, “Simultaneous Separation and Preconcentration of Trace Elements in Water Samples by Coprecipitation on Manganese Dioxide Using D-Glucose as Reductant for KMnO4,” Talanta, Vol. 57, No. 6, 2002, pp. 1029-1038. doi:10.1016/S0039-9140(02)00150-9 [6] G. Doner and A. Ege, “Determination of Copper, Cad- mium and Lead in Seawater and Mineral Water by Flame Atomic Absorption Spectrometry after Coprecipitation with Aluminum Hydroxide,” Analytica Chimica Acta, Vol. 547, No. 1, 2005, pp. 14-17. doi:10.1016/j.aca.2005.02.073 [7] M. Kumar, D. P. S. Rathore and A. K. Singh, “Precon- centration of Lead with Amberlite XAD-2 and Amberlite XAD-7 Based Chelating Resins for Its Determination by Flame Atomic Absorption Spectrometry,” Talanta, Vol. 56, No. 4, 2002, pp. 735-744. doi:10.1016/S0039-9140(01)00606-3 [8] V. K. Jain, H. C. Mandalia, H. S. Gupte and D. J. Vyas, “Azocalix[4]pyrrole Amberlite XAD-2: New Polymeric Chelating Resins for the Extraction, Preconcentration and Sequential Separation of Cu(II), Zn(II) and Cd(II) in Natural Water Samples,” Talanta, Vol. 79, No. 5, 2009, pp. 1331-1340. doi:10.1016/j.talanta.2009.05.047 [9] M. B. Gholivand, M. Mohammadi, M. Khodadadian and M. K. Rofouei, “Novel Platinum(II) Selective Membrane Electrode Based on 1,3-bis(2-cyanobenzene)triazene,” Talanta, Vol. 78, No. 3, 2009, pp. 922-928. doi:10.1016/j.talanta.2008.12.070 [10] X. G. Li, X. L. Ma and M. R. Huang, “Lead(II) Ion-Se- lective Electrode Based on Polyaminoanthraquinone Par- ticles with Intrinsic Conductivity,” Talanta, Vol. 78, No. 2, 2009, pp. 498-505. doi:10.1016/j.talanta.2008.11.045 [11] M. Camino, M. G. Bagur, M. Sandchez-Vinas, D. Gazquez and R. Romero, “Multivariate Optimization of Solvent Extraction of Cd(II), Co(II), Cr(VI), Cu(II), Ni(II), Pb(II) and Zn(II) as Dibenzyldithiocarbamates and Detection by AAS,” Journal of Analytical Atomic Spec- trometry, Vol. 16, No. 6, 2002, pp. 638-642. doi:10.1039/b101590g [12] E. L. Silva, P. dos S. Roldan, M. F. Gin, “Simultaneous Preconcentration of Copper, Zinc, Cadmium, and Nickel in Water Samples by Cloud Point Extraction Using 4-(2- Pyridylazo)-Resorcinol and Their Determination by In- ductively Coupled Plasma Optic Emission Spectrome- try,” Journal of Hazardous Materials, Vol. 171, No. 1-3, 2009, pp. 1133-1138. doi:10.1016/j.jhazmat.2009.06.127 [13] M. Ghaedi, A. Shokrollahi, K. Niknam, E. Niknam, S. Derki and M. Soylak, “Cloud Point Extraction Procedure for Preconcentration/Flame Atomic Absorption Spectro- metric Determination of Silver, Zinc, and Lead at Sub- trace Levels in Environmental Samples,” The Journal of AOAC International, Vol. 92, No. 3, 2009, pp. 907-913. [14] H. Filik, T. Cengel and R. Apak, “Selective Cloud Point Extraction and Graphite Furnace Atomic Absorption Spectrometric Determination of Molybdenum (VI) Ion in Seawater Samples,” Journal of Hazardous Materials, Vol. 169, No. 1-3, 2009, pp. 766-771. doi:10.1016/j.jhazmat.2009.04.017 [15] M. Ghaedi, A. Shokrollahi, K. Niknam, E. Niknam, A. Najibi and M. Soylak, “Cloud Point Extraction and Flame Atomic Absorption Spectrometric Determination Of Cadmium(II), Lead(II), Palladium(II) and Silver(I) in En- vironmental Samples,” Journal of Hazardous Materials, Vol. 168, No. 2-3, 2009, pp. 1022-1027. doi:10.1016/j.jhazmat.2009.02.130 [16] S. Candir, I. Narin, M. Soylak, “ligandless Cloud Point Extraction of Cr(III), Pb(II), Cu(II), Ni(II), Bi(III), and Cd(II) Ions in Environmental Samples with Tween 80  M. M. HASSANIEN ET AL. 708 and Flame Atomic Absorption Spectrometric Determina- tion,” Talanta, Vol. 77, No. 1, 2008, pp. 289-293. doi:10.1016/j.talanta.2008.06.024 [17] E. Kilinc, A. Cetin, M. Togrul and H. Hosgoren, “Syn- thesis of Bis(Amino Alcohol)Oxalamides and Their Us- age for the Preconcentration of Trace Metals by Cloud Point Extraction,” Analytical Sciences, Vol. 24, No. 6, 2008, pp. 763-768. doi:10.2116/analsci.24.763 [18] S. Shariati, Y. Yamini and M. K. Zanjani, “Simultaneous Preconcentration and Determination of U(VI), Th(IV), Zr(IV) and Hf(IV) Ions in Aqueous Samples Using Mi- celle-Mediated Extraction Coupled to Inductively Cou- pled Plasma-Optical Emission Spectrometry,” Journal of Hazardous Materials, Vol. 156, No. 1-3, 2008, pp 583- 590. doi:10.1016/j.jhazmat.2007.12.061 [19] A. Beiraghi and S. Babaee, “Separation and Preconcen- tration of Ultra Trace Amounts of Beryllium in Water Samples Using Mixed Micelle-Mediated Extraction and Determination by Inductively Coupled Plasma-Atomic Emission Spectrometry,” Analatica Chimica Acta, Vol. 607, No. 2, 2008, pp. 183-190. doi:10.1016/j.aca.2007.11.028 [20] A. Ohashi, T. Hashimoto, H. Imura and K. Ohashi, “Cloud Point Extraction Equilibrium of Lanthanum(III), Europium(III) and Lutetium(III) Using Di(2-Ethylhexyl) Phosphoric Acid and Triton X-100,” Talanta, Vol. 73, No. 5, 2007, pp. 893-898. doi:10.1016/j.talanta.2007.05.012 [21] N. Shokoufi and F. Shemirani, “Laser Induced-Thermal Lens Spectrometry after Cloud Point Extraction for the Determination of Trace Amounts of Rhodium,” Talanta, Vol. 73, No. 4, 2007, pp. 662-667. doi:10.1016/j.talanta.2007.04.035 [22] Y. Li and B. Hu, “Cloud Point Extraction with/without Chelating Agent on-Line Coupled with Inductively Cou- pled Plasma Optical Emission Spectrometry for the De- termination of Trace Rare Earth Elements in Biological Samples,” Journal of Hazardous Materials, Vol. 174, No. 1-3, 2010, pp. 534-540. doi:10.1016/j.jhazmat.2009.09.084 [23] P. Anastas and N. Eghbali, “Green Chemistry: Principles and Practice,” Chemical Society Reviews, Vol. 39, No. 1, 2010, pp. 301-312. doi:10.1039/b918763b [24] C. B. Ojeda and F. S. Rojas, “Separation and Preconcen- tration by a Cloud Point Extraction Procedure for Deter- mination of Metals: An Overview,” Analytical and Bio- analytical Chemistry, Vol. 394, No. 3, 2009, pp. 759-782. doi:10.1007/s00216-009-2660-9 [25] F. H. Quina and W. L. Hinze, “Surfactant-Mediated Cloud Point Extractions: An Environmentally Benign Alternative Separation Approach,” Industrial & Engineer- ing Chemistry Research, Vol. 38, No. 11, 1999, pp. 4150- 4168. doi:10.1021/ie980389n [26] B. A. Gingras, R. L. Somorjai and C. H. Bayley, “The Preparation of Some Thiosemicarbazones and Their Copper Complexes,” Canadian Journal of Chemistry, Vol. 39, No. 5, 1961, pp. 973-985. doi:10.1139/v61-122 [27] A. A. Abu-Hussen and W. Linert, “Redox, Thermody- namic and Spectroscopic of Some Transition Metal Complexes Containing Heterocyclic Schiff Base Ligands,” Spectrochimica Acta A Molecular and Bio- molecular Spectroscopy, Vol. 74, No. 1, 2009, pp. 214- 223. [28] M. M. Hassanien, I. M. Gabr, M. H. Abdel-Rhman and A. A. El-Asmy, “Synthesis and Structural Investigation of Monoand Polynuclear Copper Complexes of 4-Ethyl-1- (Pyridin-2-Yl) Thiosemicarbazide” Spectrochimica Acta A Molecular and Biomolecular Spectroscopy, Vol. 71, No. 1, 2008, pp. 73-79. [29] A. A. El-Asmy, M. M. Hassanian, M. H. Abdel-Rhman and I. M. Gabr, “Synthesis, Characterization and Antibac- Terial Activity of Pd(II), Pt(II) and Ag(I) Complexes of 4-ethyl and 4-(p-tolyl)-1-(pyridin-2-yl)thiosemicarba- zides,” Journal of Sulfur Chemistry, Vol. 31, No. 2, 2010, pp. 141-151. doi:10.1080/17415990903569569 [30] S. A. Ahmed, “Alumina Physically Loaded by Thio- semicarbazide for Selective Preconcentration of Mer- cury(II) Ion from Natural Water Samples,” Journal of Hazardous Materials, Vol. 156, No. 1-3, 2008, pp. 521- 529. doi:10.1016/j.jhazmat.2007.12.049 [31] R. Gao, Z. Hu, X. Chang, Q. He , L. Zhang, Z. Tu and J. Shi, “Chemically Modified Activated Carbon with 1-acylthio-semicarbazide for Selective Solid-Phase Ex- traction and Preconcentration of Trace Cu(II), Hg(II) and Pb(II) from Water Samples” Journal of Hazardous Mate- rials, Vol. 172, No. 1, 2009, pp. 324-329. doi:10.1016/j.jhazmat.2009.07.014 [32] M. E. Mahmoud, A. A. Yakout, S. B. Ahmed, M. M. Osman, “Speciation, Selective Extraction and Preconcen- tration of Chromium Ions via Alumina-Functionalized- Isatin-Thiosemicarbazone,” Journal of Hazardous Mate- rials, Vol. 158, No. 2-3, 2008, pp. 541-548. doi:10.1016/j.jhazmat.2008.01.114 [33] M. M. Hassanien, M. H. Abdel-Rhman and A. A. El- Asmy, “Cloud Point Extraction and Spectrophotometric Determination of Cu(II) in Saturated Saline Solutions Using 4-ethyl-1-(pyridin-2-yl) Thiosemicarbazide,” Transi- tion, Metal Chemistry, Vol. 32, No. 8, 2007, pp. 1025- 1029. doi:10.1007/s11243-007-0281-8 [34] N. Dallali, M. M. Zahedi and Y. Yamini, “Simultaneous Cloud Point Extraction and Determination of Zn, Co, Ni and Pb by Flame Atomic Absorption Spectrometry, Us- ing 2-Guani-Dinobenzimidazole as the Complexing Agent,” Scientia Iranica, Vol. 14, No. 4, 2007, pp. 291-296. [35] M. Ghaedi, K. Niknam, E. Niknamb and M. Soylak, “Application of Cloud Point Extraction for Copper, Nickel, Zinc and Iron Ions in Environmental Samples,” Journal of the Chinese Chemical Society, Vol. 56, No. 5, 2009, pp. 981-986. [36] E. Kilinc, A. Cetin, M. Togrul and H. Hosgoren, “Syn- thesis of Bis(Amino Alcohol) Oxalamides and Their Us- age for the Preconcentration of Trace Metals by Cloud Point Extraction,” Analytical Sciences, Vol. 24, No. 6, 2008, pp. 763-768. doi:10.2116/analsci.24.763 [37] C. A. Şahin, M. Efeçınar and N. Şatıroğlu, “Combination of Cloud Point Extraction and Flame Atomic Absorption Spectrometry for Preconcentration and Determination of Copyright © 2011 SciRes. AJAC  M. M. HASSANIEN ET AL. Copyright © 2011 SciRes. AJAC 709 Nickel and Manganese Ions in Water and Food Samples,” Journal of Hazardous Materials, Vol. 176, No. 1-3, 2010, pp. 672-677. doi:10.1016/j.jhazmat.2009.11.084 [38] C. B. Ojeda, F. S. Rojas and J. M. Pavón, “Preconcentra- tion of Cadmium in Environmental Samples by Cloud Point Extraction and Determination by FAAS,” American Journal of Analytical Chemistry, Vol. 1, No. 3, 2010, pp. 127-134. doi:10.4236/ajac.2010.13016 [39] M. M. Hassanien, “Silica Glass Modified with Flavonoid Derivatives for Preconcentration of Some Toxic Metal Ions in Water Samples and Their Determination with ICP-MS,” Environmental Monitoring and Assessment, Vol. 167, No. 1-4, 2010, pp. 587-598. doi:10.1007/s10661-009-1075-6 [40] K. Abou-El-Sherbini, I. M. Kenawy, R. M. Issa, M. A. Hamed and R. Elmorsi, “Separation and Preconcentration in a Batch Mode of Cd(II), Cr(III, VI), Cu(II), Mn(II, VII) and Pb(II) by Solidphase Extraction by Using of Silica Modified with N-Propylsalicylaldimine,” Talanta, Vol. 58, No. 2, 2002, pp. 289-300. doi:10.1016/S0039-9140(02)00248-5 [41] I. M. Kenawy, M. A. Hafez, M. A. Akl and R. R. Lashein, “Determination by AAS of Some Trace Heavy Metal Ions in Some Natural and Biological Samples after Their Preconcentration Using Newly Chemically Modified Chloromethylated Polystyrene-PAN Ion-Exchanger,” Analy- tical Sciences, Vol. 16, No. 5, 2000, pp. 493-500. doi:10.2116/analsci.16.493
|