American Journal of Anal yt ical Chemistry, 2011, 2, 658-664
doi:10.4236/ajac.2011.26075 Published Online October 2011 (http://www.SciRP.org/journal/ajac)
Copyright © 2011 SciRes. AJAC
Analysis of Cocaine and Crack Cocaine via Thin Layer
Chromatography Coupled to Easy Ambient Sonic-Spray
Ionization Mass Spectrometry
Bruno D. Sabino1,2*, Wanderson Romão3, Morena L. Sodré1, Deleon N. Correa3,
Denise B. Rocha Pinto1, Fábio O. M. Alonso1, Marcos N. Eberlin3
1Institute of Criminalistic Carlos Éboli, Rio de Janeir o, Brazil,
2National Institu te of Metrology, Standardization and Industrial Quality, Av. N. Sra. das Graças,
Duque de Caxias, Brasil
3ThoMSon Mass Spectrome try Laboratory, Institute of Chemistry, University of Campinas,
Campinas, Brazil
E-mail: *brsabino@ig.com.br
Received June 20, 2011; revised July 27, 2011; accepted August 3, 2011
Abstract
Cocaine and crack cocaine are usually seized with a great diversity of adulterants, such as benzocaine, lido-
caine, caffeine, and procaine. The forensic identification of cocaine in these drug mixtures is normally per-
formed using colorimetric testing kits, but these tests may suffer from interferences providing false-positive
or false-negatives. In this work, we describe the use of thin layer chromatography coupled to easy
sonic-spray ambient ionization mass spectrometry (TLC/EASI-MS) for rapid and secure analysis of cocaine
and crack cocaine. Fifteen cocaine samples were analyzed, and all of them revealed positive TLC/EASI-MS
results for cocaine, but other drugs and adulterants were also detected such as lidocaine, caffeine, benzocaine,
lactose, benzoylecgonine, and ecgonidine. False positives and false negatives, as judged by the TLC Rf val-
ues, were identified via on-spot characterization by EASI-MS. The TLC/EASI-MS combination seems
therefore to provide an appropriate technique for secure forensic investigations of illicit drugs.
Keywords: Cocaine; Crack, TLC, Illicit Drug, EASI-MS
1. Introduction
Cocaine is an illicit drug produced from the leaves of
Eritroxylum coca normally via extraction with organic
solvents followed by purification, liquid-liquid extraction
and a final conversion from free base cocaine to hydro-
chloride cocaine [1]. Crack is a combination of cocaine
hydrochloride, baking soda, and other adulterants that
form a rock-like substance [2]. Figure 1 shows a picture
of typical powder cocaine (left) and crack cocaine (right)
samples seized by the Rio de Janeiro State Police.
Street drugs are subject to many procedures of adul-
teration and dilution. To imitate its effects, adulterants
are often molecules with similar pharmacological, senso-
rial and physical-chemical properties as those of the main
drug. Diluents are organic or inorganic compounds with
no significant pharmacological properties, intentionally
added to the street-drug sample to increase the volume
and weight of the final product [3]. Illicit samples of co-
caine are rarely pure. Figure 2 shows the chemical struc-
ture of cocaine Figure 2(a), its main impurities that arise
via the manufacturing process such as benzoylecgonine
Figure 2(b), cinnamoylcocaine Figure 2(c), and benzoic
acid Figure 2(d), adulterants such as the anesthetics li-
docaine Figure 2(f), procaine Figure 2(g) and benzocaine
Figure 2(h) and other central nervous system (CNS) ac-
Figure 1. Typical samples of powder (left) and crack (right)
ocaine. c
B. D. SABINO ET AL.
Copyright © 2011 SciRes. AJAC
659
Figure 2. Structures of molecules normally found in cocaine samples.
tive drugs, such as ketamine Figure 2(e) and caffeine
Figure 2(i) that are usually present in addition or in sub-
stitution of cocaine in illegal drug formulations.
The identification of cocaine and crack cocaine is of-
ten performed by forensic laboratories using the Scott
Ruybal test [4] that employs a reagent kit to develop a
blue color when cocaine is present. The colorimetric tests
are the gold standard for forensic analysis of controlled
substances, and offer a reasonably reliable means for
very rapid screening. These tests display, however, poor
specificity, and may sometimes provide false-positives or
false-negatives, specially for the more complex mixtures
or impure samples and for common adulterants such as
lidocaine and ketamine [5].
In forensic analysis, thin layer chromatography (TLC)
is also a classic, simple, and versatile method for drug
analysis. TLC is limited, however, in terms of secure
characterization and is therefore often used in parallel
with other methods of structural analysis. Quantitation is
normally not attempted in TLC, but direct ultraviolet
densitometric measurements of TLC spots have been used
to quantify components found in illicit drug samples [1].
Recently, a new set of ambient ionization mass spec-
trometric ionization techniques have been introduced.
These techniques allow desorption, ionization and char-
acterization of analytes directly from surfaces or natural
matrixes [6]. These methods, known collectively as am-
bient MS methods, have become also attractive alterna-
tives in forensic analysis since they require no sample
preparation or pre-separation. Key examples of these
techniques are desorption electrospray ionization (DESI)
[1-4,7-11], direct analysis in real time (DART) [8-12],
extractive electrospray ionization (EESI), desorption at-
mospheric-pressure photoionisation (DAPPI), atmospheric
solids analysis probe (ASAP) [13], desorption atmospheric
pressure chemical ionization (DAPCI), electrospray-as-
sisted laser desorption ionization (ELDI) [14], and easy
ambient sonic spray ionization (EASI) [15].
Among these ionization/desorption techniques, EASI
is one of the simplest, gentlest and most easily imple-
mented [15]. An EASI source operates with no voltages,
radiation, discharges or heating and can be constructed
and installed in a few minutes from simple MS labora-
tory parts. EASI is assisted only by compressed N2 (or
air) used for sonic spraying [16] that creates very small
droplets from the solvent, which end up being charged
due to statistical imbalanced distribution of cations and
anions in these minute droplets (Figure 3). The dense
stream of the sonic charged droplets is directed to the
sample surface, where desorption and further transfer-
ence of charge to analytes molecules occurs. EASI-MS
can also operate in the Venturi easy ambient sonic-spray
ionization (V-EASI) mode with the additional benefit of
solution self pumping [17] and has already been suc-
cessfully applied to several forensic investigations such
as analysis of ecstasy [18] and mCPP tablets [19], inks
[20], chemical fingerprinting of banknotes [21], per-
fumes [22] and LSD blotters [23]. In this work, the abil-
ity of TLC/EASI-MS to analyze cocaine and crack co-
caine street samples was tested.
2. Experimental
2.1. Reagents and Samples
HPLC grade methanol and formic acid were obtained
B. D. SABINO ET AL.
660
Figure 3. Schematics of the TLC/EASI-MS coupling used to
directly analyze cocaine and crack cocaine samples.
from Merck. Eight samples of cocaine white powder and
seven of crack cocaine were provided by the Rio de Ja-
neiro State Civil Police. Cocaine, caffeine, lidocaine, ben-
zocaine, procaine, and ketamine standards solutions (1
mg/mL) were purchased from Radian (Austin, TX, USA).
2.2. Sample Preparation
The investigated drug samples were seized by the police
in Rio de Janeiro, Brazil, during the years of 2008-2009
and were received by the Carlos Éboli Criminalistic In-
stitute of Rio de Janeiro Civil State Police for analysis.
Crack cocaine rocks were pulverized and cocaine white
powder samples were homogenized and 10 mg of each
sample was dissolved in 10 ml of methanol. After cen-
trifugation, the upper layer was transferred to a glass vial
and analyzed by TLC/EASI-MS.
2.3. TLC Procedure
Precoated plates (silica gel 60 GF 254, Merck, 6100
Darmstadt, Germany) were used in all cases. The plates
were dried for 30 min at 80˚C and then stored in a desic-
cator. The sample solution of each seized drug and ali-
quots of the standards solutions (3 μL) were applied to
silica gel plates. These plates were then developed in an
horizontal chamber (Camag, Switzerland). The develop-
ing distance was 8 cm. Two mobile phases were tested: 1)
methanol, chloroform and acetic acid (20:75:5 v%), and
2) acetone. After development, the plates were dried at
100˚C for 15 min. Spots were detected and marked under
ultraviolet (UV) radiation at 254 nm.
2.4. Limit of Detection
The limit of detection (LOD) of cocaine in TLC plates
was set as the minimum concentration that could be
visualized with an acceptable level of precision of 15%
and accuracy of ±15%. LOD samples were analyzed as
they were unknown samples in 10 replicates.
2.5. EASI(+)-MS Procedures
Experiments were performed on a mono-quadrupole
mass spectrometer (LCMS-2010EV-Shimadzu Corp.,
Japan) equipped with a home-made EASI source (Figure
4), which has been described in details elsewhere [16].
Acidic methanol (0.1% in volume, 20 μL·min–1) and
compressed N2 at a pressure of 100 psi were used to form
the sonic spray. The capillary-surface and surface-entrance
angles were of 45˚. Spectra were accumulated for 10 s.
2.6. Gas Chromatography—Mass Spectrometry
(GC-MS) Analysis
The GC-MS analyses were conducted using a Thermo
Scientific (Austin, Texas) Focus gas chromatograph
coupled with an ITQ 700 Thermo mass selective detector.
The mass spectra scan rate was 3 scans s–1. The GC was
operated in splitless mode with a carrier gas (helium
grade 5) flow rate of 1.5 mL·min–1.
The mass spectrometer was operated using 70 eV elec-
tron ionization (EI) and a source temperature of 250˚C.
The GC injector was maintained at 250˚C and the trans-
fer line at 250˚C. EI-MS were subjected to background
subtraction and averaged using ca. five scans. The sam-
ples analyzed were diluted in HPLC grade methanol to
give a final concentration of 1 mg·mL–1 and 1 μL was
introduced via manual injection as individual solutions.
The GC temperature program used consisted of an initial
temperature of 130˚C for 1 min then increased to 280˚C
at 17˚C·min–1 and held for 11 min. GC/MS was used to
confirm all impurities identified by TLC/EASI-MS. All
the plates used in the work were prepared in duplicate.
The spots shown in the figures were also scratched from
a duplicate plate and analyzed by GC-MS.
3. Results and Discussion
To demonstrate the applicability of TLC/EASI-MS for
Solvent
MS
N
2
/Ar
Figure 4. Picture of the EASI-MS system.
Copyright © 2011 SciRes. AJAC
B. D. SABINO ET AL.
Copyright © 2011 SciRes. AJAC
661
the screening of street samples of cocaine and crack co-
caine, we first evaluated the TLC performance using two
different eluents and standards solutions, as well as seized
drug samples (Figure 5), three of cocaine (coc 1, coc 3
and coc 6) and four of crack cocaine (crack 2, crack 4,
crack 5 and crack 7). Table 1 lists the Rf values obtained.
TLC with acetone as mobile phase (Figure 5(a)) showed
spots tailing for most powder-cocaine and crack cocaine
samples and for some of the standard solutions of co-
caine and procaine. The cocaine and procaine spots
showed also too close Rf values (Rf 0.45 and 0.36,
respectively). Therefore, due to these poor results with
acetone, a second mobile phase was tested.
TLC with methanol:chloroform:acetic acid (20:75:5
v%) as mobile phase (Figure 5(b)) was more efficient
then with acetone since well separated and defined spots
for most of the samples were observed, and with the
presence of new spots with higher Rf values, interpreted
as indicative of the separation of impurities from the co-
caine and crack cocaine samples. Additionally, this TLC
eluent permitted proper separation and resolution of co-
caine standard from others standards (see Rf values in
Table 1). Hence, for TLC/EASI-MS measurements, TLC
was performed with methanol:chloroform:acetic acid
(20:75:5 v%) as the eluent.
Figures 6(a)-(f) shows the TLC/EASI-MS data for the
spots of all standards used. Caffeine and benzocaine
showed the lowest ionization efficiency and somewhat
poor but still a detectable signal/nose ratio. The great
polarity of caffeine and benzocaine is likely to increase
their retention by the silica surface decreasing therefore
the desorption efficiency via EASI. Similar results were
observed to TLC analysis of seized ecstasy tablets by
EASI-MS [18].
Figure 7(a) shows the TLC/EASI-MS data for the
cocaine spot of a cocaine sample (coc-1).
Figure 5. TLC of standards, cocaine samples and crack cocaine samples using acetone (upper), and methanol: chloro-
form:acetic acid (20:75:5 v%) (lower) as the mobile phase.
Table 1. Rf values of standards.
Compound Acetone methanol:chloroform: acetic acid (20:75:5 v%)
Caffeine 0.75 0.94
Lidocaine 0.83 0.47
Cocaine 0.45 0.15
Procaine 0.36 0.36
Benzocaine 0.92 0.89
Ketamine 0.80 0.64
B. D. SABINO ET AL.
662
Figure 6. TLC EASI-MS data for standards of: (a) benzocaine, (b) caffeine, (c) lidocaine, (d) procaine, (e) ketamine and (f)
cocaine.
Figures 8(a)-(b) show EASI-MS data for the two
spots for sample coc-3 with quite distinct Rf values.
Figures 9(a)-(b) show EASI-MS data for two spots
corresponding to coc-6.
Figure 10 shows composite TLC chromatograms of 5
cocaine samples (coc 9, coc 10, coc 12, coc 13 and coc15)
and 3 crack cocaine samples (crack 8, crack 11 and crack
14).
The difference in Rf values from the TLC spots of li-
docaine standard in coc10 could be explained by the fact
that lidocaine concentration in coc 10 is much lower than
the cocaine concentration. This difference in concentra-
tions between these substances may alter the interactions
degree between lidocaine, the mobile phase and the sta-
tionary silica phase of TLC plates, increasing its RF value,
when comparing to the lidocaine spot in standard solu-
tion. This result shows the importance of confirming the
TLC results with the application of the EASI-MS analysis.
Figures 11(a)-(c) show the EASI-MS data for coc-10
sample.
Figure 7. TLC EASI-MS data for the cocaine spot of sample
coc-1. PRECISA APAGAR O (a).
100100 200200 300300 400400 500
100100
%
0
304 (a)
a
b
100 (b)
%
100
0
m/zm/z
200 300 400 500
[CAFFEINE + H]
+
195
Figure 8. TLC EASI-MS data for two spots of coc 3. Spot (b)
is identified as cocaine via its [M+H]+ of m/z 304 whereas
spot a is characterized as caffeine via its [M+H]+ of m/z 195.
100 200300 400 500
100 200 300 400
100
%
0
100
%
0
304
235
[COCAINE + H]
+
[LIDO CAINE + H]
+
(a)
(b)
500
(a)
(b)
(c)
Figure 9. TLC EASI-MS data for spots (b) and (c) of coc-6.
Spot b was identified as cocaine and spot a as lidocaine, in
agreement with the TLC results (Figure 5(b)).
Copyright © 2011 SciRes. AJAC
B. D. SABINO ET AL.
Copyright © 2011 SciRes. AJAC
663
Figure 10. TLC of standards and for 5 cocaine and 3 crack samples. Again, all samples show spots with Rf (~0.15) coincident
with that of cocaine, providing therefore a rapid (but not unequivocally) positive results for cocaine. The EASI-MS data con-
fimed, however, the presence of cocaine. The coc-9, coc-10, crack 11, coc-13 and coc-15 samples showed spots with Rf 0.92
that points to either caffeine or benzocaine. The coc-10 sample presented the highest number of spots (four). Except for the
coc-9 sample, all samples displayed a spot Rf values of 0.33 that points to procaine.
100 200 300 400 500
100 200 300 400
100
%
0
100
%
0
m/z
304
(a)
(b)
(c)
100
%
0 100 200 300 400 500
[LIDOCAINE + H]
+
c
a
b
[COCAINE+ H]
+
500
235
166 [BENZOCAINE +
+
Figure 11. TLC EASI-MS data on spots for coc-10 with the
identification of three spots as cocaine ([M+H]+ of m/z 304),
lidocaine ([M+H]+ of m/z 235) and benzocaine ([M+H]+ of
m/z 166) confirming the TLC assignments.
Limit of Detection
The limit of detection found for cocaine in TLC plates
was 2 μg. This result was obtained by the analysis of 10
replicates of cocaine standard solutions, and the spots
related to this alkaloid were observed in all the plates.
This limit of detection is quite sufficient to permit its use
for routine analysis of cocaine and crack cocaine seized
samples in forensic laboratories.
4. Conclusions
The validation of TLC results of drug analysis in forensic
investigations is crucial to generate unquestionable re-
sults and to eliminate false negatives and positives.
TLCmethod is rapid, simple and low cost, demanding
only basic laboratory equipments and glassware, and is
normally applied to screen for cocaine and other active
components in seized cocaine and crack cocaine forensic
samples. False positive or negatives TLC results may be
obtained, however, particularly for samples with impuri-
ties of more complex formulations. We have demon-
strated that EASI-MS seems to provide a simple and fast
tool in forensic analysis able to perform on-spot charac-
terization at the molecular level.
The combination of TLC with eventual EASI-MS in-
spection seems to provide a powerful combination for
forensic investigation of illicit drugs reducing the risks of
false positives and false negatives.
5. Acknowledgments
We thank financial support from the Brazilian Science
foundations CNPq, FAPESP, FINEP and Inmetro. The
authors thank the Rio de Janeiro Civil Police for provid-
B. D. SABINO ET AL.
664
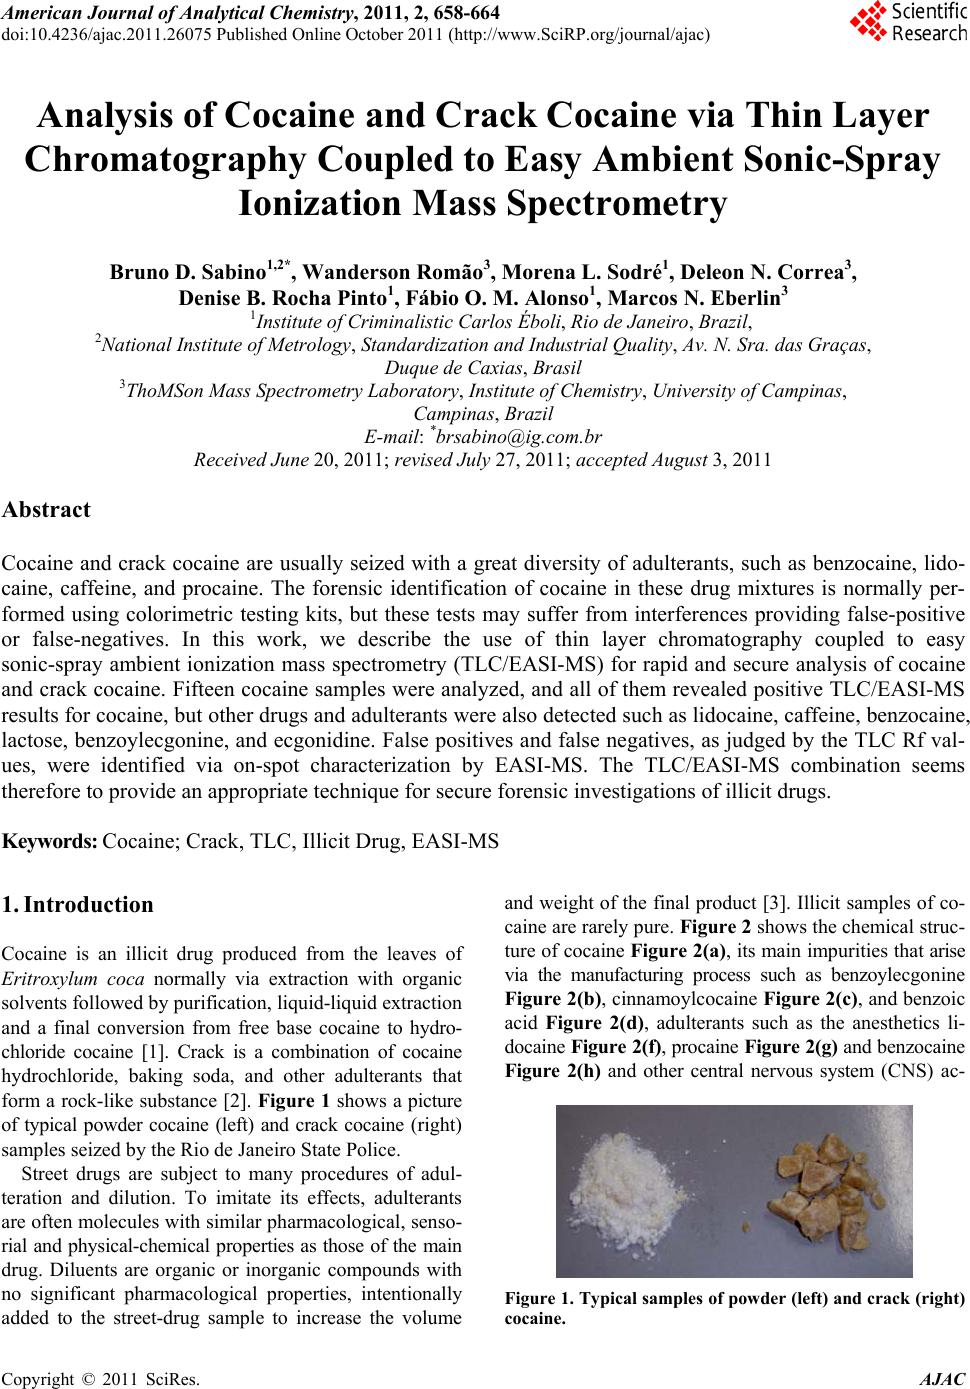
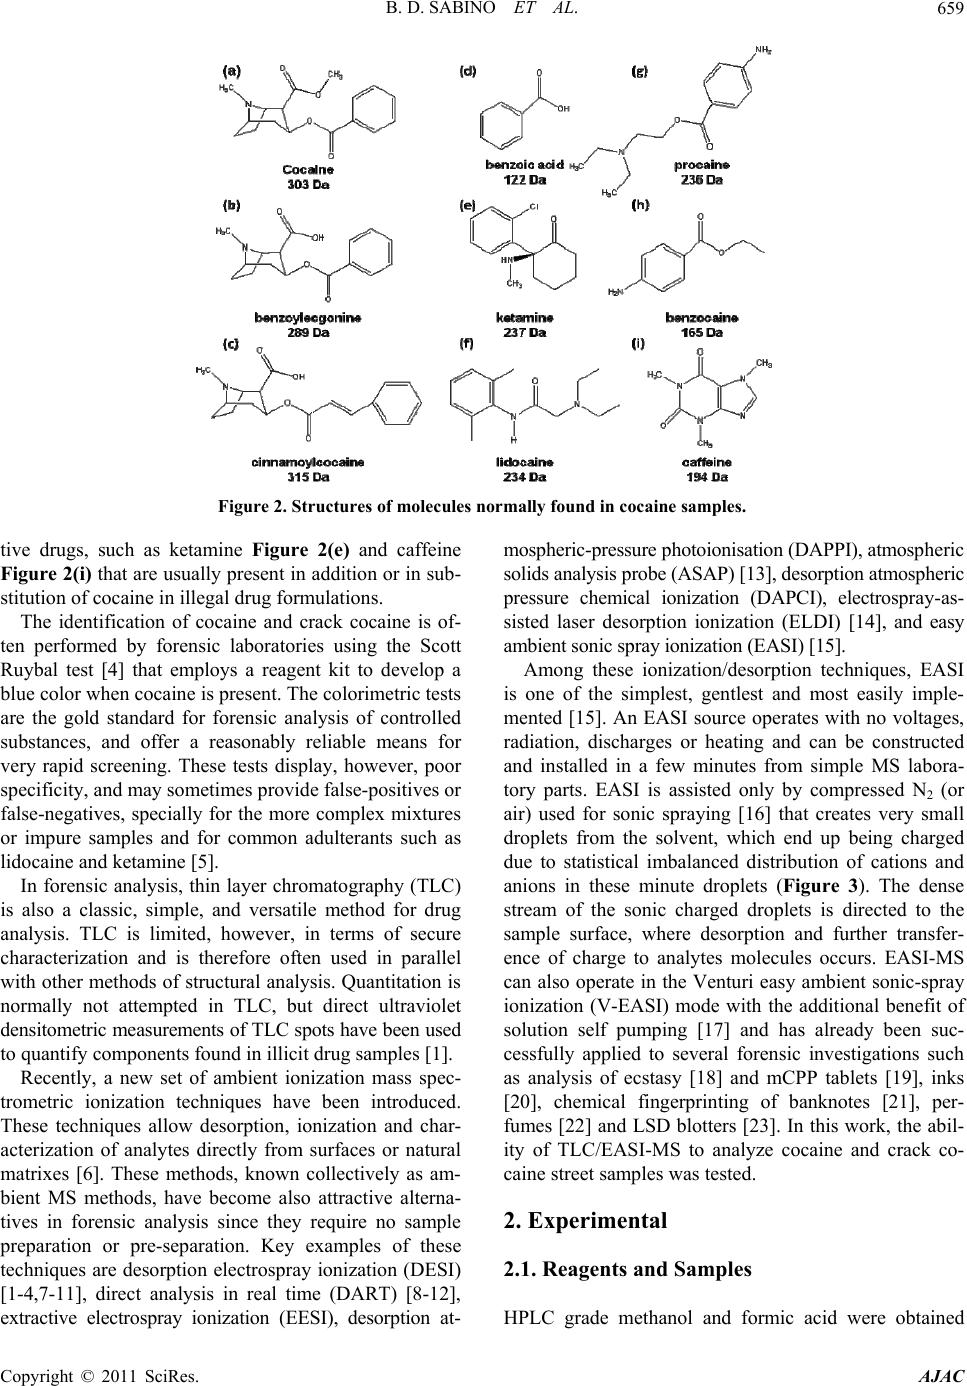
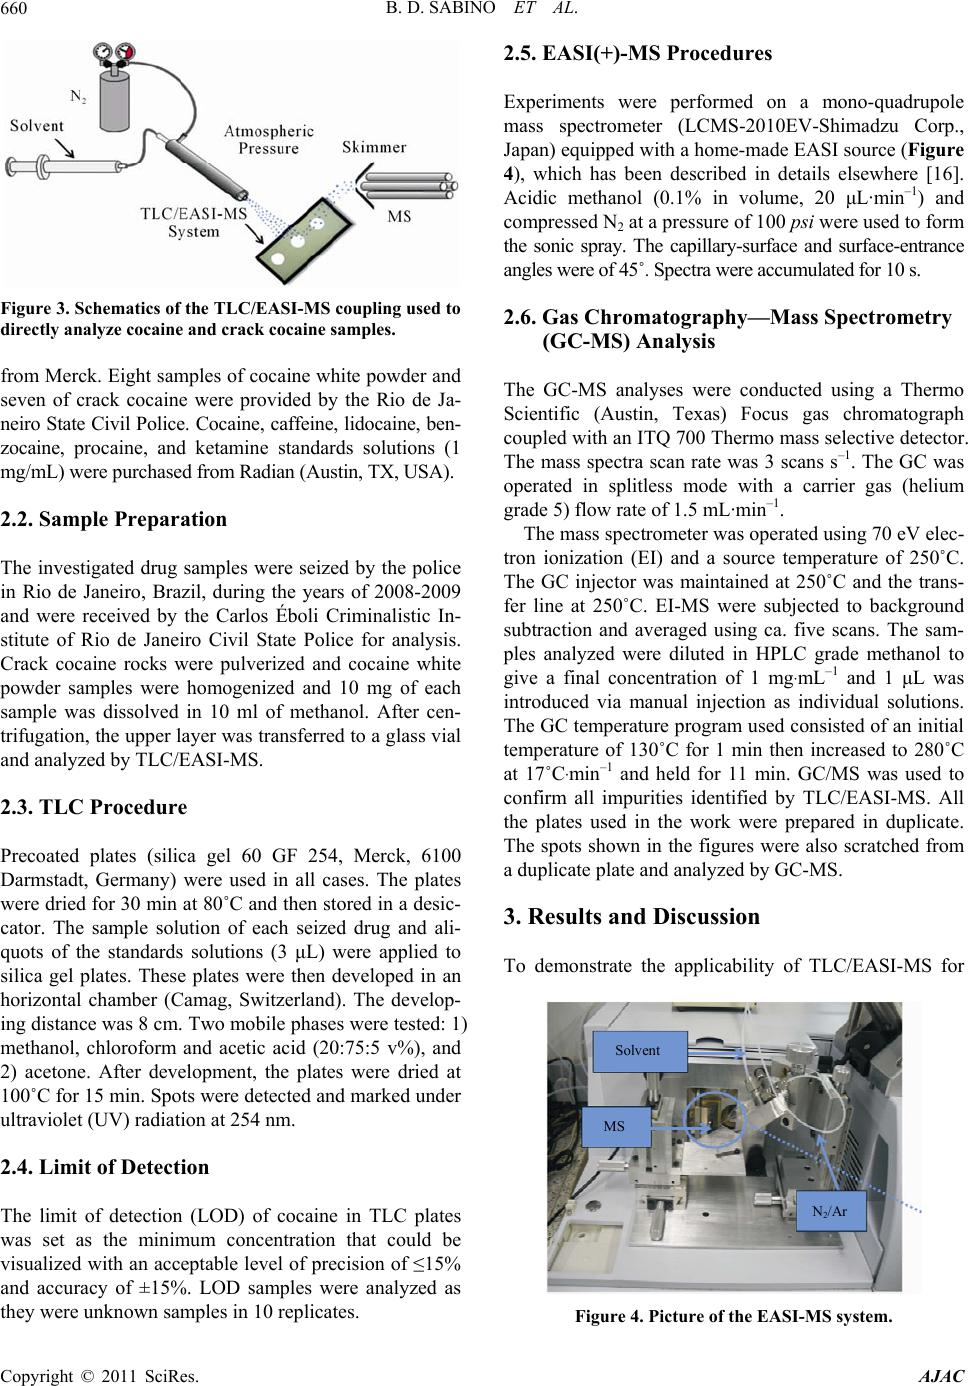
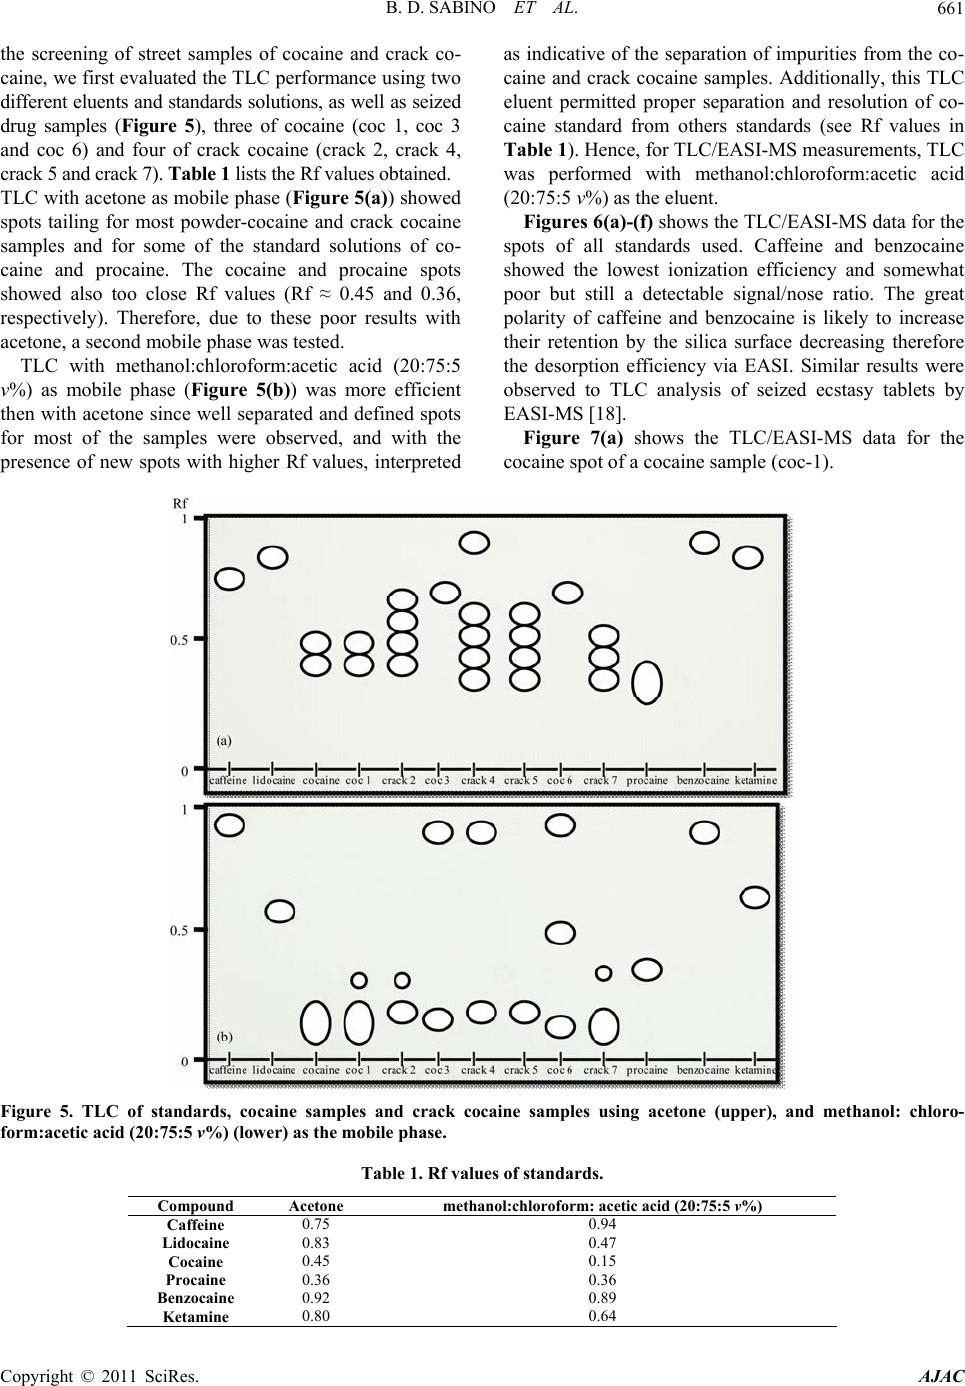
ing the cocaine and crack cocaine samples.
6. References
[1] M. Chiarotti and N. Fucci, “Comparative Analysis of
Heroin and Cocaine Seizures,” Journal of Chromatogra-
phy B: Biomedical Sciences and Applications, Vol. 733,
No. 1-2, 1999, pp. 127-136.
doi:10.1016/S0378-4347(99)00240-6
[2] S. E. Lankenau, M. C. Clatts, L. A. Goldsamt and D. L.
Welle, “Crack Cocaine Injection Practices and HIV Risk:
Findings from New York and Bridgeport,” Journal of
Drug Issues, Vol. 34, No. 2, 2004, pp. 319-332.
[3] D. G. de Carvalho and A. F. Mídio, “Quality of Cocaine
Seized in 1997 in the Street-Drug Market of São Paulo
City, Brazil,” Brazilian Journal of Pharmaceutical Sci-
ences, Vol. 39, No. 1, 2003, pp. 71-75.
[4] R. F. X. Klein and P. A. Hays, “Detection and Analysis
of Drugs of Forensic Interest, 1992-2001. A Literature
Review,” Microgram Journal, Vol. 1, No. 1-2, 2003, pp.
55-153.
[5] W. Jeffrey, “Colour Tests,” In: A. Moffat, et al., Ed.,
Clarkes Analysis of Drugs and Poisons in Pharmaceuti-
cals, Body Fluids and Postmortem Material, Pharmaceu-
tical Press, London, 2004.
[6] D. R. Ifa, L. M. Gumaelius, L. S. Eberlin, N. E. Manicke
and R. G. Cooks, “Forensic Analysis of Inks by Imaging
Desorption Electrospray Ionization (DESI) Mass Spec-
trometry,” Analyst, Vol. 132, No. 5, 2007, pp. 461-467.
doi:10.1039/b700236j
[7] Z. Takats, J. M. Wiseman, B. Gologan and R. G. Cooks,
“Mass Spectrometry Sampling under Ambient Conditions
with Desorption Electrospray Ionization,” Science, Vol.
306, No. 5695, 2004, pp. 471-473.
doi:10.1126/science.1104404
[8] L. A. Leuthold, et al., “Desorption Electrospray Ioniza-
tion Mass Spectrometry: Direct Toxicological Screening
and Analysis of Illicit Ecstasy Tablets,” Rapid Commu-
nications in Mass Spectrometry, Vol. 20, No. 2, 2006, pp.
103-110. doi:10.1002/rcm.2280
[9] J. M. Wells, et al., “Implementation of DART and DESI
Ionization on a Fieldable Mass Spectrometer,” Journal of
the American Society for Mass Spectrometry, Vol. 19, No.
10, 2008, pp. 1419-1424.
doi:10.1016/j.jasms.2008.06.028
[10] H. Chen, N. N. Talaty, Z. Takats and R. G. Cooks, “De-
sorption Electrospray Ionization Mass Spectrometry for
High-Throughput Analysis of Pharmaceutical Samples in
the Ambient Environment,” Analytical Chemistry, Vol.
77, No. 21, 2005, pp. 6915-6927. doi:10.1021/ac050989d
[11] T. J. Kauppila, et al., “Desorption Electrospray Ionization
Mass Spectrometry for the Analysis of Pharmaceuticals
and Metabolites,” Rapid Communications in Mass Spec-
trometry, Vol. 20, No. 3, 2006, pp. 387-392.
doi:10.1002/rcm.2304
[12] R. B. Cody, J. A. Laramee and H. D. Durst, “Versatile
New Ion Source for the Analysis of Materials in Open
Air under Ambient Conditions,” Analytical Chemistry,
Vol. 77, No. 8, 2005, pp. 2297-302.
doi:10.1021/ac050162j
[13] C. N. McEwen, R. G. McKay and B. S. Larsen, “Analysis
of Solids, Liquids, and Biological Tissues Using Solids
Probe Introduction at Atmospheric Pressure on Commer-
cial LC/MS Instruments,” Analytical Chemistry, Vol. 1,
No. 77, 2005, pp. 7826-7831. doi:10.1021/ac051470k
[14] M. Z. Huang, H. J. Hsu, J. Y. Lee, J. Jeng and J. Shiea,
“Direct Protein Detection from Biological Media through
Electrospray-Assisted Laser Desorption Ionization/Mass
Spectrometry,” Journal of Proteome Research, Vol. 5,
No. 5, 2006, pp. 1107-1116. doi:10.1021/pr050442f
[15] R. Haddad, R. Sparrapan and M. N. Eberlin, “Desorption
Sonic Spray Ionization for (High) Voltage-Free Ambient
Mass Spectrometry,” Rapid Communications in Mass
Spectrometry, Vol. 20, No. 19, 2006, pp. 2901-2905.
doi:10.1002/rcm.2680
[16] A. Hirabayashi, M. Sakairi and H. Koizumi, “Sonic Spray
Mass Spectrometry,” Analytical Chemistry, Vol. 67, No.
17, 1995, pp. 2878-2882. doi:10.1021/ac00113a023
[17] V. G. Santos, et al., “Venturi Easy Ambient Sonic-Spray
Ionization,” Analytical Chemistry, Vol. 83, No. 4, 2011,
pp. 1375-1380. doi:10.1021/ac102765z
[18] B. D. Sabino, et al., “Analysis of Street Ecstasy Tablets
by Thin Layer Chromatography Coupled to Easy Ambi-
ent Sonic-Spray Ionization Mass Spectrometry,” Brazil-
ian Journal of Analytical Chemistry, Vol. 1, 2010, pp.
6-12.
[19] W. Romao, et al., “Chemical Profile of Meta-Chloro-
phenylpiperazine (m-CPP) in Ecstasy Tablets by Easy
Ambient Sonic-Spray Ionization, X-Ray Fluorescence,
Ion Mobility Mass Spectrometry and NMR,” Analytical
and Bioanalytical Chemistry, Vol. 400, No. 9, 2011, pp.
3053-3064.
doi:10.1007/s00216-011-4883-9
[20] P. M. Lalli, et al., “Fingerprinting and Aging of Ink by
Easy Ambient Sonic-Spray Ionization Mass Spectrome-
try,” Analyst, Vol. 135, No. 4, 2010, pp. 745-750.
doi:10.1039/b923398a
[21] L. S. Eberlin, et al., “Instantaneous Chemical Profiles of
Banknotes by Ambient Mass Spectrometry,” Analyst, Vol.
135, No. 10, 2010, pp. 2533-2539.
doi:10.1039/c0an00243g
[22] R. Haddad, R. R. Catharino, L. A. Marques and M. N.
Eberlin, “Perfume Fingerprinting by Easy Ambient Son-
ic-Spray Ionization Mass Spectrometry: Nearly Instanta-
neous Typification and Counterfeit Detection,” Rapid
Communications in Mass Spectrometry, Vol. 22, No. 22,
2008, pp. 3662-3666. doi:10.1002/rcm.3788
[23] W. Romão, et al., “LSD and 9,10-Dihydro-LSD Analyses
in Street Drug Blotter Samples via Easy Ambient
Sonic-Spray Ionization Mass Spectrometry (EASI-MS),”
Journal of Forensic Sciences, in press.
Copyright © 2011 SciRes. AJAC