 Int. J. Communications, Network and System Sciences, 2009, 7, 608-618 doi:10.4236/ijcns.2009.27068 Published Online October 2009 (http://www.SciRP.org/journal/ijcns/). Copyright © 2009 SciRes. IJCNS A New Fairness-Oriented Packet Scheduling Scheme with Reduced Channel Feedback for OFDMA Packet Radio Systems Stanislav NONCHEV, Mikko VALKAMA Department of Communications Engineering, Tampere University of Technology, Tampere, Finland Email: {stanislav.nonchev, mikko.e.valkama}@tut.fi Received June 26, 2009; revised August 13, 2009; accepted September 26, 2009 ABSTRACT In this paper, we propose a flexible and fairness-oriented packet scheduling approach for 3GPP UTRAN long term evolution (LTE) type packet radio systems, building on the ordinary proportional fair (PF) sched- uling principle and channel quality indicator (CQI) feedback. Special emphasis is also put on practical feed- back reporting mechanisms, including the effects of mobile measurement and estimation errors, reporting delays, and CQI quantization and compression. The performance of the overall scheduling and feedback re- porting process is investigated in details, in terms of cell throughput, coverage and resource allocation fair- ness, by using extensive quasi-static cellular system simulations in practical OFDMA system environment with frequency reuse of 1. The performance simulations show that by using the proposed modified PF ap- proach, significant coverage improvements in the order of 50% can be obtained at the expense of only 10-15% throughput loss, for all reduced feedback reporting schemes. This reflects highly improved fairness in the radio resource management (RRM) compared to other existing schedulers, without essentially com- promising the cell capacity. Furthermore, we demonstrate the improved functionality increase in radio re- source management for UE’s utilizing multi-antenna diversity receivers. Keywords: Radio Resource Management, Packet Scheduling, Proportional-Fair, Channel Quality Feedback, Throughput, Fairness 1. Introduction Development of new radio interface technologies for beyond 3G cellular radio systems with support to high data rates, low latency and packet-optimised radio access has led to the use of OFDM/OFDMA. One good exam- ple of such developments is e.g. the UTRAN long term evolution (LTE), being currently standardized by 3GPP [1–3]. In general, performance improvements over the existing radio systems are basically obtained through proper deployment of fast link adaptation and new packet scheduling algorithms, exploiting the available multi-user diversity in both time and frequency domains [4–6]. On the other hand, achieving such performance improvements typically requires relatively accurate channel state feedback in terms of CQI reports from mo- bile stations (MS) to the base station (BS) [6–12]. As a practical example, each mobile station can measure the effective signal-to-interference-plus-noise-ratio (SINR), per active subcarrier or block of subcarriers, and send back the obtained channel state to the base station for downlink radio resource management. This, in turn, can easily lead to considerable control signalling overhead if not designed and implemented properly. Thus in general, the amount of the feedback information needs to be lim- ited and is also subject to different errors and delays, affecting the overall system-level performance. Another important aspect in scheduling and resource allocation process is fairness, implying that also users with less favourable channel conditions should anyway be given some reasonable access to the radio spectrum [4–6,13– 18]. This is especially important in serving users at, e.g., cell edges in cellular networks. In this paper, we address the packet scheduling and channel state reporting tasks in OFDMA-based cellular packet radio systems. Stemming from ordinary propor- tional fair (PF) scheduling principle, a modified PF scheduler is first proposed having great flexibility to tune the exact scheduling characteristics in terms of capacity, coverage and fairness. More specifically, the proposed 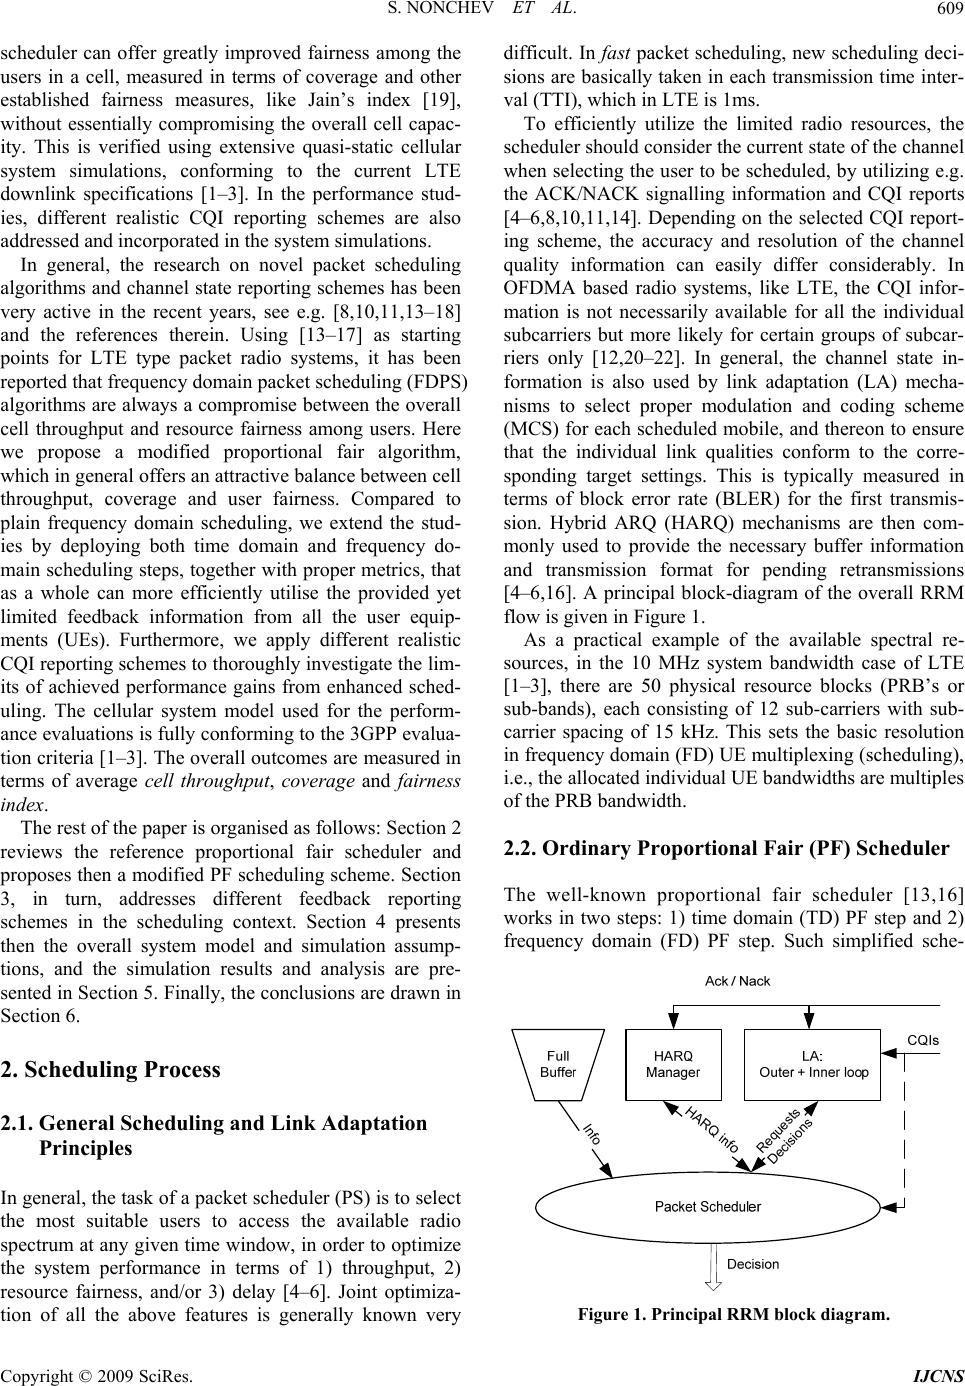 S. NONCHEV ET AL. 609 scheduler can offer greatly improved fairness among the users in a cell, measured in terms of coverage and other established fairness measures, like Jain’s index [19], without essentially compromising the overall cell capac- ity. This is verified using extensive quasi-static cellular system simulations, conforming to the current LTE downlink specifications [1–3]. In the performance stud- ies, different realistic CQI reporting schemes are also addressed and incorporated in the system simulations. In general, the research on novel packet scheduling algorithms and channel state reporting schemes has been very active in the recent years, see e.g. [8,10,11,13–18] and the references therein. Using [13–17] as starting points for LTE type packet radio systems, it has been reported that frequency domain packet scheduling (FDPS) algorithms are always a compromise between the overall cell throughput and resource fairness among users. Here we propose a modified proportional fair algorithm, which in general offers an attractive balance between cell throughput, coverage and user fairness. Compared to plain frequency domain scheduling, we extend the stud- ies by deploying both time domain and frequency do- main scheduling steps, together with proper metrics, that as a whole can more efficiently utilise the provided yet limited feedback information from all the user equip- ments (UEs). Furthermore, we apply different realistic CQI reporting schemes to thoroughly investigate the lim- its of achieved performance gains from enhanced sched- uling. The cellular system model used for the perform- ance evaluations is fully conforming to the 3GPP evalua- tion criteria [1–3]. The overall outcomes are measured in terms of average cell throughput, coverage and fairness index. The rest of the paper is organised as follows: Section 2 reviews the reference proportional fair scheduler and proposes then a modified PF scheduling scheme. Section 3, in turn, addresses different feedback reporting schemes in the scheduling context. Section 4 presents then the overall system model and simulation assump- tions, and the simulation results and analysis are pre- sented in Section 5. Finally, the conclusions are drawn in Section 6. 2. Scheduling Process 2.1. General Scheduling and Link Adaptation Principles In general, the task of a packet scheduler (PS) is to select the most suitable users to access the available radio spectrum at any given time window, in order to optimize the system performance in terms of 1) throughput, 2) resource fairness, and/or 3) delay [4–6]. Joint optimiza- tion of all the above features is generally known very difficult. In fast packet scheduling, new scheduling deci- sions are basically taken in each transmission time inter- val (TTI), which in LTE is 1ms. To efficiently utilize the limited radio resources, the scheduler should consider the current state of the channel when selecting the user to be scheduled, by utilizing e.g. the ACK/NACK signalling information and CQI reports [4–6,8,10,11,14]. Depending on the selected CQI report- ing scheme, the accuracy and resolution of the channel quality information can easily differ considerably. In OFDMA based radio systems, like LTE, the CQI infor- mation is not necessarily available for all the individual subcarriers but more likely for certain groups of subcar- riers only [12,20–22]. In general, the channel state in- formation is also used by link adaptation (LA) mecha- nisms to select proper modulation and coding scheme (MCS) for each scheduled mobile, and thereon to ensure that the individual link qualities conform to the corre- sponding target settings. This is typically measured in terms of block error rate (BLER) for the first transmis- sion. Hybrid ARQ (HARQ) mechanisms are then com- monly used to provide the necessary buffer information and transmission format for pending retransmissions [4–6,16]. A principal block-diagram of the overall RRM flow is given in Figure 1. As a practical example of the available spectral re- sources, in the 10 MHz system bandwidth case of LTE [1–3], there are 50 physical resource blocks (PRB’s or sub-bands), each consisting of 12 sub-carriers with sub- carrier spacing of 15 kHz. This sets the basic resolution in frequency domain (FD) UE multiplexing (scheduling), i.e., the allocated individual UE bandwidths are multiples of the PRB bandwidth. 2.2. Ordinary Proportional Fair (PF) Scheduler The well-known proportional fair scheduler [13,16] works in two steps: 1) time domain (TD) PF step and 2) frequency domain (FD) PF step. Such simplified sche- Requests Decisions Info Figure 1. Principal RRM block diagram. Copyright © 2009 SciRes. IJCNS 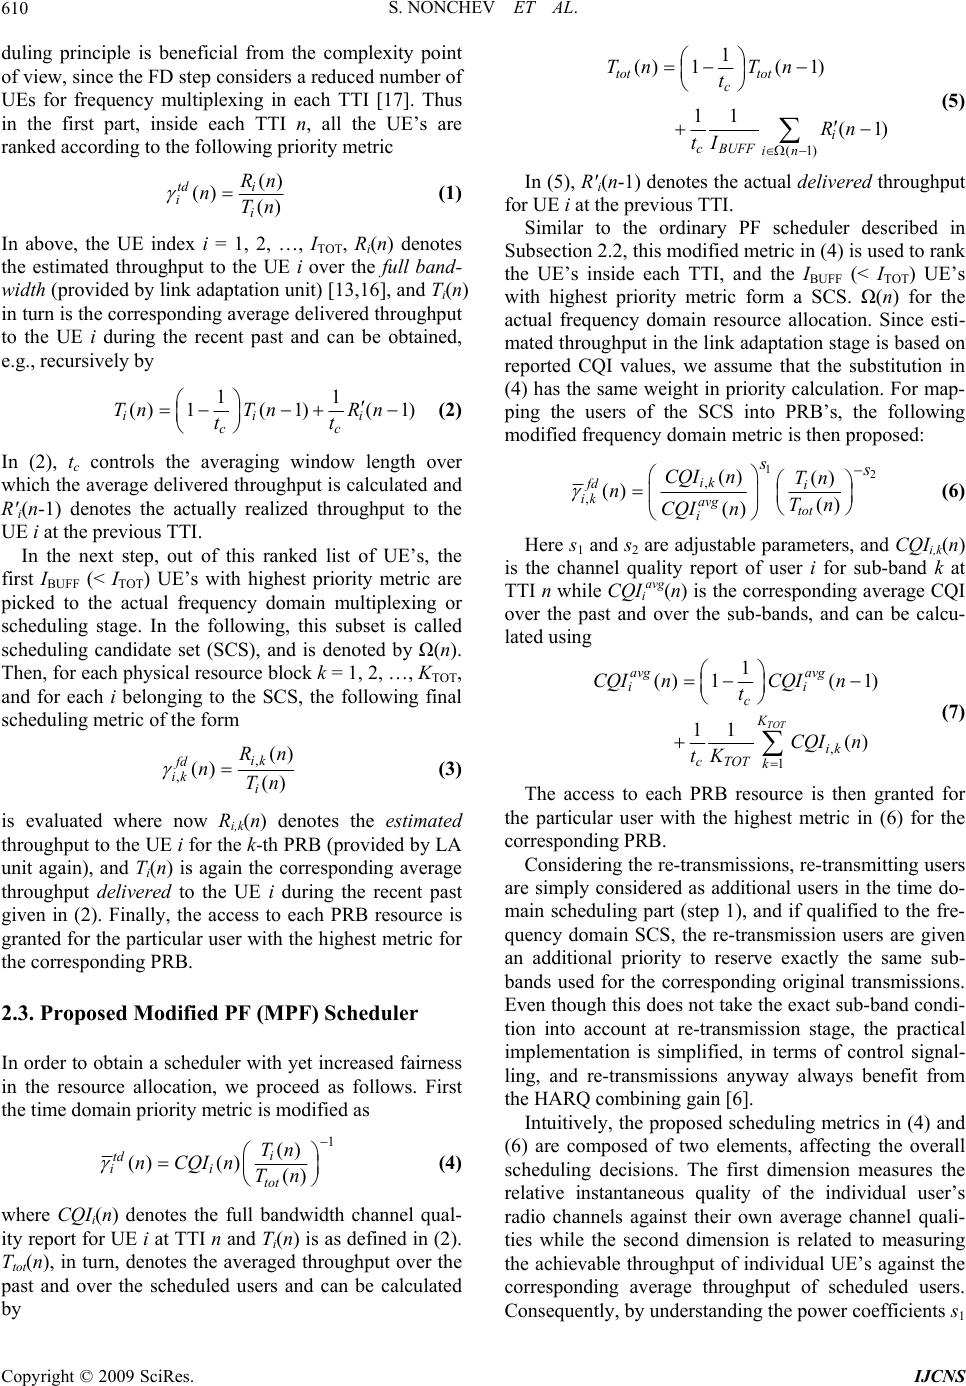 S. NONCHEV ET AL. 610 duling principle is beneficial from the complexity point of view, since the FD step considers a reduced number of UEs for frequency multiplexing in each TTI [17]. Thus in the first part, inside each TTI n, all the UE’s are ranked according to the following priority metric () () () i td i i Rn nTn (1) In above, the UE index i = 1, 2, …, ITOT, Ri(n) denotes the estimated throughput to the UE i over the full band- width (provided by link adaptation unit) [13,16], and Ti(n) in turn is the corresponding average delivered throughput to the UE i during the recent past and can be obtained, e.g., recursively by 11 ()1( 1)( 1) iii cc TnTn Rn tt (2) In (2), tc controls the averaging window length over which the average delivered throughput is calculated and R'i(n-1) denotes the actually realized throughput to the UE i at the previous TTI. In the next step, out of this ranked list of UE’s, the first IBUFF (< ITOT) UE’s with highest priority metric are picked to the actual frequency domain multiplexing or scheduling stage. In the following, this subset is called scheduling candidate set (SCS), and is denoted by Ω(n). Then, for each physical resource block k = 1, 2, …, KTOT, and for each i belonging to the SCS, the following final scheduling metric of the form , , () () () ik fd ik i Rn nTn (3) is evaluated where now Ri,k(n) denotes the estimated throughput to the UE i for the k-th PRB (provided by LA unit again), and Ti(n) is again the corresponding average throughput delivered to the UE i during the recent past given in (2). Finally, the access to each PRB resource is granted for the particular user with the highest metric for the corresponding PRB. 2.3. Proposed Modified PF (MPF) Scheduler In order to obtain a scheduler with yet increased fairness in the resource allocation, we proceed as follows. First the time domain priority metric is modified as 1 () ()() () i td ii tot Tn nCQIn Tn (4) where CQIi(n) denotes the full bandwidth channel qual- ity report for UE i at TTI n and Ti(n) is as defined in (2). Ttot(n), in turn, denotes the averaged throughput over the past and over the scheduled users and can be calculated by (1) 1 ()1( 1) 11 (1 tot tot c i cBUFF in Tn Tn t Rn tI ) (5) In (5), R'i(n-1) denotes the actual delivered throughput for UE i at the previous TTI. Similar to the ordinary PF scheduler described in Subsection 2.2, this modified metric in (4) is used to rank the UE’s inside each TTI, and the IBUFF (< ITOT) UE’s with highest priority metric form a SCS. Ω(n) for the actual frequency domain resource allocation. Since esti- mated throughput in the link adaptation stage is based on reported CQI values, we assume that the substitution in (4) has the same weight in priority calculation. For map- ping the users of the SCS into PRB’s, the following modified frequency domain metric is then proposed: 12 , , () () () () () ik fd i ik avg tot i s CQI nTn nTn CQI n (6) Here s1 and s2 are adjustable parameters, and CQIi,k(n) is the channel quality report of user i for sub-band k at TTI n while CQIi avg(n) is the corresponding average CQI over the past and over the sub-bands, and can be calcu- lated using , 1 1 ()1( 1) 11 () TOT avg avg ii c K ik cTOT k CQI nCQI n t CQI n tK (7) The access to each PRB resource is then granted for the particular user with the highest metric in (6) for the corresponding PRB. Considering the re-transmissions, re-transmitting users are simply considered as additional users in the time do- main scheduling part (step 1), and if qualified to the fre- quency domain SCS, the re-transmission users are given an additional priority to reserve exactly the same sub- bands used for the corresponding original transmissions. Even though this does not take the exact sub-band condi- tion into account at re-transmission stage, the practical implementation is simplified, in terms of control signal- ling, and re-transmissions anyway always benefit from the HARQ combining gain [6]. Intuitively, the proposed scheduling metrics in (4) and (6) are composed of two elements, affecting the overall scheduling decisions. The first dimension measures the relative instantaneous quality of the individual user’s radio channels against their own average channel quali- ties while the second dimension is related to measuring the achievable throughput of individual UE’s against the corresponding average throughput of scheduled users. Consequently, by understanding the power coefficients s1 Copyright © 2009 SciRes. IJCNS  S. NONCHEV ET AL. 611 v and s2 as additional adjustable parameters, the exact scheduler statistics can be tuned and controlled to obtain a desired balance between the throughput and fairness. This will be demonstrated in Section 5. 3. Feedback Reporting Process The overall reporting process between UE’s and BS is illustrated in Figure 2. Within each time window of length tr, each mobile sends channel quality indicator (CQI) reports to BS, formatted and possibly compressed, with a reporting delay of td seconds [6,8,10,11]. Each report is naturally subject to errors due to imperfect de- coding of the received signal. In general, the CQI re- porting frequency-resolution has a direct impact on the achievable multi-user frequency diversity and thereon to the overall system performance and the efficiency of radio resource management (RRM), as described in gen- eral e.g. in [11]. In our studies here, the starting point (reference case) is that the CQI reports are quantized SINR measurements across the entire bandwidth (wide- band CQI reporting), to take advantage of the time and frequency variations of the radio channels for the differ- ent users. Then also alternative reduced feedback schemes are described and evaluated, as discussed be- low. 3.1. Full CQI Reporting In a general OFDMA radio system, the overall system bandwidth is assumed to be divided into v CQI meas- urement blocks. Then quantizing the CQI values to q bits, the overall full CQI report size is full Sq (8) bits which is reported by every UE for each TTI [1–3,11]. In case of LTE, with 10 MHz system bandwidth and grouping 2 physical resource blocks into 1 measurement Figure 2. Reporting mechanism between UE and BS. block, it follows that v = 25. Assuming further that quan- tization is carried with q = 5 bits, then each UE is send ing 25x5 = 125 bits for every 1ms (TTI length). 3.2. Best-m CQI Reporting One simple approach to reduce the reporting and feed- back signalling is obtained as follows. The method is based on selecting only m < v different CQI measure- ments and reporting them together with their frequency positions to the serving cell [8,11]. We assume here that the evaluation criteria for choosing those m sub-bands for reporting is based on the highest SINR values (hence the name best-m). The resulting report size in bits is then given by 2 ! log !( )! best m v Sqm mv m v (9) As an example, with v = 25, q= 5 bits and m = 10, it follows that Sbest-m = 72 bits, while Sfull = 125 bits. Fur- thermore, on the scheduler side, we assume that the PRBs which are not reported by the UE are allocated a CQI value equal to the lowest reported one. 3.3. Threshold Based CQI Reporting This reporting scheme is a further simplification and relies on providing information on only the average CQI value above certain threshold together with the corre- sponding location (sub-band index) information. First the highest CQI value is identified within the full bandwidth, which sets an upper bound of the used threshold window. All CQI values within the threshold window are then averaged and only this information is sent to the BS to- gether with the corresponding sub-band indexes. On the scheduler side, the missing CQI values can then be treated, e.g., as the reported averaged CQI value minus a given dB offset (e.g. 5 dB, the exact number is again a design parameter). The number of bits needed for re- porting is therefore only threshold Sq=+ (10) As an example, with v = 25 and q = 5 bits (as above), it follows that Sthreshold = 30 bits, while Sbest-m = 72 bits and Sfull = 125 bits. The threshold-based scheme is illus- trated graphically in Figure 3 [10]. 4. System Simulation Model and Assumptions In order to evaluate the system-level performance of the proposed scheduling scheme in a practical OFDMA-based cellular system context, a comprehensive quasi-static sys- tem simulator for LTE downlink has been developed, Copyright © 2009 SciRes. IJCNS  S. NONCHEV ET AL. 612 Figure 3. Basic principle of threshold-based CQI reporting. conforming to the specifications in [1–3]. In the overall simulation flow, mobile stations are first randomly dropped or positioned over each sector and cell. Then based on the individual distances between the mobiles and the serving base station, the path losses for individ- ual links are directly determined, while the actual fading characteristics of the radio channels depend on the as- sumed mobility and power delay profile. In updating the fading statistics, the time resolution in our simulator is set to one TTI (1ms). In general, a standard hexagonal cellular layout is utilized with altogether 19 cell sites each having 3 sectors. In the performance evaluations, statistics are collected only from the central cell site while the others simply act as sources of inter-cell inter- ference. As a practical example case, the 10 MHz LTE system bandwidth mode [1–3] is assumed. The main simulation parameters and assumptions are generally summarized in Table 1 for the so-called Macro cell case 1, following again the LTE working assumptions. As illustrated in Figure 1, the RRM functionalities are controlled by the packet scheduler and also link adaptation and HARQ mechanisms are modelled and implemented, as described in Table 1. As a practical example, the maximum number of simultaneously multiplexed users (IBUFF) is set to 10 here. In general, we assume that the BS transmission power is equally distributed among all PRB’s. In the basic simulations, 20 UE’s are uniformly dropped within each sector and experience inter-cell interferences from the surrounding cells, in addition to path loss and fading. The UE velocity equals 3km/h, and the typical urban (TU) channel model standardized by ITU is assumed in modelling the power-delay spread of the radio channels. Infinite buffer traffic model is applied in the simulations, i.e. every user has data to transmit (when scheduled) for the entire duration of a simulation cycle. The length of a single simulation run is set to 5 seconds which is then repeated for 10 times to collect reliable statistics. In general, every UE has an individual HARQ entry, Table 1. Basic simulation parameters. Parameter Assumption Cellular Layout Hexagonal grid, 19 cell sites 3 sectors er site Inter-site distance 500 m Carrier Frequency / Bandwidth Number of active sub-carriers Sub-carrier spacing Sub-frame duration 2000 MHz / 10 MHz 600 15 kHz 0.5 ms Channel estimation Ideal PDP ITU Typical Urban 20 paths Minimum distance between UE and cell >= 35 meters Average number of UE’s per sector 20 Max. number of frequency multi- lexed UEs I 10 UE receiver type 2-Rx MRC, 2-Rx IRC Shadowing standard deviation 8 dB UE speed 3km/h Total BS TX power (Ptotal) 46dBm Traffic model Full Buffer Fast Fading Model Jakes Spectrum CQI reporting schemes Full CQI Best-m (with m=10) Threshold based (with 5dB threshold) CQI log-normal error std. 1 dB CQI reporting time 5 TTI CQI delay CQI quantization CQI std error 2 TTIs 1 dB 1 dB MCS rates QPSK (1/3, 1/2, 2/3), 16QAM (1/2, 2/3, 4/5), 64QAM (1/2, 2/3, 4/5) ACK/NACK delay 2ms Number of SAW channels 6 Maximum number of retransmisions 3 HARQ model Ideal chase combining (CC) 1st transmission BLER target 20% Scheduler forgetting factor 0.002 Scheduling schemes used Ordinary PF (for reference) Modified PF ro osed Simulation duration (one drop) 5 seconds Number of drops 10 which operates the physical layer re-transmission func- tionalities. It is based on the stop-and-wait (SAW) pro- tocol and for simplicity, the number of entries per UE is fixed to six. HARQ retransmissions are always transmit- ted with the same MCS and on the same PRB’s (if scheduled in TD step) as the first transmissions. The supported modulation schemes are QPSK, 16QAM and 64QAM with variable rates for the encoder as shown in Table 1. Link adaptation handles the received UE reports con- Copyright © 2009 SciRes. IJCNS 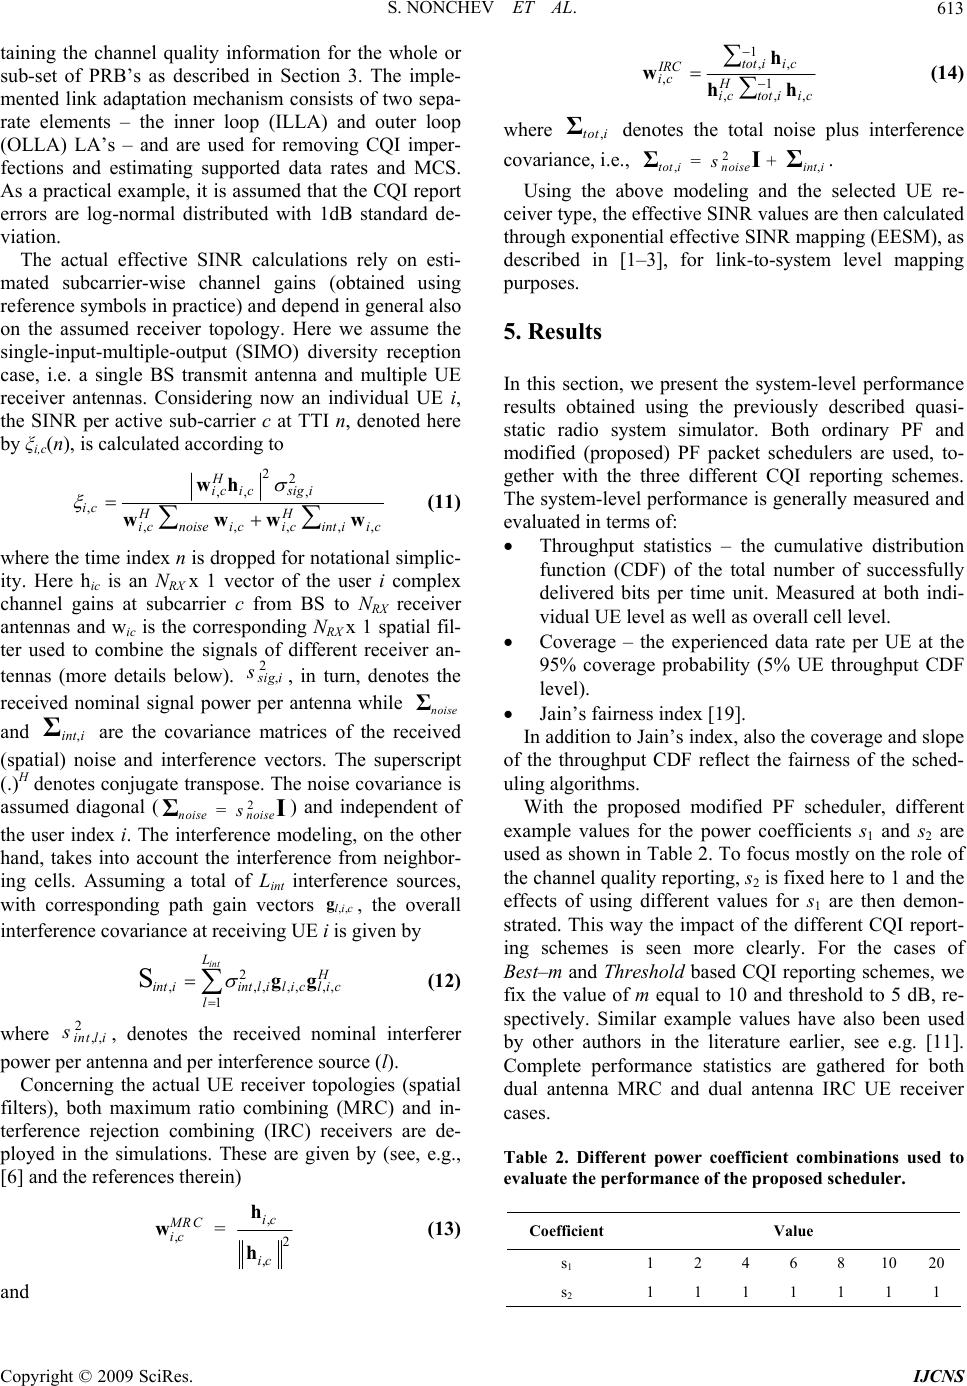 S. NONCHEV ET AL. Copyright © 2009 SciRes. IJCNS 613 taining the channel quality information for the whole or sub-set of PRB’s as described in Section 3. The imple- mented link adaptation mechanism consists of two sepa- rate elements – the inner loop (ILLA) and outer loop (OLLA) LA’s – and are used for removing CQI imper- fections and estimating supported data rates and MCS. As a practical example, it is assumed that the CQI report errors are log-normal distributed with 1dB standard de- viation. 1,, ,1 ,, tot ii c IRC ic H ictoti ic , h whh (14) where denotes the total noise plus interference covariance, i.e., . ,tot i Σ 2 ,,tot inoise s=+Iint i ΣΣ Using the above modeling and the selected UE re- ceiver type, the effective SINR values are then calculated through exponential effective SINR mapping (EESM), as described in [1–3], for link-to-system level mapping purposes. The actual effective SINR calculations rely on esti- mated subcarrier-wise channel gains (obtained using reference symbols in practice) and depend in general also on the assumed receiver topology. Here we assume the single-input-multiple-output (SIMO) diversity reception case, i.e. a single BS transmit antenna and multiple UE receiver antennas. Considering now an individual UE i, the SINR per active sub-carrier c at TTI n, denoted here by ξi,c(n), is calculated according to 5. Results In this section, we present the system-level performance results obtained using the previously described quasi- static radio system simulator. Both ordinary PF and modified (proposed) PF packet schedulers are used, to- gether with the three different CQI reporting schemes. The system-level performance is generally measured and evaluated in terms of: 22 ,, , , ,,,, H ic icsigi ic HH icnoiseicicinti ic wh www , w (11) Throughput statistics – the cumulative distribution function (CDF) of the total number of successfully delivered bits per time unit. Measured at both indi- vidual UE level as well as overall cell level. where the time index n is dropped for notational simplic- ity. Here hic is an NRX x 1 vector of the user i complex channel gains at subcarrier c from BS to NRX receiver antennas and wic is the corresponding NRX x 1 spatial fil- ter used to combine the signals of different receiver an- tennas (more details below). 2, ig i s 2 noise sI , in turn, denotes the received nominal signal power per antenna while and are the covariance matrices of the received (spatial) noise and interference vectors. The superscript (.)H denotes conjugate transpose. The noise covariance is assumed diagonal () and independent of the user index i. The interference modeling, on the other hand, takes into account the interference from neighbor- ing cells. Assuming a total of Lint interference sources, with corresponding path gain vectors Coverage – the experienced data rate per UE at the 95% coverage probability (5% UE throughput CDF level). noise Σ ,int i Σ noise =Σ ,,lic , the overall interference covariance at receiving UE i is given by Jain’s fairness index [19]. In addition to Jain’s index, also the coverage and slope of the throughput CDF reflect the fairness of the sched- uling algorithms. With the proposed modified PF scheduler, different example values for the power coefficients s1 and s2 are used as shown in Table 2. To focus mostly on the role of the channel quality reporting, s2 is fixed here to 1 and the effects of using different values for s1 are then demon- strated. This way the impact of the different CQI report- ing schemes is seen more clearly. For the cases of Best–m and Threshold based CQI reporting schemes, we fix the value of m equal to 10 and threshold to 5 dB, re- spectively. Similar example values have also been used by other authors in the literature earlier, see e.g. [11]. Complete performance statistics are gathered for both dual antenna MRC and dual antenna IRC UE receiver cases. S2 ,,,,, 1 int L H intiintli lic lic l gg ,, (12) where , denotes the received nominal interferer power per antenna and per interference source (l). 2,,int l i s Concerning the actual UE receiver topologies (spatial filters), both maximum ratio combining (MRC) and in- terference rejection combining (IRC) receivers are de- ployed in the simulations. These are given by (see, e.g., [6] and the references therein) Table 2. Different power coefficient combinations used to evaluate the performance of the proposed scheduler. , ,2 , ic MRC ic ic =h w h (13) Coefficient Value s1 1 2 4 6 8 10 20 s2 1 1 1 1 1 1 1 and 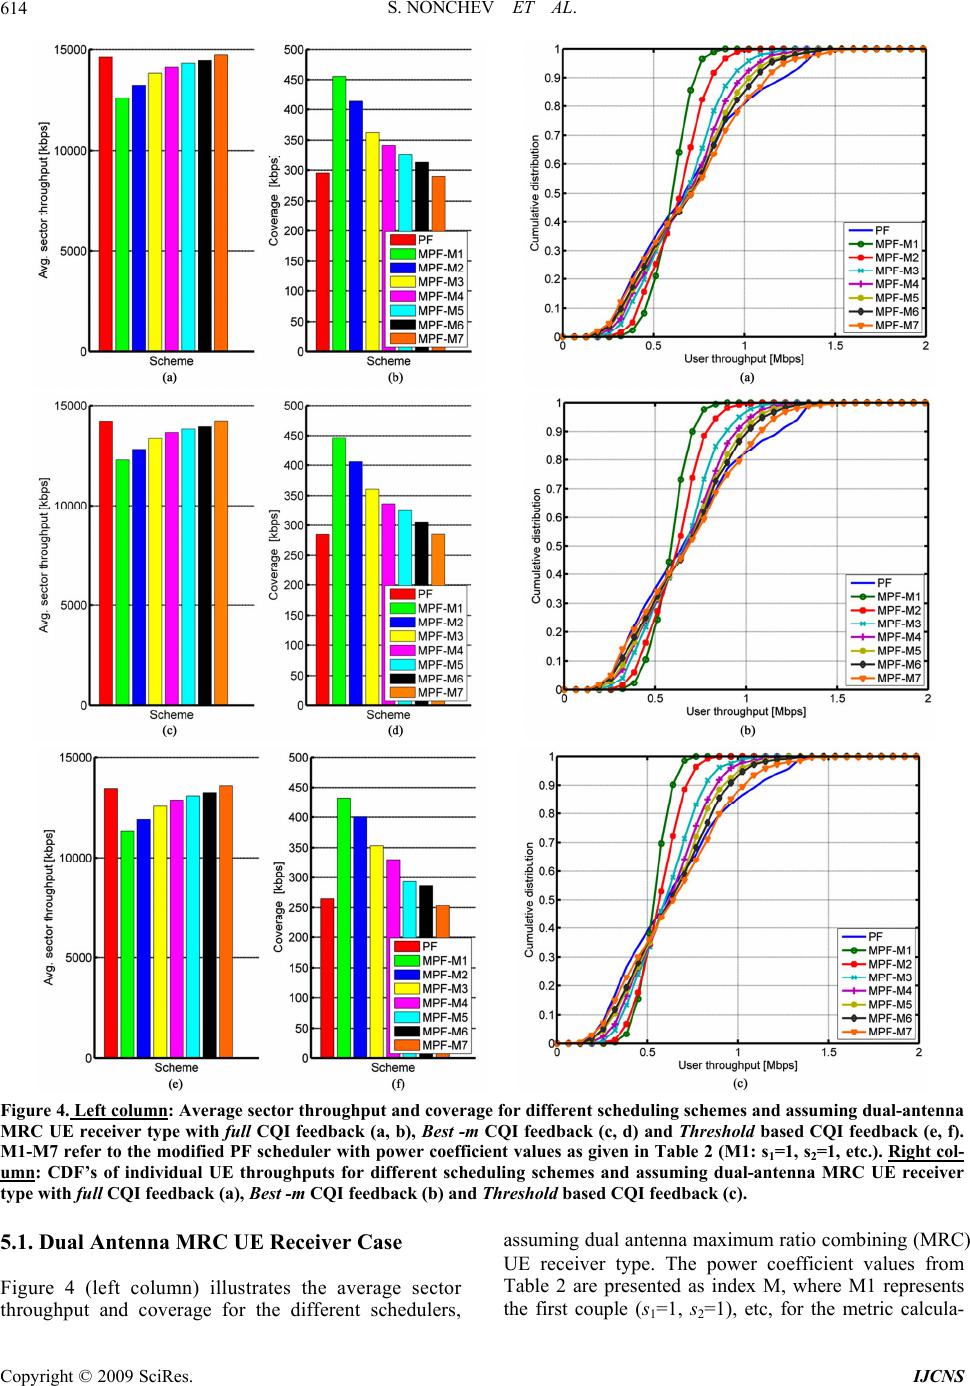 S. NONCHEV ET AL. 614 Figure 4. Left column: Average sector throughput and coverage for different scheduling schemes and assuming dual-antenna MRC UE receiver type with full CQI feedback (a, b), Best -m CQI feedback (c, d) and Threshold based CQI feedback (e, f). M1-M7 refer to the modified PF scheduler with power coefficient values as given in Table 2 (M1: s1=1, s2=1, etc.). Right col- umn: CDF’s of individual UE throughputs for different scheduling schemes and assuming dual-antenna MRC UE receiver type with full CQI feedback (a), Best -m CQI feedback (b) and Threshold based CQI feedback (c). 5.1. Dual Antenna MRC UE Receiver Case Figure 4 (left column) illustrates the average sector throughput and coverage for the different schedulers, assuming dual antenna maximum ratio combining (MRC) UE receiver type. The power coefficient values from Table 2 are presented as index M, where M1 represents the first couple (s1=1, s2=1), etc, for the metric calcula- Copyright © 2009 SciRes. IJCNS 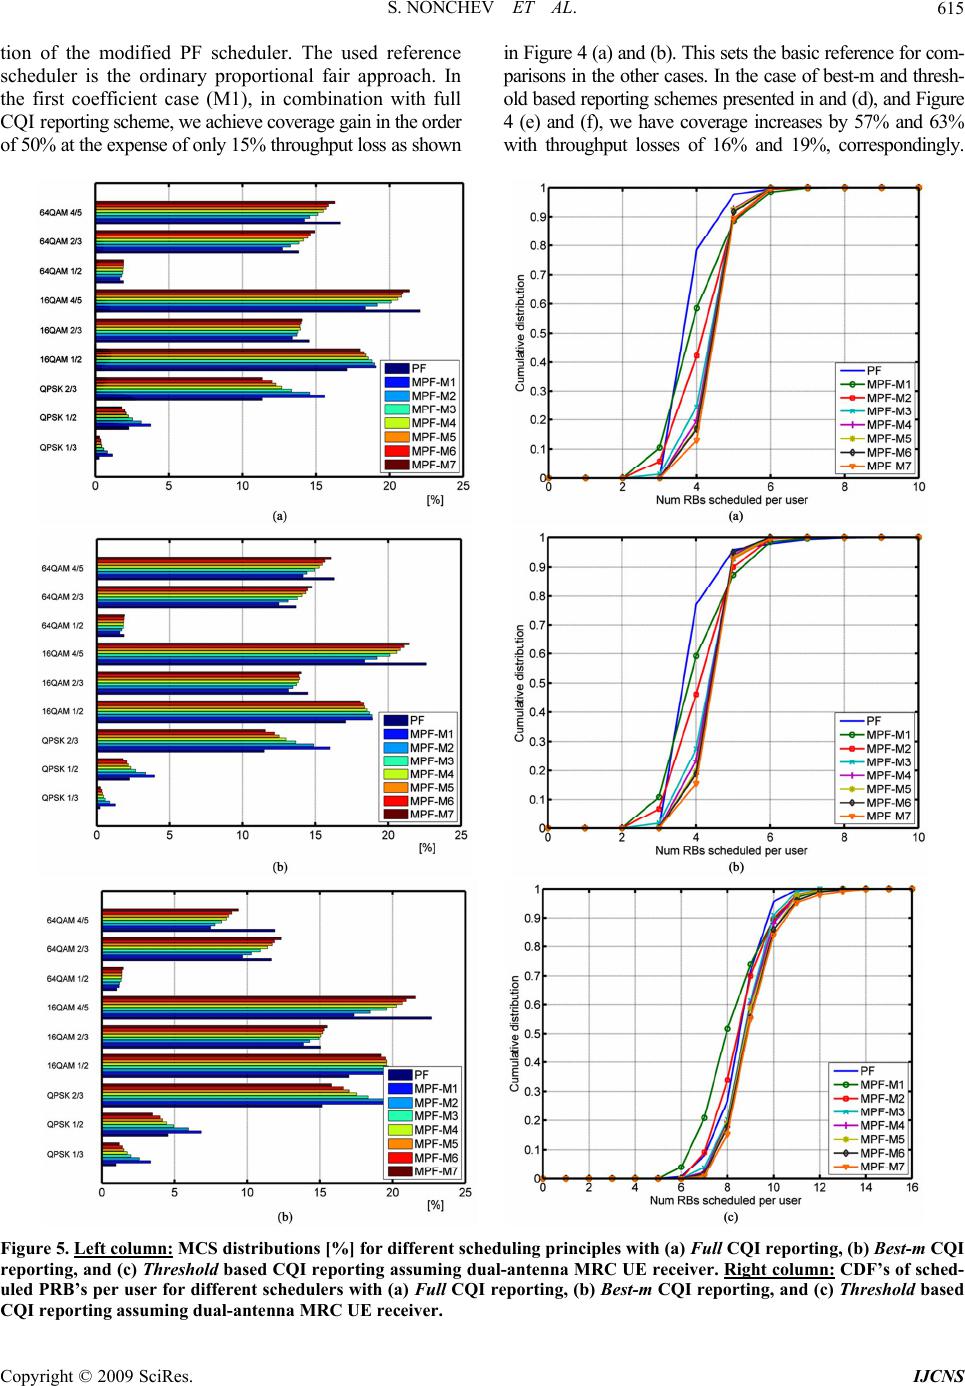 S. NONCHEV ET AL. 615 tion of the modified PF scheduler. The used reference scheduler is the ordinary proportional fair approach. In the first coefficient case (M1), in combination with full CQI reporting scheme, we achieve coverage gain in the order of 50% at the expense of only 15% throughput loss as shown in Figure 4 (a) and (b). This sets the basic reference for com- parisons in the other cases. In the case of best-m and thresh- old based reporting schemes presented in and (d), and Figure 4 (e) and (f), we have coverage increases by 57% and 63% with throughput losses of 16% and 19%, correspondingly. Figure 5. Left column: MCS distributions [%] for different scheduling principles with (a) Full CQI reporting, (b) Best-m CQI reporting, and (c) Threshold based CQI reporting assuming dual-antenna MRC UE receiver. Right column: CDF’s of sched- uled PRB’s per user for different schedulers with (a) Full CQI reporting, (b) Best-m CQI reporting, and (c) Threshold based CQI reporting assuming dual-antenna MRC UE receiver. Copyright © 2009 SciRes. IJCNS 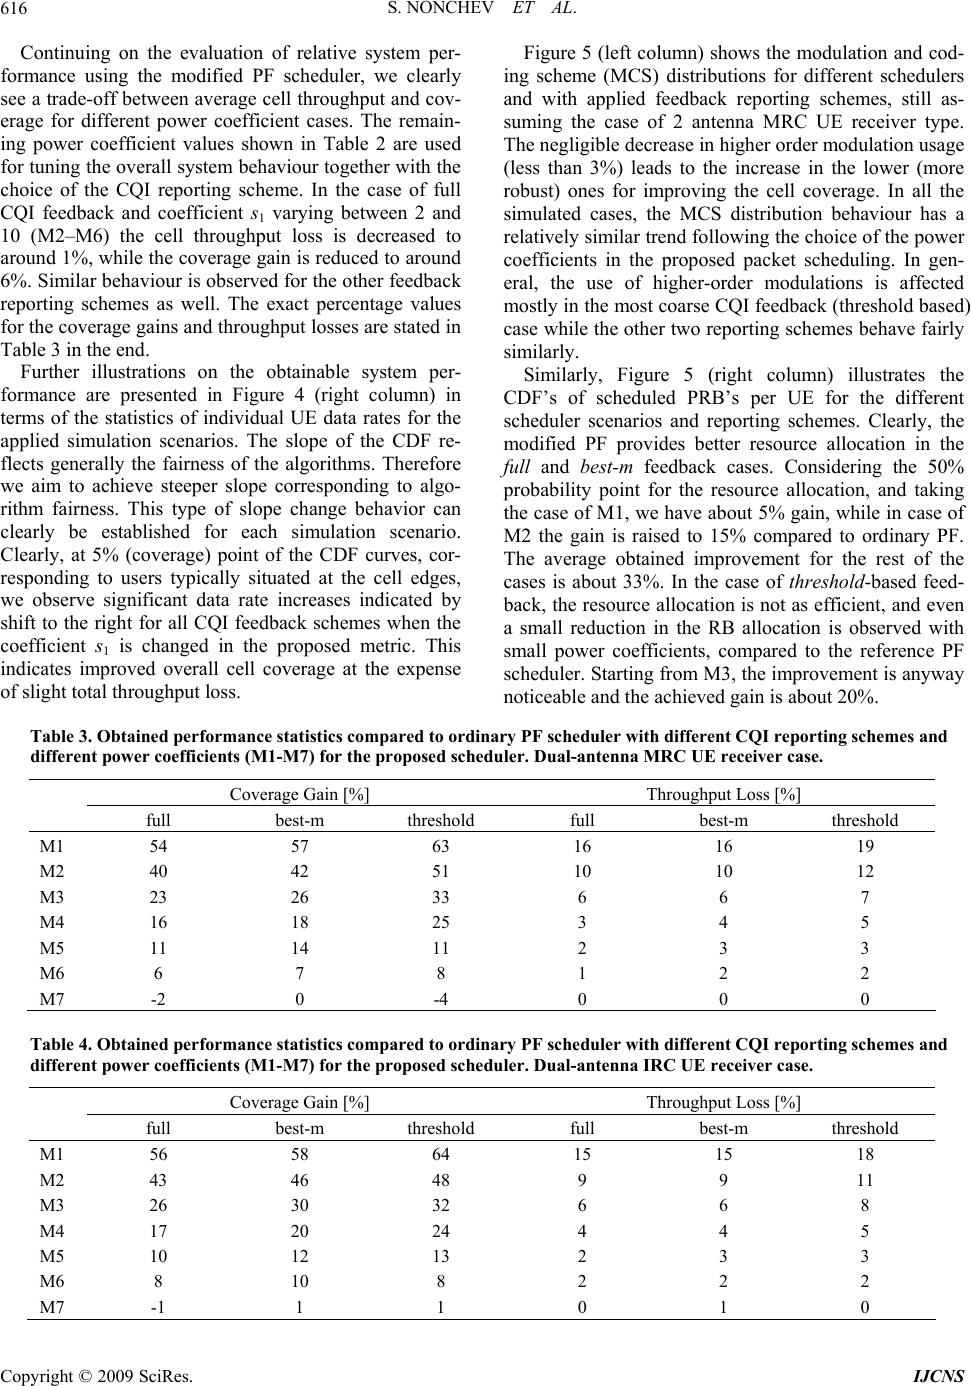 S. NONCHEV ET AL. 616 Continuing on the evaluation of relative system per- formance using the modified PF scheduler, we clearly see a trade-off between average cell throughput and cov- erage for different power coefficient cases. The remain- ing power coefficient values shown in Table 2 are used for tuning the overall system behaviour together with the choice of the CQI reporting scheme. In the case of full CQI feedback and coefficient s1 varying between 2 and 10 (M2–M6) the cell throughput loss is decreased to around 1%, while the coverage gain is reduced to around 6%. Similar behaviour is observed for the other feedback reporting schemes as well. The exact percentage values for the coverage gains and throughput losses are stated in Table 3 in the end. Further illustrations on the obtainable system per- formance are presented in Figure 4 (right column) in terms of the statistics of individual UE data rates for the applied simulation scenarios. The slope of the CDF re- flects generally the fairness of the algorithms. Therefore we aim to achieve steeper slope corresponding to algo- rithm fairness. This type of slope change behavior can clearly be established for each simulation scenario. Clearly, at 5% (coverage) point of the CDF curves, cor- responding to users typically situated at the cell edges, we observe significant data rate increases indicated by shift to the right for all CQI feedback schemes when the coefficient s1 is changed in the proposed metric. This indicates improved overall cell coverage at the expense of slight total throughput loss. Figure 5 (left column) shows the modulation and cod- ing scheme (MCS) distributions for different schedulers and with applied feedback reporting schemes, still as- suming the case of 2 antenna MRC UE receiver type. The negligible decrease in higher order modulation usage (less than 3%) leads to the increase in the lower (more robust) ones for improving the cell coverage. In all the simulated cases, the MCS distribution behaviour has a relatively similar trend following the choice of the power coefficients in the proposed packet scheduling. In gen- eral, the use of higher-order modulations is affected mostly in the most coarse CQI feedback (threshold based) case while the other two reporting schemes behave fairly similarly. Similarly, Figure 5 (right column) illustrates the CDF’s of scheduled PRB’s per UE for the different scheduler scenarios and reporting schemes. Clearly, the modified PF provides better resource allocation in the full and best-m feedback cases. Considering the 50% probability point for the resource allocation, and taking the case of M1, we have about 5% gain, while in case of M2 the gain is raised to 15% compared to ordinary PF. The average obtained improvement for the rest of the cases is about 33%. In the case of threshold-based feed- back, the resource allocation is not as efficient, and even a small reduction in the RB allocation is observed with small power coefficients, compared to the reference PF scheduler. Starting from M3, the improvement is anyway noticeable and the achieved gain is about 20%. Table 3. Obtained performance statistics compared to ordinary PF scheduler with different CQI reporting schemes and different power coefficients (M1-M7) for the proposed scheduler. Dual-antenna MRC UE receiver case. Coverage Gain [%] Throughput Loss [%] full best-m threshold full best-m threshold M1 54 57 63 16 16 19 M2 40 42 51 10 10 12 M3 23 26 33 6 6 7 M4 16 18 25 3 4 5 M5 11 14 11 2 3 3 M6 6 7 8 1 2 2 M7 -2 0 -4 0 0 0 Table 4. Obtained performance statistics compared to ordinary PF scheduler with different CQI reporting schemes and different power coefficients (M1-M7) for the proposed scheduler. Dual-antenna IRC UE receiver case. Coverage Gain [%] Throughput Loss [%] full best-m threshold full best-m threshold M1 56 58 64 15 15 18 M2 43 46 48 9 9 11 M3 26 30 32 6 6 8 M4 17 20 24 4 4 5 M5 10 12 13 2 3 3 M6 8 10 8 2 2 2 M7 -1 1 1 0 1 0 Copyright © 2009 SciRes. IJCNS  S. NONCHEV ET AL. 617 5.2. Dual Antenna IRC UE Receiver Case Next similar performance statistics are obtained for dual antenna interference rejection combining (IRC) UE re- ceiver case. Starting from the primary case M1, with full CQI, we obtain a 13% loss in throughput and 57% cov- erage improvement. For the reduced feedback reporting schemes – best-m and threshold based – we have 13% and 15% throughput losses and 58% and 62% coverage gains, respectively. Furthermore, resource allocation gains for full CQI feedback and best-m are 7% for M1 and 17% for M2 correspondingly. The average obtained improvement for the rest of the cases is about 34%. Threshold based reporting scheme leads to decrease of 12% for M1 and 7% for M2, and roughly 14% increase for the rest of simulated cases. The exact percentage Figure 6. Jain’s fairness index per feedback reporting scheme for dual-antenna MRC UE receiver case (up) and dual-antenna IRC UE receiver case (down). Scheduler type 1 means ordinary PF, while 2-8 means proposed modified PF with power coefficients as described in Table 2. read from the figures are again stated in table format in Table 4 in the end. 5.3. Fairness Index Figure 6 illustrates the Jain’s fairness index per scheduler for the applied feedback reporting schemes, calculated over all the ITOT = 20 UE’s using the truly realized UE throughputs at each TTI and over all the simulation runs. The value on the x-axis corresponds to the used sched- uler type, where 1 refers to the reference PF scheduler and 2-8 refer to the proposed modified PF schedulers with different power coefficients. The Jain’s fairness index defined in [19] is generally in the range of [0…1], where the value of 1 corresponds to all users having the same amount of resources (maximum fairness). Clearly, the fairness distribution with the proposed modified PF scheduler outperforms the used reference PF scheduler for both UE receiver types. The received fairness gains are in range of 2%-17% for the MRC receiver case, and 1%-14% for the IRC receiver case, respectively. 6. Conclusions In this article, we have studied the potential of advanced packet scheduling principles in OFDMA type radio sys- tem context, using UTRAN long term evolution (LTE) as a practical example system scenario. A modified propor- tional fair scheduler taking both the instantaneous chan- nel qualities (CQI’s) as well as resource allocation fair- ness into account was proposed. Also different practical CQI reporting schemes were discussed, and used in the system level performance evaluations of the proposed scheduler. All the performance evaluations were carried out with a comprehensive quasi-static system level simu- lator, conforming fully to the current LTE working as- sumptions. Also different UE receiver types were dem- onstrated in the performance assessments. In general, the achieved throughput and coverage gains were assessed against more traditional ordinary proportional fair sched- uling. In the case of fixed coverage requirements and based on the optimal parameter choice for CQI reporting schemes, the proposed scheduling metric calculations based on UE channel feedback offers better control over the ratio between the achievable cell/UE throughput and coverage increase. As a practical example, even with limited CQI feedback, the cell coverage can be increased significantly (more than 30%) by allowing a small de- crease (in the order of only 5-10%) in the cell throughput. This is seen to give great flexibility to the overall RRM process and optimization. 7. Acknowledgments Fruitful discussions with Markku Kuusela, Nokia De- vices, Helsinki, Finland, and Dr. Toni Huovinen, Tam- Copyright © 2009 SciRes. IJCNS  S. NONCHEV ET AL. Copyright © 2009 SciRes. IJCNS 618 pere University of Technology, Tampere, Finland, are greatly acknowledged. 8. References [1] 3GPP RAN Technical Specification Group, “E-UTRA/ E-UTRAN Overall description, stage 2,” Technical Re- port TR 36.300, ver. 9.0.0, June 2009. [2] 3GPP RAN Technical Specification Group, “E-UTRA/ LTE physical layer—General description,” Technical Report TR 36.201, ver. 8.3.0, March 2009. [3] 3GPP RAN Technical Specification Group, “Physical layer aspects for evolved UTRA,” Technical Report TR 25.814, ver. 7.1.0, Oct. 2006. [4] N. D. Tripathi, et al., “Radio resource management in cellular systems,” Springer, 2001. [5] H. Holma and A. Toskala, Eds., “HSDPA/HSUPA for UMTS–High speed radio access for mobile communica- tions,” Wiley, 2006. [6] E. Dahlman, et al., “3G evolution: HSPA and LTE for mobile broadband,” Academic Press, 2007. [7] S. Yoon, C. Suh, Y. Cho, and D. Park, “Orthogonal fre- quency division multiple access with an aggregated sub- channel structure and statistical channel quality meas- urements,” in Proc. IEEE Vehicular Technology Confer- ence (VTC’04 Fall), Los Angeles, CA, September 2004. [8] Y. Sun, et al., “Multi-user scheduling for OFDMA downlink with limited feedback for evolved UTRA,” in Proc. IEEE Vehicular Technology Conference (VTC’06 Fall), Montreal, Canada, September 2006. [9] I. Toufik and H. Kim, “MIMO-OFDMA opportunistic beamforming with partial channel state information,” in Proc. IEEE International Conference on Communications, Instanbul, Turkey, pp. 5389–5394, June 2006. [10] T. E. Kolding, F. Frederiksen, and A. Pokhariyal, “Low- bandwidth channel quality indication for OFDMA fre- quency domain packet scheduling,” in Proc. ISWCS’06, Spain, September 2006. [11] K. I. Pedersen, G. Monghal, I. Z. Kovacs, T. E. Kolding, A. Pokhariyal, F. Frederiksen, and P. Mogensen, “Fre- quency domain scheduling for OFDMA with limited and noisy channel feedback,” in Proc. IEEE Vehicular Tech- nology Conference (VTC’07 Fall), Baltimore, MD, pp. 1792–1796, Sept. 2007. [12] P. Svedman, D. Hammarwall, and B. Ottersten, “Sub- carrier SNR estimation at the transmitter for reduced feedback OFDMA,” in Proc. European Signal Processing Conf., Florence, Italy, September 2006. [13] C. Wengerter, J. Ohlhorst, and A. G. E Von Elbwert,” Fairness and throughput analysis for generalized propor- tional fair frequency scheduling in OFDMA,” in Proc. IEEE Vehicular Technology Conference (VTC’ 05 Spring), Stockholm, Sweden, May 2005. [14] S. Nonchev, J. Venäläinen, and M. Valkama, “New fre- quency domain packet scheduling schemes for UTRAN LTE Downlink,” in Proc. ICT Mobile Summit, Stock- holm, Sweden, June 2008. [15] S. Nonchev and M. Valkama, “Efficient packet schedul- ing schemes for multiantenna packet radio downlink,” in Proc. Fifth Advanced Int. Conf. Telecommunications (AICT’09), Venice, Italy, May 2009. [16] T. E. Kolding, “Link and system performance aspects of proportional fair scheduling in WCDMA/HSDPA,” in Proc. IEEE Vehicular Technology Conference (VTC’03 Fall), Orlando, FL, pp. 1717–1723, Oct. 2003. [17] A. Pokhariyal, K. I. Pedersen, G. Monghal, I. Z. Kovacs, C. Rosa, T. E. Kolding, and P. E. Mogensen, “HARQ aware frequency domain packet scheduler with different degrees of fairness for the UTRAN long term evolution,” in Proc. IEEE Vehicular Technology Conference (VTC’ 07 Spring), Dublin, Ireland, April 2007, pp. 2761–2765. [18] A. Pokhariyal, T. E. Kolding, and P. E. Mogensen, “Per- formance of downlink frequency domain packet schedul- ing for the UTRAN long term evolution,” in Proc. IEEE Personal, Indoor and Mobile Radio Communications Conference (PIMRC’06), Helsinki, Finland, Sept. 2006. [19] D. Chui and R. Jain, “Analysis of the increase and de- crease algorithms for congestion avoidance in computer networks,” Computer Networks and ISDN Systems, 1989. [20] P. Svedman, S. K. Wilson, L. J. Cimini, and B. Ottersten, “A simplified opportunistic feedback and scheduling scheme for OFDMA,” in Proc. IEEE Vehicular Technol- ogy Conference (VTC’04 Spring), pp. 1878–1882, May 2004. [21] P. Svedman, L. J. Cimini, and B. Ottersten, “Using un- claimed sub-carriers in opportunistic OFDMA systems,” in Proc. IEEE Vehicular Technology Conference (VTC’ 06 Fall), Montreal, Canada, September 2006. [22] S. Sanayei, A. Nosratinia, and N. Aldhahir, “Opportunis- tic dynamic sub-channel allocation in multiuser OFDM networks with limited feedback,” in IEEE Proc. Inform. Theory Workshop, San Antonio, TX, pp. 182–186, Oc- tober 2004. [23] P. Morgensen, et al., “LTE capacity compared to the Shannon bound,” in Proc. IEEE Vehicular Technology Conference (VTC’07 Spring), Dublin, Ireland, April 2007.
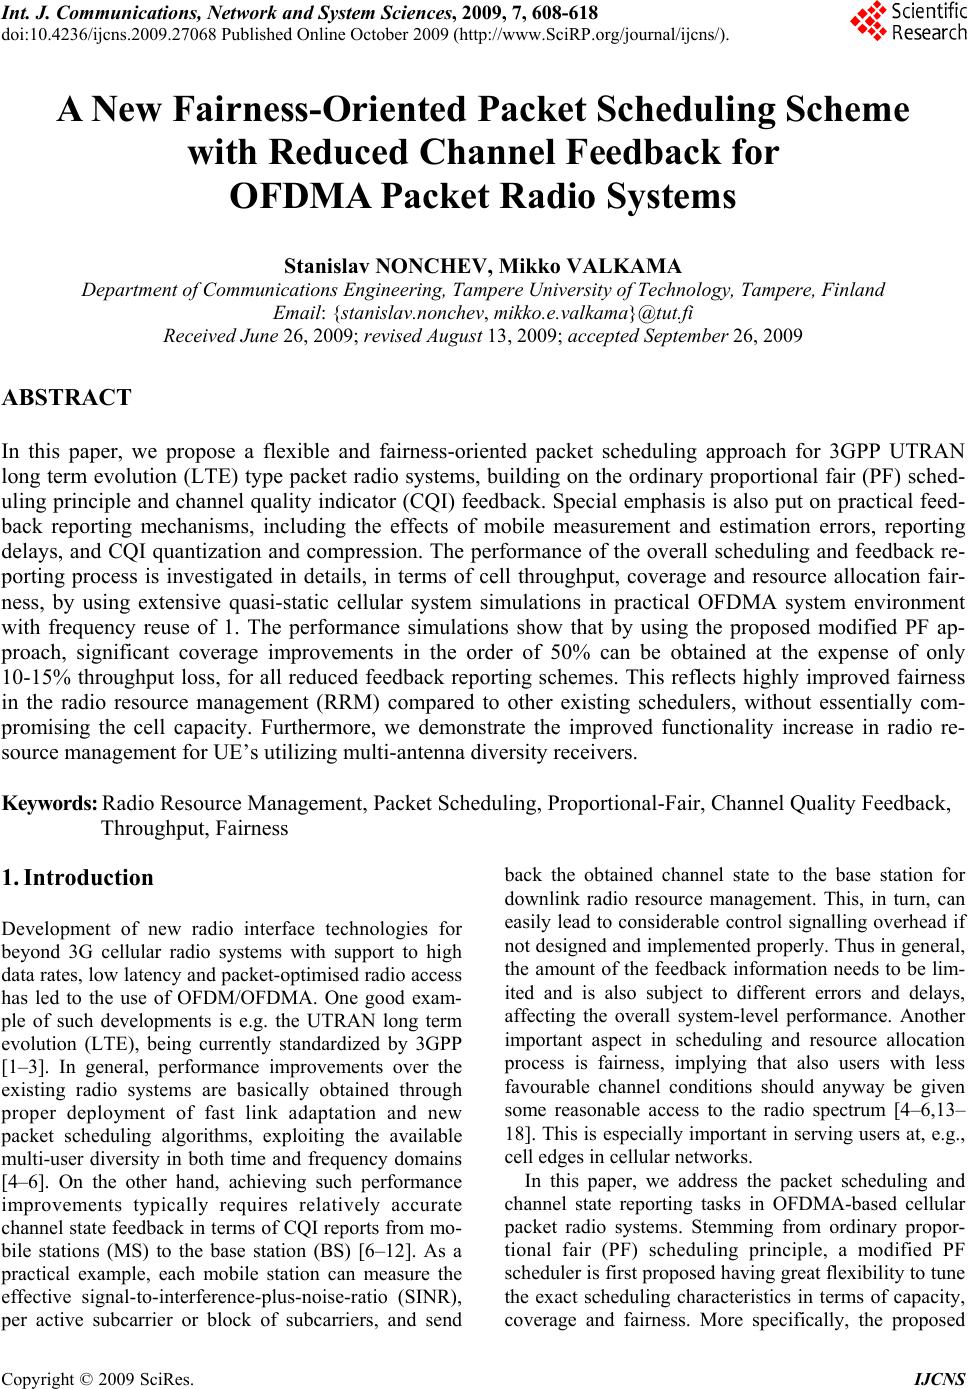
|