Paper Menu >>
Journal Menu >>
 Int. J. Communications, Network and System Sciences, 2009, 7, 600-607 doi:10.4236/ijcns.2009.27067 Published Online October 2009 (http://www.SciRP.org/journal/ijcns/). Copyright © 2009 SciRes. IJCNS Research on the Active DDoS Filtering Algorithm Based on IP Flow Rui GUO1, Hao YIN1, Dongqi WANG2, Bencheng ZHANG3 1Department of Com p ut er Sci ence an d Tech nology, Tsingh ua University, Beijing, C hi n a 2The Computing Center, Northeastern University, Shenyang, China 3Electronic Scouting and Commanding Department, College of Shenyang Artillery, Shenyang, China Email: gr@tsinghua.edu.cn Received May 22, 2009; revised July 7, 2009; accepted September 5, 2009 ABSTRACT Distributed Denial-of-Service (DDoS) attacks against public web servers are increasingly common. Coun- tering DDoS attacks are becoming ever more challenging with the vast resources and techniques increasingly available to attackers. It is impossible for the victim servers to work on the individual level of on-going traf- fic flows. In this paper, we establish IP Flow which is used to select proper features for DDoS detection. The IP flow statistics is used to allocate the weights for traffic routing by routers. Our system protects servers from DDoS attacks without strong client authentication or allowing an attacker with partial connectivity in- formation to repeatedly disrupt communications. The new algorithm is thus proposed to get efficiently maximum throughput by the traffic filtering, and its feasibility and validity have been verified in a real net- work circumstance. The experiment shows that it is with high average detection and with low false alarm and miss alarm. Moreover, it can optimize the network traffic simultaneously with defending against DDoS at- tacks, thus eliminating efficiently the global burst of traffic arising from normal traffic. Keywords: DDoS Attack, Genetic Algorithm, IP Flow Statistics 1. Introduction Denial-of-Service (DoS [1]) attacks use legitimate re- quests to overload the server, causing it to hang, crash, reboot, or do useless work. The target application, ma- chine, or network spends all of its critical resources on handling the attack traffic and cannot attend to its legiti- mate clients. Both DoS and DDoS are a huge threat to the operation of Internet sites, but the DDoS [2,3] prob- lem is more complex and harder to solve. There are two main classes of DDoS attacks: band- width depletion and resource depletion. A resource de- pletion attack is an attack that is designed to tie up the resources of a victim system. This type of attack targets a server or process at the victim making it unable to le- gitimate requests for service. A bandwidth depletion at- tack is designed to flood the victim network with un- wanted traffic that prevents legitimate traffic from reaching the victim system. And there are three main defense approaches: traceback [4]—with the increase of zombies this approach will be invalidated rapidly; filtrate [5]—because this method requires the participation of the communication company and many routers, the filter must be open at all times, and the approach is too costly; throttle [6]—legitimate data stream will be limited be- cause too many data streams converge at a central point. Thus, based on these three methods, three distinct de- fense approaches emerge: gateway defense, router de- fense and computer defense. This paper aims at discussing a low cost, high per- formance and easy-to-deploy approach [7] which selects five statistical features from IP flow is proposed on fil- tering DDoS attacks on routers. We use usual statistical traffic of IP flow to get the percentage of traffic of the upriver routers. Then we use the percentage to assign a weight for the router. When DDoS happens, we observe the traffic quota of several chosen routers. Our goal is to maximize goodput, with the weight that we figure out in normal state. At the same time we can calculate which routers should block the traffic. Then the victim server sends a filtering request to these routers to block all traf- fic from certain sources to the victim. We present an implementation of these concepts, along with experimental results from our laboratory testbed. In the rest of this section we give a very brief overview of the filtering mechanism. Section 2 tells the 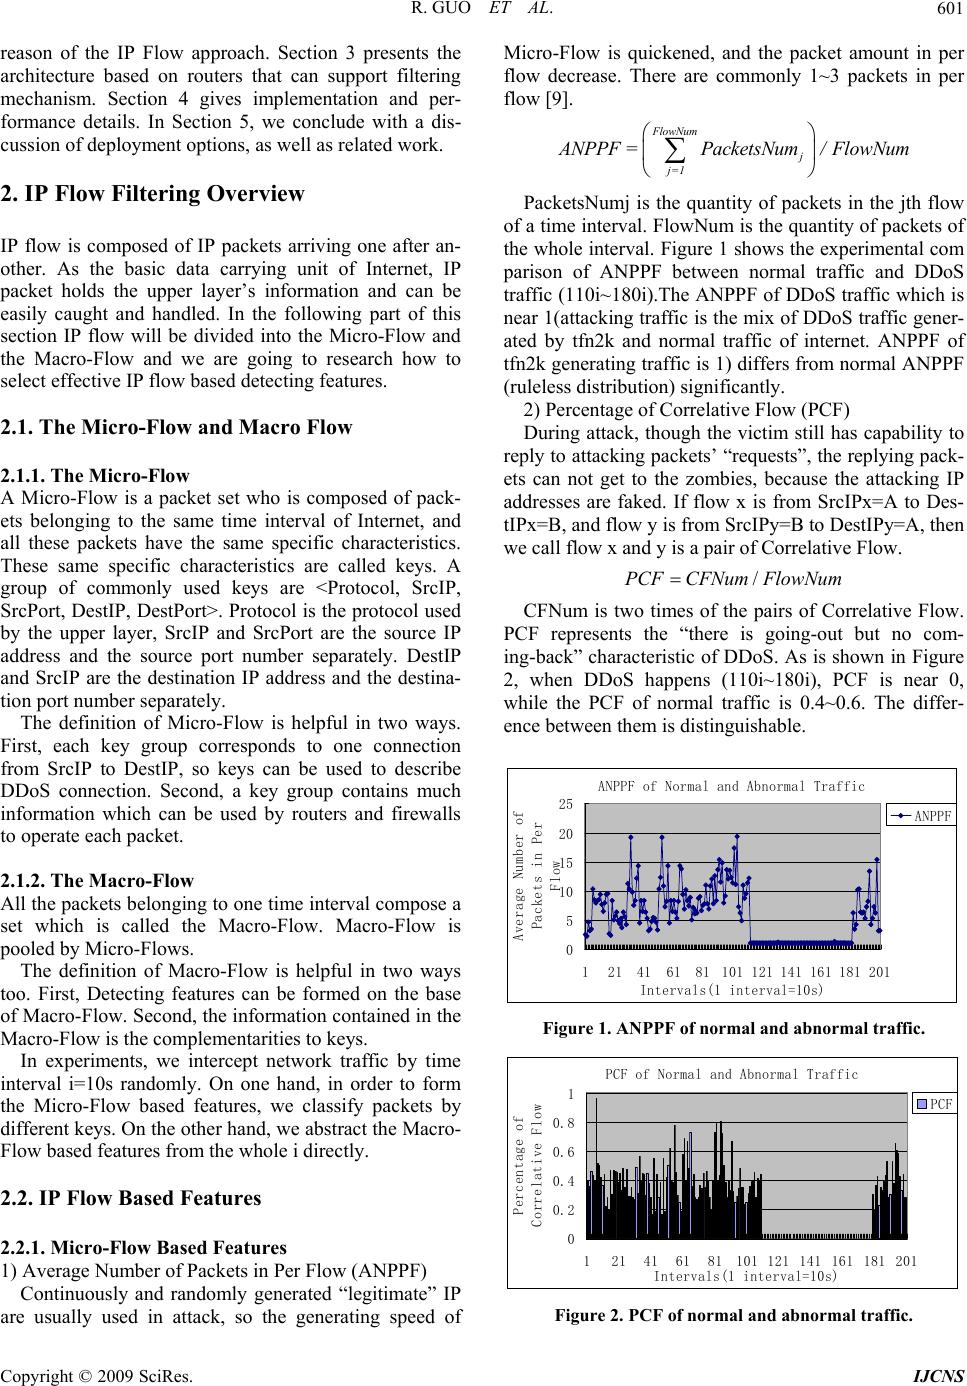 R. GUO ET AL. 601 reason of the IP Flow approach. Section 3 presents the architecture based on routers that can support filtering mechanism. Section 4 gives implementation and per- formance details. In Section 5, we conclude with a dis- cussion of deployment options, as well as related work. 2. IP Flow Filtering Overview IP flow is composed of IP packets arriving one after an- other. As the basic data carrying unit of Internet, IP packet holds the upper layer’s information and can be easily caught and handled. In the following part of this section IP flow will be divided into the Micro-Flow and the Macro-Flow and we are going to research how to select effective IP flow based detecting features. 2.1. The Micro-Flow and Macro Flow 2.1.1. The Micro-Flow A Micro-Flow is a packet set who is composed of pack- ets belonging to the same time interval of Internet, and all these packets have the same specific characteristics. These same specific characteristics are called keys. A group of commonly used keys are <Protocol, SrcIP, SrcPort, DestIP, DestPort>. Protocol is the protocol used by the upper layer, SrcIP and SrcPort are the source IP address and the source port number separately. DestIP and SrcIP are the destination IP address and the destina- tion port number separately. The definition of Micro-Flow is helpful in two ways. First, each key group corresponds to one connection from SrcIP to DestIP, so keys can be used to describe DDoS connection. Second, a key group contains much information which can be used by routers and firewalls to operate each packet. 2.1.2. The Macro-Flow All the packets belonging to one time interval compose a set which is called the Macro-Flow. Macro-Flow is pooled by Micro-Flows. The definition of Macro-Flow is helpful in two ways too. First, Detecting features can be formed on the base of Macro-Flow. Second, the information contained in the Macro-Flow is the complementarities to keys. In experiments, we intercept network traffic by time interval i=10s randomly. On one hand, in order to form the Micro-Flow based features, we classify packets by different keys. On the other hand, we abstract the Macro- Flow based features from the whole i directly. 2.2. IP Flow Based Features 2.2.1. Micro-Flow Based Features 1) Average Number of Packets in Per Flow (ANPPF) Continuously and randomly generated “legitimate” IP are usually used in attack, so the generating speed of Micro-Flow is quickened, and the packet amount in per flow decrease. There are commonly 1~3 packets in per flow [9]. FlowNum j j=1 A NPPF =PacketsNum/FlowNum PacketsNumj is the quantity of packets in the jth flow of a time interval. FlowNum is the quantity of packets of the whole interval. Figure 1 shows the experimental com parison of ANPPF between normal traffic and DDoS traffic (110i~180i).The ANPPF of DDoS traffic which is near 1(attacking traffic is the mix of DDoS traffic gener- ated by tfn2k and normal traffic of internet. ANPPF of tfn2k generating traffic is 1) differs from normal ANPPF (ruleless distribution) significantly. 2) Percentage of Correlative Flow (PCF) During attack, though the victim still has capability to reply to attacking packets’ “requests”, the replying pack- ets can not get to the zombies, because the attacking IP addresses are faked. If flow x is from SrcIPx=A to Des- tIPx=B, and flow y is from SrcIPy=B to DestIPy=A, then we call flow x and y is a pair of Correlative Flow. /PCFCFNum FlowNum CFNum is two times of the pairs of Correlative Flow. PCF represents the “there is going-out but no com- ing-back” characteristic of DDoS. As is shown in Figure 2, when DDoS happens (110i~180i), PCF is near 0, while the PCF of normal traffic is 0.4~0.6. The differ- ence between them is distinguishable. ANPPF of Normal and Abnormal Traffic 0 5 10 15 20 25 121416181101 121141 161181 201 Intervals(1 interval=10s) Average Number of Packets in Per Flow ANPPF Figure 1. ANPPF of normal and abnormal traffic. PCF of Normal and Abnormal Traffic 0 0.2 0.4 0.6 0.8 1 121416181101121 141161181 201 Intervals(1 interval=10s) Percentage of Correlative Flow PCF Figure 2. PCF of normal and abnormal traffic. Copyright © 2009 SciRes. IJCNS  R. GUO ET AL. 602 ODGS of Normal and Abnormal Traffic 0 2000 4000 6000 8000 10000 12000 14000 121416181101 121141 161181 201 Intervals(1 interval=10s) One Direction Generating Speed ODGS Figure 3. ODGS of normal and abnormal traffic. PGS of Normal and Abnormal Traffic 0 1000 2000 3000 4000 5000 6000 7000 121416181101 121 141161 181 201 Intervals(1 interval=10s) Ports Generating Speeed PGS Figure 4. PGS of normal and abnormal traffic. 3) One Direction Generating Speed (ODGS) Flow generating speed quickens when attack happens or busy time comes. In order to distinguish these two kinds of situations, ODGS is proposed. ()ODGSFlowNum CFNuminterval/ In order to increase the efficiency of attacking, attack- in s detec- tio . The Design of Statistical Analysis Filtering rom the Micro-Flow and Macro Flow, we can get the ODGS reflects the sudden increase of traffic when DDoS happens, and it also reflects the “there is go- ing-out but no coming-back” characteristic of DDoS. Figure 4 gives the experimental comparison of ODGS between normal traffic (110i~180i) and abnormal traffic. ODGS’ order of magnitude in normal traffic (102) is much smaller than that in the abnormal traffic (104). 4) Ports Generating Speed (PGS) PGS = PortsNum / interval PortsNum is the number of distinct port in one time interval. Some researchers select the size of port [2] as a detecting feature, while we find that many newly emerged services and applications (such as famous p2p application BT) use port number bigger than 1024, so approach of [2] is not suitable anymore. Through deeper investigation, we realize that attackers continuously and randomly generate port too, so PGS is proposed. As is shown in Figure 4, the PGS of normal traffic is not big- ger than 200, while PGS of attacking traffic (110~180i) is over thousands. 2.2.2. The Macro-Flow Based Feature PAP (Percentage of Abnormal Packets) g packets’ content parts are usually unfilled or only filled with very few useless bytes (such as famous at- tacking tools tfn2k, trinoo). This kind of procedure re- sults in the increase of abnormal small packets (for ex- ample, some TCP packets are only a little bigger than 40bytes, and UDP packets are only a little bigger than 28bytes). PAP presents this characteristic of DDoS at- tack by counting the percentage of abnormal packets in the one i(a Macro-Flow). Figure 5 is the comparison of PAP of normal traffic and abnormal traffic. As we can see, there is a significant change of PAP from near 0 to more than 0.9 when DDoS happens (110i~180i). Defending against DDoS attacks often involve n and response. There are a number of statistical ap- proaches for detection of DDoS attacks, including the use of IP addresses and TTL [11] values and TCP SYN/ FIN packets for detecting SYN flood attacks. Also en- tropy and Chi-Square statistics are used to differentiate between attack and normal packets. The D-WARD ap- proach [8] uses, in addition to network and transport header statistics, application layer [10] knowledge to implement the filter policy. But all these method require the participation of many routers, the filter must be open at all times, so the approach is too costly. 3System F statistical result: n kj 1 S j are all connections form source IPk, ik 1 S n i are alions which are routed to des- tination IPk. It is easy to create probability statistics of l connect access records. Generally, DoS attacks launched by a large number of hosts which host never accessed the vic- tim network before. Meaning during a DDoS attack most of the hosts to the victim are fresh new, which is so dif- ferent to flash crowd [7]. So we can use history IP data- base by putting these IP of high frequency in a pool. Common algorithm is not efficient enough to catch up with the line rate of high speed at reasonable memory consumption. PAP of Normal and Abnormal Traffic 0 0.2 0.4 0.6 0.8 1 121416181101121 141161181 201 Intervals(1 interval=10s) Percentage of Abnormal Packets PAP Figure 5. PAP of normal and abnormal traffic. Copyright © 2009 SciRes. IJCNS 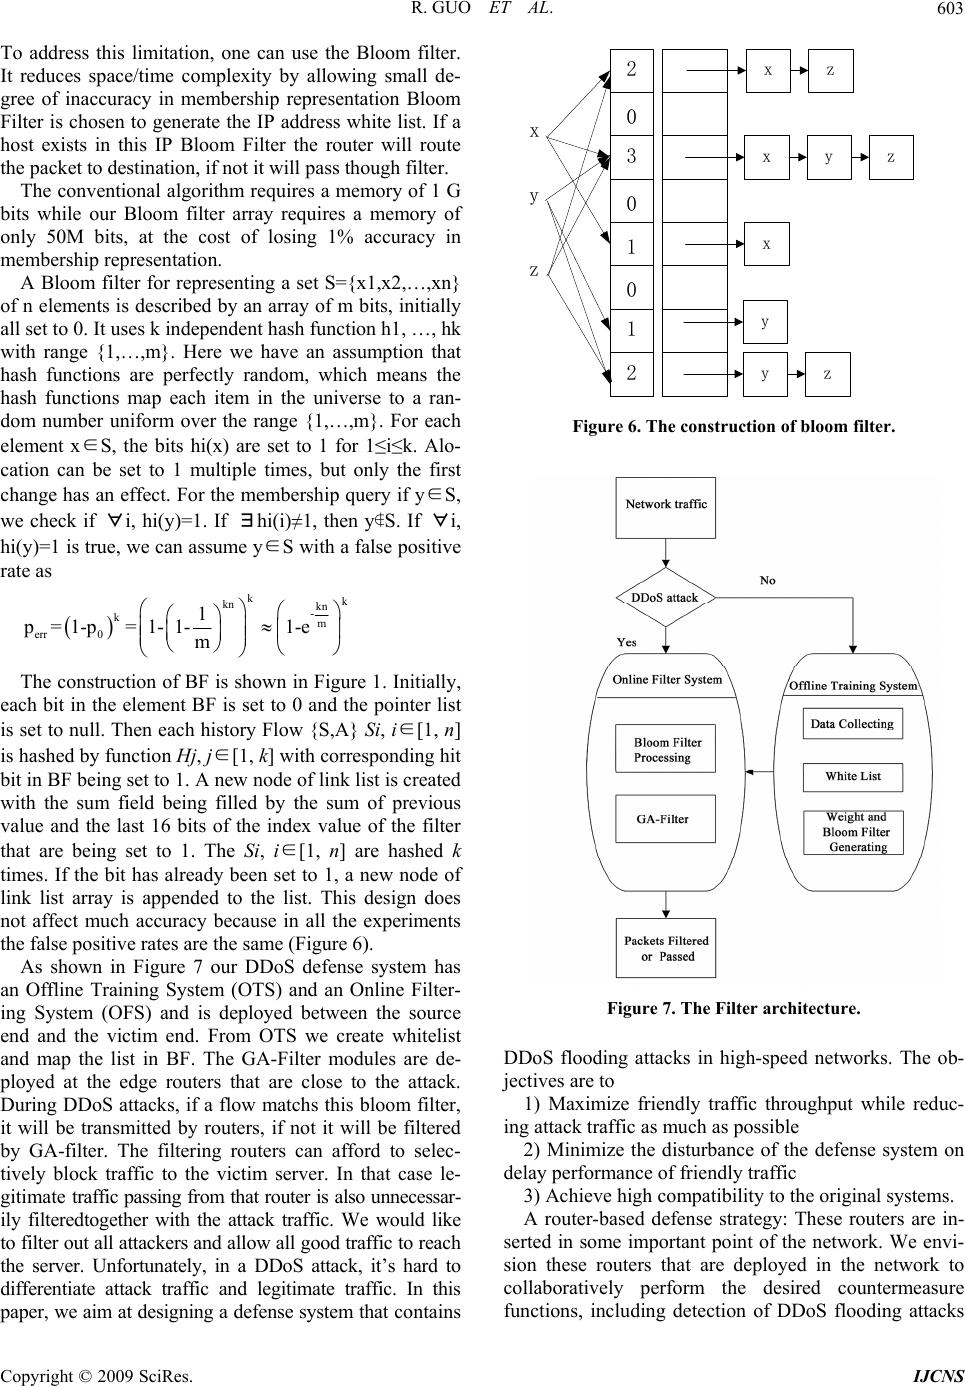 R. GUO ET AL. 603 To adfilter. bi nting a set S={x1,x2,…,xn} of dress this limitation, one can use the Bloom It reduces space/time complexity by allowing small de- gree of inaccuracy in membership representation Bloom Filter is chosen to generate the IP address white list. If a host exists in this IP Bloom Filter the router will route the packet to destination, if not it will pass though filter. The conventional algorithm requires a memory of 1 G ts while our Bloom filter array requires a memory of only 50M bits, at the cost of losing 1% accuracy in membership representation. A Bloom filter for represe n elements is described by an array of m bits, initially all set to 0. It uses k independent hash function h1, …, hk with range {1,…,m}. Here we have an assumption that hash functions are perfectly random, which means the hash functions map each item in the universe to a ran- dom number uniform over the range {1,…,m}. For each element x∈S, the bits hi(x) are set to 1 for 1≤i≤k. Alo- cation can be set to 1 multiple times, but only the first change has an effect. For the membership query if y∈S, we check if ∀i, hi(y)=1. If ∃hi(i)≠1, then y∉S. If ∀i, hi(y)=1 is true, we can assume y∈S with a false positive rate as kk kn kn - km err 0 1 p=1-p=1-1-1-e m The construction of BF is shown in Figure 1. Initially, ea stem has an ch bit in the element BF is set to 0 and the pointer list is set to null. Then each history Flow {S,A} Si, i∈[1, n] is hashed by function Hj, j∈[1, k] with corresponding hit bit in BF being set to 1. A new node of link list is created with the sum field being filled by the sum of previous value and the last 16 bits of the index value of the filter that are being set to 1. The Si, i∈[1, n] are hashed k times. If the bit has already been set to 1, a new node of link list array is appended to the list. This design does not affect much accuracy because in all the experiments the false positive rates are the same (Figure 6). As shown in Figure 7 our DDoS defense sy Offline Training System (OTS) and an Online Filter- ing System (OFS) and is deployed between the source end and the victim end. From OTS we create whitelist and map the list in BF. The GA-Filter modules are de- ployed at the edge routers that are close to the attack. During DDoS attacks, if a flow matchs this bloom filter, it will be transmitted by routers, if not it will be filtered by GA-filter. The filtering routers can afford to selec- tively block traffic to the victim server. In that case le- gitimate traffic passing from that router is also unnecessar- ily filteredtogether with the attack traffic. We would like to filter out all attackers and allow all good traffic to reach the server. Unfortunately, in a DDoS attack, it’s hard to differentiate attack traffic and legitimate traffic. In this paper, we aim at designing a defense system that contains x z x 2 0 0 0 2 3 1 1 z y xyz x y z y Figure 6. The construction of bloom filter. Figure 7. The Filter architecture. DDoS flooding attacks in hih-speed networks. The ob- friendly traffic throughput while reduc- in defense system on de e original systems. se g jectives are to 1) Maximize g attack traffic as much as possible 2) Minimize the disturbance of the lay performance of friendly traffic 3) Achieve high compatibility to th A router-based defense strategy: These routers are in- rted in some important point of the network. We envi- sion these routers that are deployed in the network to collaboratively perform the desired countermeasure functions, including detection of DDoS flooding attacks Copyright © 2009 SciRes. IJCNS  R. GUO ET AL. 604 .1. Combinatorial Optimization of Filtering he filtering problem is a combinatorial optimization of The problem is to identify a subset of all traffic that leads subject to with , , 3.2. Genetic Algorithms for Filtering Bad Traffic enetic algorithms are stochastic iterative algorithms for .2.1. Initial Population g an initial population ng, the length is itness Fun ct ion t represents which router filtrate and access control of network traffic. 3Problem T the traffic to victim server, which seeks for maximum legitimate traffic from all good or bad traffic. We assume that there are n distinct routers involved and the traffic in total transmit to victim server is i w, generally, each router j (j = 1, …, n) transmit traictim server has assigned a profit Pi (i= 1, …, n) and the maximum throughput is C. When a router route stream i (i = 1, …, m) to victim server , we define Xi=1; if stream i (i =1, …, m) isn’t routed to server, we define Xi =0. So the stream in total is n ii wx , but the good traffic is n ii px , ffic to v 1i1i to the highest possible total good traffic and does not exceed maximum throughput C. Formally, our filtering model can be stated as follows: Maximize n 1 ii i px 1 n ii i wx c 0 i p0 i w0C G search and optimization that find their origin and inspira- tion in the Darwinian theory of biological evolution. GA abstract and mimic some of the traits of the ongoing struggle in evolution in order to do a better job in prob- lems that require adaptation, search and optimization. Since we are in fact dealing with artificial systems, we should also feel free to employ whatever device works well for a given class of problems, even if it has no direct biological origin. Genetic Algorithms are computer algo- rithms that search for good solutions to a problem from among a large number of possible solutions. Genetic Algorithms of our filtering can be stated as follows: 3 The algorithm begins by creatin which contains M individuals; a mutation probability; a crossover probability; the length of every chromosome N, and the maximum generations. Randomly generate a population of N chromosomes. We randomly generated traffic to victim server and the percentage of bad traffic. Initial transmitting throughput by routers is more than the maximum throughput C which the server can handle. 3.2.2. Encoding of the Chromosomes Encoding of the problem in a binary stri n, Xi =1, meaning the traffic passes through to the server, Xi =0, meaning the router drops the traffic. Such as X={0,1,0,1,0,0,1} expressing that traffic is passing through router 2, 4, 7. Namely, router 2, 4, 7 will trans- mit traffic to victim server. We randomly select bits of a chromosome and set it to 0 or 1. For each of the chro- mosome, test whether the constraint is satisfied. If so, accept it to be a number of the population. If not, drop it and randomly create a new chromosome. The x-vector describes which of the routers that are chosen in each solution, for example, the vector 01001011 means that router NO. 2, 5, 7 and 8 are chosen to route data to server. .2.3. F3 Given a chromosome tha the traffic, the corresponding fitness function is defined as follow: fitness function n ii 1i f XXP subject to n 1 ii i X WC . At first, we define stream i passes through a router to vi , so howmize variable Xi (i=1,2,…,n)and ctim server , we set Xi =1; if stream i (i = 1; : : : ;m) drop, we set Xi =0. Considering about n routers, the throughput is n ii i WX in total, but the goodput is n ze goodput. So this problem is subject to two formulas: at ii XW C 1 to opti 1 n 1 ii i PX maximi i maximize ii PX X i=1 or 0 (i=1,2,…,n). aing the probl the fitness function, it can be stated as follows: ()ii 1 n i em, forfter analyz 1 n i f xPX, Xi=1 or 0 (i=1,2,…,n). 3.2.4. Selection Functio ns ased on probability, and ap-We choose chromosomes b point the individual to be the first generation. In the im- plementation of the program, we tried roulette-wheel methods: the fitness value of each individual is fi, the probability of i is chosen shown as follow: s i P / n ii 1 i f f ; For the initial population, first we figure out ss value of each chromosome, and then we cal- culate selection probability. After the comparison, the chromosome with low chosen probability is eliminated and the high chosen probability chromosome will be copied. This copied chromosome takes the place of the eliminated chromosome. Then the selection of popula- the fitne Copyright © 2009 SciRes. IJCNS  R. GUO ET AL. 605 ver e use single point crossover. The crossover point is mly by generating a random number Mn is made to prevent GA from falling into a local form mutation on each bit position of omparison ell lab’s data is stored as pure text, and each row of the ansmit traffic with dif- fe . In Table 3 to al- lo tion is over. 3.2.5. Cr osso W determined rando between 0 and 1. We perform crossover with a certain probability. If crossover probability is 100% then a whole new generation is made by crossover. If it is 0% then whole new generation is made by exact copies of chromosomes from old population. We decided upon crossover rate of Pc. This means that Pc of the new gen- eration will be formed with crossover and 1-Pc will be copied to the new generation. 3.2.6. Mu t ation utatio extreme. We per the chromosome with 0.1 % probability. 4. Performance Evaluation and C For evaluating our system, we use Bell lab’s [11,12] data. B text is a packet composed of SIP, DIP, SPort, DPort, packet length and ACK (TCP packet) et. The attack launched in our own simulation is constant rate attack, so we choose the constant rate UDP attack data of Bell lab’s as the attack samples. (Table 1). We suppose to have a server that has a capacity of C bandwidth and several routers tr rent ratio. We want the greatest total benefit without overloading the constraint of the bandwidth. We use a data structure, called cell, with two fields (goodput and traffic) to represent every router (Table 2). Then we use an array of type cell to store all routers in it. In our experiments, we measured filtering characteris- tics by the rate of false and rate of missed [13] shows the sensitivity and accuracy of the Bloom Filter. The ROC curves in Figure 8 and Figure 9 show the sen- sitivity and accuracy of the neural network. A ROC curve is a plot with the false positive rate on the X axis and the true positive rate on the Y axis. The area below the curve reflects the sensitivity of the neural network. As we can see, the curve is close to both the Y axis and the point (0, 1) which means that we obtained low false positives and the classification capability is good. Micro-Flow and Macro-Flow detection based detect- ing features that we described in Section 2 is used cate the weights for traffic routing. As indicated in Table 3, that our IP flow based filtering method achieves pretty high accuracy and precision. It’s low cost, high performance and easy-to-deploy. It optimizes the web flow; enhance the network efficiency by precluding and dismissing the overall current abruptness of ordinary flow. Table 1. DDoS traffic. DDoS Type II DDoS Type I Country Gic % of G Tc % of ood % of bad Traff Traffic 36.27 ood % of bad Traffi raffic 36.2 USA 43.9 45.9 Korea 11.5 12 China 18. T2. 16. 5. Ger 8. Austr 14. Nether 5.8 0 35 10.3 24.1 0 aiwan 2.46 6.1 4 7 Canda 3.64 5.4 3.6 4 UK 6.74 5.2 6.7 5.3 many4 5.1 8.4 5.2 alia 2.5 4.3 2.5 1.1 Japan 13.91 4.2 2 0 lands 1.93 4.1 1.9 8.4 0 0.2 0.4 0.6 0.8 1 00.1 0.2 0.3 0.40.5 0.6 0.7 0.8 0.91 False Positive True Positive ROC Curve Chance Line Figure 8. Our own data ROC curve. 0 0.2 0.4 0.6 0.8 1 00.10.2 0.3 0.40.5 0.60.7 0.8 0.91 False Positive True Positive ROC Curve Chance Line Figure 9. Bell ROC curve. Copyright © 2009 SciRes. IJCNS  R. GUO ET AL. Copyright © 2009 SciRes. IJCNS 606 Table 2. Router information a Router 0 Router1 Router2 Router3 Router4 rray. 36.27 80.17 5.8 17.3 18.35 28.65 2.46 8.56 3.64 9.04 Router 5 Router6 Router 7 Router 8 Router9 6.74 11.94 8.4 13.5 2.5 6.8 13.91 18.11 1.93 6.03 Table 3. The detection results. Bloom Filter Rate of false Alarm(%) Rate of missed Alarm(%) Average detection Latency of attack (s) 1 0 7.6 12.9 2 1.1 4.5 11.2 3 1.3 2.3 10.3 4 2.6 0 9.8 5 2.9 0 7.6 6 3.6 0 7.5 7 4.9 7.1 6.9 9 8.6 6.5 6.3 0 8 5.9 0 0 10 12.8 0 5. Conclusions The defense mechanism of DDoS attacks, particularl the multi-baseproachedrsified flow method of offensivartifice, simulatinhe competition of legal users, inhts a keystone afficulty in the internet security arena. In this paper present five ef- fective detecting features base on the acteristics of IP flow: PAP, ANPPF, PCF, ODGS anGS. These five features can exploithe abnormalitiering DDoS at- tack. Byproducts of features generatare helpful for filtering. We provee capabilities ofse five features through experimental comparison between their normal values and values ittack. Our mechanismcharacteristicallct from cur- nt methods: sources and does not require partici- routers. In general, only requires sev- Th Science Foundation of China under Grant No. 60673184 873254, in part by the National 863 m of China und7AA01Z400, in he Nationalogram of China r Grant No. 20d Tsinghua-Chi- ache CDN Program. J. Mirkovic, S. Dietrich, D. Dittrich, and P. Reiher, “Internet denial of servittack and defense mecha- nisms,” Prentice Hall PTR04. ] V. A. Siris and F. Papa, “Application of anomaly detection algorithms for g SYN flooding attacks In: Regency H, ed,” Glons Conf. (GLOBECOM’04). Dallas: IEEE, pp. 2050–2054, 2004. S. C. Evans, “Detecting ce attacks using kolmogorov eral Electric Research and De- y progra by t d, multi-ap and dive e g t abind di we char d P s dut ion th the n a is y distin re 1) Utilizes few re ation from all ISP p eral routers. 2) It’s low-cost, high-performance and easy-to-deploy. It allows for simple and convenient updating of the Filter Algorithm. 3) Optimizes the IP flow; enhances the server’s effi- ciency by precluding and dismissing the overall current abruptness of ordinary flow. All in all, allocating the server and bandwidth re- sources to both the validation and service components with more efficiency, and applying the algorithm more accurate to filter flooding DDoS are seeking to be done in this sector of internet security. 6. Acknowledgements is work was supported in part by the National Natural [3] W. Li, L. F. Wu, and G. Y. Hu, “Design and implementa- tion of distributed intrusion detection system NetNumen,” and Grand No. 60 er Grant No.200 part de Basic Research Pr 08CB01, anun3171 naC 7. References [1] ce: A , 20 [2 galou detectin bal Telecommunicatio Journal of Software, pp. 1723–1728, 2002. [4] M. Sung and J. Xu, “IP traceback-based intelligent packet filtering: A novel technique for defending against Internet DDoS attacks,” IEEE Trans. on Parallel and Distributed Systems, pp. 861–872, 2003. [5] A. Chandra and P. Shenoy, “Effectiveness of dynamic resource allocation for handling Internet,” University of Massachussets, 2003. [6] F. Liang and D. Yau, “Using adaptive router throttles against distributed denial-of-service attacks,” Journal of Software, pp. 1120–1127, 2002. [7] A. B. Kulkarni, S. F. Bush, and distributed denial-of-servi complexity metrics,” Gen velopment Center, December 2001. [8] J. Mirkovic, “D-WARD: Source-end defense against  R. GUO ET AL. 607 ity, ACM Press, pp. 30–41, Octo- wang, and Y. K. Kwok, “Filtering of shrew in frequency domain,” lcn, pp. 786–793, ttab, T. Znati, R. Mel- 003. distributed denial-of-service attacks,” PhD thesis, Univer- sity of California, Los Angeles, pp. 310–321, August 2003. [9] C. Jin, H. Wang, and K. G. Shin, “Hop-count filtering: An effective defense against spoofed DDoS traffic,” Pro- ceedings of the 10th ACM Conference on Computer and Communication Secur ber, 2003. [10] Y. Chen, K. H DDoS attacks [12 The IEEE Conference on Local Computer Networks 30th Anniversary (LCN’05), Jan. 2005. [11] C. Sangpachatanaruk, S. M. Kha hem, and D. Mosse’, “A simulation study of the proactive server roaming for mitigating denial of service attacks,” Proceedings of the 36th Annual Simulation Symposium (ANSS’03), pp. 1430–1441, March 2 ] Bell Labs. Bell Labs Internet Traffic Research. http:// stat.bell-labs.com/InternetTraffic/index.html. [13] ICSI Center for Internet Research Traffic Generators for Internet Traffic. http://www.icir.org/models/trafficgenerat ors.html. Copyright © 2009 SciRes. IJCNS |