International Journal of Communications, Network and System Sciences
Vol.10 No.05(2017), Article ID:76544,12 pages
10.4236/ijcns.2017.105B008
Impact of Self-Organizing Networks Deployment on Wireless Service Provider Businesses in China
Usman Rauf Kamboh, Qinghai Yang, Meng Qin
State Key Laboratory of ISN, School of Telecom Engineering, Xidian University, Xi’an, China


Received: March 10, 2017; Accepted: May 23, 2017; Published: May 26, 2017
ABSTRACT
Decoupling of revenues with network traffic and extreme penetration of expenses in wireless network leads to the critical situation for wireless service providers (WSP), as more wireless network is complex due to its heterogeneity in the context of planning, software & hardware installation, radio parameters setting, drive testing, optimization, healing and maintenance. These operations are time-consuming, labor & budget-intensive and error-prone if activated manually. Hence new approaches have to be designed and applied to meet those demands in a cost-effective way, Self-organizing networks (SON), is a promising approach to handle manual tasks with autonomous manners. More specifically the self-directed functions (self-planning, self-deployment, self-configuration, self-optimization and self-healing) are aid to reduce capital expenditure (CAPEX), implementation expenditure (IMPEX) and operational expenditure (OPEX). In this study, first we investigate the aforementioned impact factors of cost combined with self-functions. Then, we analyze the relative cost benefits causing from deploying the SON functions, using the economical method to have more precise results concerning those potential benefits. At last, the result shows that there is a significant difference in expenses and revenues of WSP with and without SON after enabling self-functions in wireless network.
Keywords:
Wireless Service Providers, Self-Organizing Networks, Capital Expenditure, Operating Expenditure, Operating Revenues

1. Introduction
Introducing the Long Term Evolution (LTE) wireless network promise with mobile operators to increase the revenue, a critical need is to reduce the network expenses if operator wants to remain competent in the wireless world against Wi-Fi mesh network. Future wireless network is more complex due to its heterogeneity in the context of planning, software & hardware installation, radio parameters setting, deployment, configuration, drive testing, optimization, healing and maintenance. These operations are time-consuming, labour and budget-intensive for WSP and error-prone if activated manually. Due to these challenges, more efficient and smart network management way is urged to develop a system that deals these tasks with self-directed manners. In this context, SON is the surest way to manage the future wireless heterogeneous network with autonomous manners, low-cost and high margins [1] [2] [3].
The purpose of this study is to analyze the impact of SON deployment on WSP businesses in china and how we can reduce the cost and increase the total revenues with deployment of SON system model. The rest of this paper prepared as follows: In Section 2 overview of SON, Section 3 describes the methodology. Section 4 conducts the results and section 5 concludes the paper.
2. Overview of SON
Ramiro et al. [4] and 3GPP [5] SON has been evolved as part of 3GPP standardization process with sub-functions: Self-configuration, Self-Optimization and Self-Healing. Figure 1 Captures the SON three functions in release8/LTE networks [2] [14].
・ 3GPP (Rel. 9) [6] [7] [8]. Self-Configuration deals with the wireless network in an automated manner from basic setup of eNodeB to initial radio configuration. Under the umbrella of self-configuration, it can automate the configuration of IP address, detection of OAM & P, gate way (GW) setting, downloading of eNodeB software, neighbor list configuration, coverage and capacity of related parameters that minimize the human efforts and the cost efficient way for mobile operators to reduce the network expenses. Self-confi-
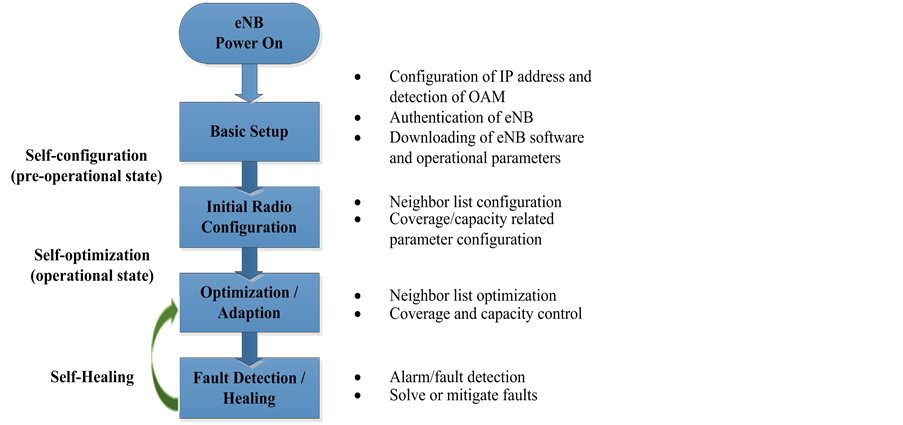
Figure 1. Self-organizing network.
guration also reduces the planning and deployment tasks.
・ 3GPP (Rel. 13) [9]. Self-optimization brings with wireless network to utilize the available resources in optimal way. Such as, mobility load balancing (MLB), inter-cell interference coordination (ICIC) [10], cell outage detection & compensation and energy consumption optimization. It can improve the coverage & capacity of the network and minimize the bundle of manual tasks particularly drive testing.
・ 3GPP (Rel. 10) [11] [12] [13]. Self-healing mitigates the errors in an autonomous way by using the triggers or alarm. Self-healing first monitors the threats in the network then trace out the specific alarm, and after deep analysis it could be solved automatically. Self-healing function also improves quality of service (QoS) and quality of experiences (QoE).
3. Methodology
In methodology, we analyze the effects of SON in economic benefits of WSP by using the total cost of ownership (TCO) approach. TCO is a financial estimate to help the equipment vendors and buyers (WSP) determine the direct and indirect expenditures of equipments and quantify the financial impact on system over its certain life cycle. The data (all units in million RMB) were collected from three main China companies by their officially web through financial reports: China Mobile, China Unicom and China Telecom with respect to SON. This 15-year study is on China largest WSP that presented the economic benefits from the year (2010) when WSP enabled SON functionalities in LTE networks. We associate the objectives of WSP with technical functions and derive how SON will impact on three main contributors CAPEX, OPEX and Operating Revenue as a moderator.
3.1. SON Impacted System Model for WSP
The SON X-Functions have directly impact on WSP business at the beginning of site planning as well as deployment and ongoing network operations.
Figure 2 indicates the impact of SON on WSP businesses in red shaded with high level grouping of activities. In this model, we capture the immediate benefits of SON in three parts: first, the CAPEX can be streamlined by pre-planning. Second, the implementation expenditures or IMPEX can be reduced in network deployment. Finally, OPEX is also a key factor which can be saved by optimization of network with SON.
・ First phase (CAPEX) of wireless network begins from site design activities, in which network planner pre-plan the number of activities. Activities are relevant to new location of eNodeB, pre-planning of radio & transport parameters, IP & interfaces management, CW & TI and data alignment. Self-con- figuration function automates these parameters, and it can automatically exchange all parameters information when the site power up. As specifically, neighbor list updating activity.
・ Second phase (IMPEX) of wireless network starts from site acquisition &
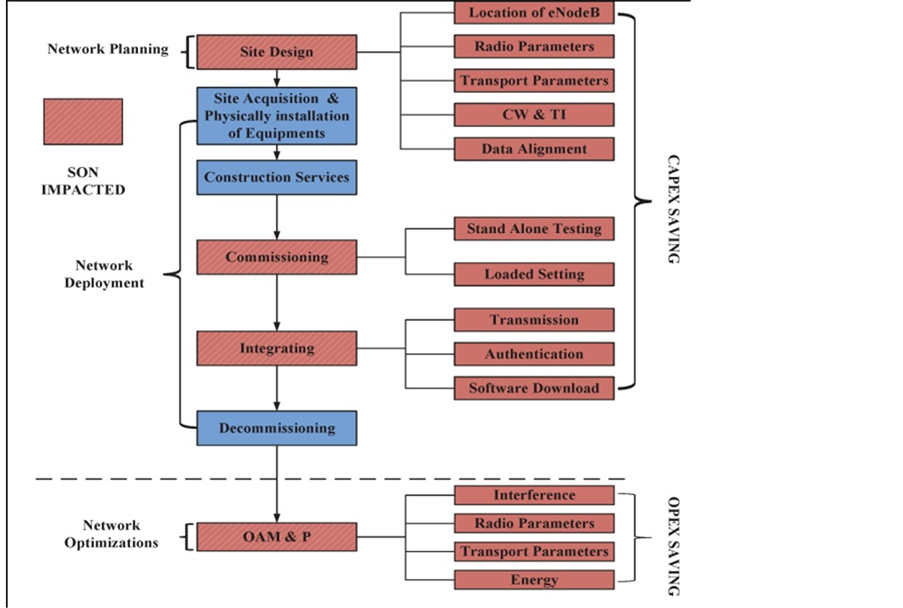
Figure 2. System model from technical to finical benefits of SON.
physical installation of equipment and construction services (lease site, purchase equipment and softwares). These manual activities do not have any role of SON. In this phase, commission and integration of wireless network have a strong relationship with self-configuration and self-deployment. In commissioning and integration, normally engineers and technicians are attached with faulty or new cell site to configuring and integrating the installed equipments with core network. Self-configuration function promise with WSP to reduce such manual tasks in cost efficient way.
・ Third phase (OPEX) starts after deployment of wireless network. Now the network is in operational state and related activates handover to OAM & P. SON features such as cell outage detection and compensation, interference mitigation & cancellation can minimize the drive testing in wireless network which directly impact on WSP operational expenses. Additionally, the energy optimize contributor also reduce the OPEX and save energy by switching off unused parts of base stations in low traffic periods.
3.2. Conceptual Framework
In Figure 3 Conceptual framework OPEX cost could be divided into two sections: The network-related cost such as, transmission line cost, interconnection cost, other network maintenance cost. And the non-network-related costs, such as depreciation expense, personal expense, selling expense and cost of product sold expense. In our work of cost analysis for WSP, only network-related cost

Figure 3. Conceptual framework for WSP Businesses.
i being focused. The network-related impactors such as (Interconnection expense, leased line transmission expense and other operational & maintenance expense) have a great impact on OPEX, and our motive is to model the main relative differences in cost analysis when considering the deployment of SON in wireless network. Furthermore, SON functions which have deployed in wireless network can reduce the operation cost and can increase the operating revenue from both CAPEX and OPEX as shown in Figure 2.
3.3. Hypothesis
H1: There is a significant difference between CAPEX and SON.
H2: There is a significant difference between OPEX and SON.
H3: There is a significant effect of CAPEX on operating revenue among SON.
H4: There is a significant effect of OPEX on operating revenue among SON.
Figure 4 captures the graphical representation of the operating revenues, EBITDA, N.P and EPS of WSP among SON. And the results show that the performance with SON is better than without SON.
4. Experimental Results and Discussion
Table 1 explains the benefits of SON on average operating revenue, average earnings before interest taxes depreciation amortization (EBITDA), average net profit (N.P) and average earning per share (EPS). Also it shows that averages of revenues, EBITDA, N.P and EPS of WSP business with SON are better than without SON.
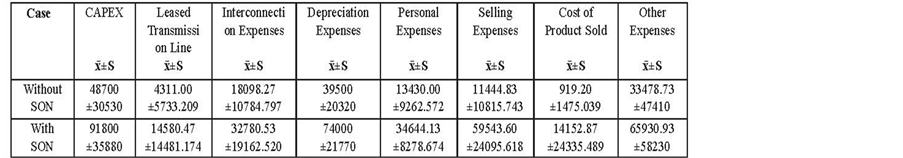
Table 2 shows the benefits of SON on CAPEX, leased transmission line expense, interconnection expense, depreciation expense, personal expense, selling expense, and cost of product sold expense and other expenses. It indicates that expenses of WSP business with SON are better than without SON.
Table 3 indicates independent sample means the test of operating revenue, EBITDA, net profit and EPS with and without SON. The P value of Levene’s test
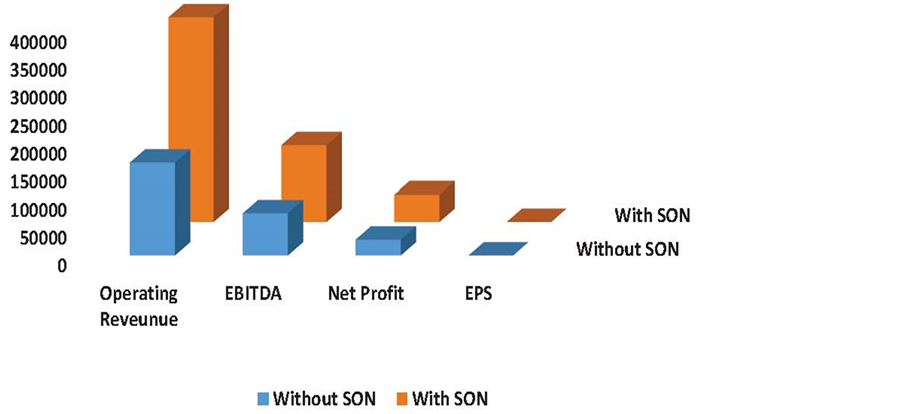
Figure 4. Benefits of SON on WSP businesses.
Table 1. Distribution of revenues for WSP among SON.

Table 2. Distribution of expenses for WSP among SON.
is 0.006 < 0.05 for operating revenue with and without SON is significant. Therefore, we assume population variances are not equal assumed of operating revenues. Then the value of test statistics is T = 4.360 and P = 0.01 < 0.05. It means there is a significant difference between operating revenue with and without SON. The P value of Levene’s test is 0.025 < 0.05 for EBITDA with and without SON is significant. Therefore, we assume population variances are not equal assumed of EBITDA. Then the value of test statistics is T = 2.576 and P = 0.01 < 0.05. It means there is significant difference between EBITDA with and without SON. Even in all remaining cases like N.P and EPS are significant for with SON and without SON.
Table 4 indicates independent sample means test of capital expenditure CAPEX, leased line expense, interconnection expense, depreciation expense, personal expense, selling expense, cost of product sold and other expense with
Table 3. Independent samples means test of revenues of WSP among SON.
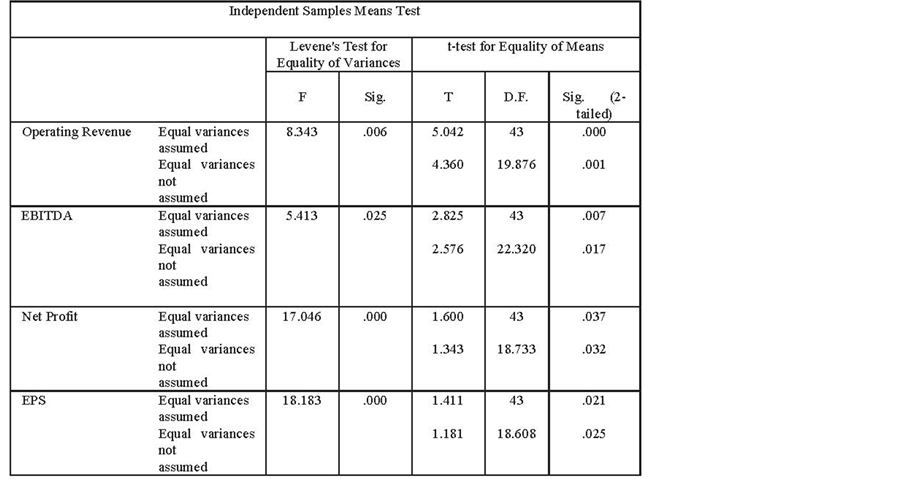
Table 4. Independent samples means test of WSP Expenses among SON.
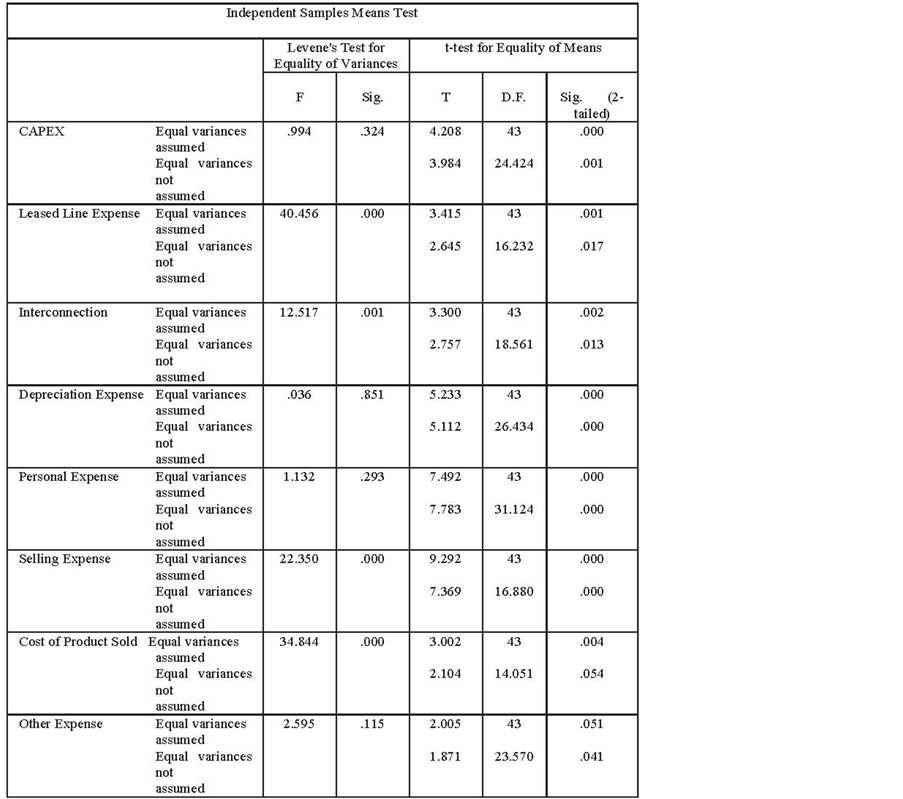
and without SON. The P value of Levene’s test is 0.324 < 0.05 for CAPEX with and without SON is insignificant. Therefore we assume population variances are equal assumed of CAPEX. Then the value of test statistics is T = 4.208 and P = 0.01 < 0.05. It means there is significant difference between CAPEX with and without SON. The P value of Levene’s test is 0.001 < 0.05 for leased line expense with and without SON is significant. Therefor we assume population variances are not equal assumed of leased line expenses. Then the value of test statistics is T = 2.645 and P = 0.01 < 0.01. It means there is significant difference between leased line expense with and without SON. Even in all remaining cases like interconnection expense, depreciation expense, personal expense, selling expense, cost of product sold expense and other expense are significant for without SON and with SON.
Table 5 shows the multiple linear regression model summaries. It has found that adjusted R square of this model is 0.990, with R square equals to 0.992 that means 99.2 information explained of dependent variable (Operating Revenue) through all independent variables and the standard error of the estimate is 10531.073 the Durbin Watson D = 2.3 which is between the two critical values of 1.5 < D < 2.5 and therefore we can assume that there is no first order linear autocorrelation in our multiple linear regression data.
Table 6 Analysis of variance (ANOVA) shows the overall model is significant. The P value of our model is 0.001 < 0.05 therefore overall model is significant for WSP.
Table 7 shows the individual comparison of independent variables with dependent variable. The value of beta is equal to 0.265 showing the positive relationship between CAPEX and Operating Revenue which means that when CAPEX increases, Operating Revenue will also increase. Also the p value of CAPEX is 0.001 which is < 0.05 means that there is significant effect of CAPEX on Operating Revenue. The value of beta is equal to 2.075 showing the positive relationship between Leased line expenses and Operating Revenue it means that when the Leased line expenses increase, Operating revenue will also increase.
Table 5. Model summary of operating revenue of WSP without SON.
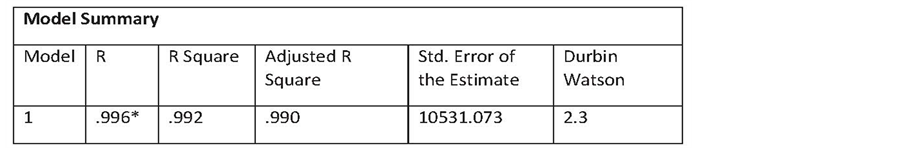
Table 6. Analysis of variance of operating revenue of WSP without SON.
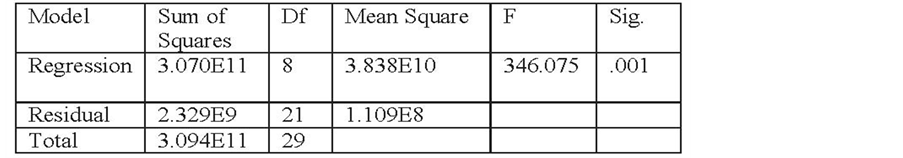
Table 7. Coefficients of operating revenue without SON.
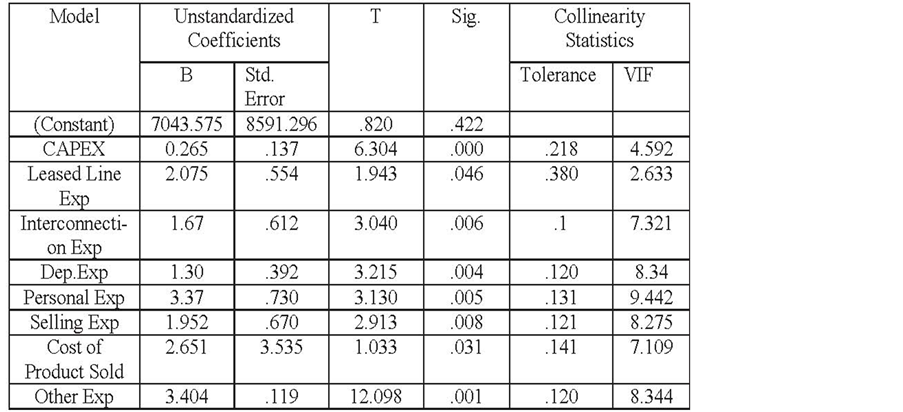
The p value of Leased line expenses is 0.04 which is <0.05 means that there is significant effect of Leased line expenses on Operating Revenue. We see that in all remaining cases of expenses there is positive relationship between expenses and operating revenue. The P-Value for all cases is <5 percent. Its mean there is significant relationship between operating revenue and expenses. This table also analyzes multi-Collinearity in multiple linear regression models. Tolerance should be greater than 0.1 or VIF < 10 for all variables which they are. Therefore there is no multi-Collinearity among the variables.
Table 8 shows the multiple linear regression model summaries. It has found that the adjusted R square of this model is 0.993, with R square equals to 0.997 that means 99.7% information explained of dependent variable (Operating Revenue) through all independent variables and the standard error of the estimate is 13850.867 the Durbin Watson D = 2.5 which is between the two critical values of 1.5 < D < 2.5 and we can assume that there is no first order linear autocorrelation in our multiple linear regression data.
Table 9 Analysis of variance (ANOVA) shows the overall model is significant. The P value of our model is 0.001 < 0.05 therefore there is a significant effect on dependent variable through all independent variables.
Table 10 shows the individual comparison of independent variables with dependent variable. The value of beta is equal to 1.43 showing the positive relationship between CAPEX and Operating Revenue it means that when CAPEX increases, Operating Revenue will also increase. The p value of CAPEX is 0.03 which is <0.05 means that there is significant effect of CAPEX on Operating Revenue. The value of beta is equal to 4.123 showing the positive relationship between Leased line expenses and Operating Revenue which means that when the Leased line expenses increase, Operating revenue will also increase. Also the p value of leased line expenses is 0.051 which is <0.05. It means that there is significant effect of leased line expenses on operating revenue. We see that in all remaining cases of expenses there is positive relationship between expenses and
Table 8. Model summary of operating revenue with SON.
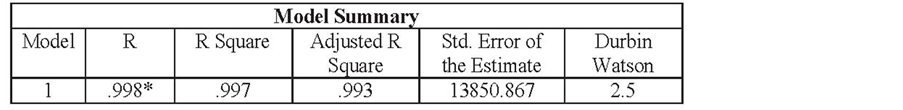
Table 9. Analysis of variance of operating revenue with SON.
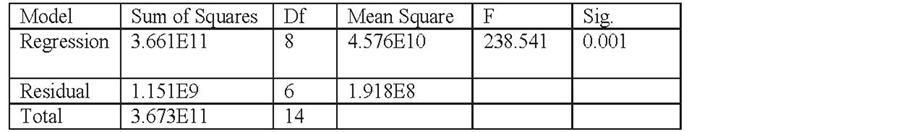
Table 10. Coefficients of operating revenue with SON.
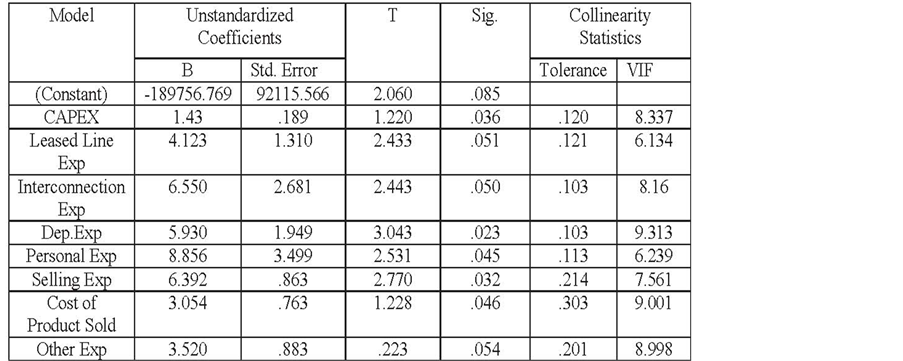
operating revenue and the P-Values for all cases is less than 5 percent. It means there is significant relationship between revenues and expenses. This figure also analyzes multi-Collinearity in multiple linear regression models. Tolerance should be greater than 0.1 or VIF < 10 for all variables which they are. Therefore there is no multi-Collinearity among the variables.
Before and after Saving through SON
In case of without SON (Table 7) the value of CAPEX βwithout_son = 0.265 hence there is positive relationship between CAPEX and operating revenue. It’s mean if one unit of change in CAPEX then increase in operating revenue is 0.265 unit. In case of with SON (Table 10) the value of CAPEX βwith_son = 1.43 also there is positive relationship between CAPEX and operating revenue. It means one unit of change in CAPEX then increase in operating revenue is 1.43 unit. Results shows that operating revenues with SON more than without SON. We see that CAPEX βwithout_son (0.265) < βwith_son (1.43), Leased line expense βwithout_son (2.075) < βwith_son (4.123), Interconnection expense βwithout_son (1.67) < βwith_son (6.550), Depreciation expense βwithout_son (1.03) < βwith_son (5.930), Personal expense βwithout_son (3.37) < βwith_son (8.856), Selling expense βwithout_son (1.952) < βwith_son (6.392), Cost of product sold βwithout_son (2.651) < βwith_son (3.054) and Other expense βwithout_son (3.404) < βwith_son (3.520). It is clear that in case of with SON operating revenue will increase than without SON operating revenue. The immediate benefits of SON show the high margins for WSP through saving of CAPEX and OPEX.
5. Conclusion
In this study, we have examined the impact of SON deployment on WSP businesses in terms of lower OPEX and streamlined CAPEX, with and without SON, and we also proposed the conceptual framework where we showed that business benefits of SON are measurable in LTE network. This 15-year study is on China largest WSP and it shows that economic benefits are obtained from the year when WSP enabled the SON functions in LTE wireless network. After applying the SON functions in LTE wireless network, the WSP operating revenue, EBITDA, N.P and EPS are more than without SON. And the result shows that there is significant difference in expenses and revenues with and without SON. In this work, calculations are indicative because SON functions are not fully mature in wireless network. The future research on SON can involve automatic small cells management, due to its complex nature in next generation mobile network (NGMN).
Acknowledgements
The author wish to acknowledge the exertion and backing of his supervisor and Lab-Fellow, Dr. Yang Qinghai Ph. D. in Communication Engineering from Inha University, Korea in 2007 with University-President award.
Cite this paper
Kamboh, U.R., Yang, Q.H. and Qin, M. (2017) Impact of Self-Organizing Networks Deployment on Wireless Service Provider Businesses in China. Int. J. Communications, Network and System Sciences, 10, 78-89. https://doi.org/10.4236/ijcns.2017.105B008
References
- 1. Goncalves, V. and Delaere, S. (2010) Business Ana- lysis of Self-Organisation in Future Mobile Networks. Proc. of IEEE Future Network and Mobile Summit, June 2010, 1-8.
- 2. Gabriel, L., Grech, M., Kontothanasi, F., et al. (2011) Economic Benefits of SON Features in LTE Networks. Proc. of IEEE Sarnoff Symposium, May 2011, 1-5 https://doi.org/10.1109/SARNOF.2011.5876466
- 3. Next Generation Mobile Networks Recommendation on SON and O&M Re-quirements, Dec 5, 2008.
- 4. Ramiro, J. and Hamied, K. (2012) Self-Organizing Networks (SON): Self-Planning, Self-Optimization and Self-Healing for GSM, UMTS and LTE. Self-Organizing Networks.
- 5. 3GPP TS 32.500 (2010) Telecommunication Management; Self-Organizing Networks (SON); Concepts and Requirements (Rel. 10), Sep.
- 6. 3GPP TS 32.501 (2010) Telecommunication Management; Self-Con of Network Elements; Concepts and Requirements (Rel. 9), Mar.
- 7. 3GPP, Next Generation Mobile Networks (NGMN) Alliance, Requirement Specification (2008) NGMN Recommendation on SON and O&M Requirements, Version 1.23, December 2008.
- 8. 3GPP, Next Generation Mobile Networks (NGMN) Alliance, Deliverable (2008) NGMN Use Cases Related to Self-Organising Network, Overall Description, Version 2.02, December 2008.
- 9. 3GPP UID 630010 (2014) Self-Organizing Networks (SON)-OAM aspects: Operations, Administration, Maintenance and Provisioning (OAM&P). SA5. (Rel.13) June.
- 10. 3GPP, Technical Specification, Technical Specification Group Service and System Aspects (2010) X2 Application Protocol (X2AP), 3GPP TS 36.423 Version 9.3.0, Release 9, 15 June 2010.
- 11. 3GPP TS 32.521 (2010) Self-Organizing Networks (SON) Policy Network Resource Model (NRM) Integration Reference Point (IRP); Requirements (Rel. 9), Mar.
- 12. 3GPP TS 32.541 (2010) Telecommunication Management; Self-Organizing Networks (SON); Self-Healing Concepts and Requirements (Rel. 10), Jul.
- 13. 3GPP, Technical Specification, Technical Specification Group Services and System Aspects (2010) Self- Healing Concepts and Requirements, 3GPP TS 32.541 Version 1.4.0, Release 10, 6 August 2010.
- 14. Menon, R., Yun, J., Gormley, E., et al. (2013) SON for Government Spectrum Applications. MILCOM 2013-2013 IEEE Military Communications Conference, 1308- 1315. https://doi.org/10.1109/MILCOM.2013.223