Open Journal of Stomatology, 2011, 1, 55-60
doi:10.4236/ojst.2011.13010 Published Online September 2011 (http://www.SciRP.org/journal/OJST/ OJST
).
Published Online September 2011 in SciRes. http://www.scirp.org/journal/OJST
Qualitative analysis of remineralized carious lesions
subjected to fluoride supplement through confocal laser
scanning microscope
K. Shashikala*, N. V. Sheela
Department of Conservative Dentistry and Endodontics, R. V. Dental College& Hospital, Bangalore, India.
Email: *shashbang2007@rediffmail.com
Received 10 June 2011; revised 25 July 2011; accepted 3 August 2011.
ABSTRACT
Aim: 1] Comparative evaluation of the linear depth
of induced remineralized lesions after subjecting to
fluoride supplements and 2] To assess the average
fluorescence at both the demineralized and the re-
mineralized zones in all the three study groups under
confocal laser scanning microscope. Method: Forty
five sound human premolars extracted for orthodon-
tic reasons were decoronated 1 mm below the ce-
mento-enamel junction and coated with nail varnish
except for a 3 × 3 mm window on the buccal surface.
The samples were placed in 50 ml of de mineralizing
solution at pH 4.6 for 96 hours. Following deminer-
alization, the lower half of the 3 × 3 mm window in
all the samples were covered with nail varnish to
serve as control. The samples were randomly divided
into three groups of fifteen teeth each (n = 15) and
specimens in group A[Nfd] were remineralized using
non-fluoridated dentifrice [control], those in groups
B [Fd5] a nd group C [Fd10] using 500 ppm and 1000
ppm of fluoride containing dentifrice, respectively.
The specimens were subjected to a 20 day reminer-
alization treatment regimen and were sectioned into
100 µm thick sections and two images were captured
on the buccal surface from either side of the midpoint
of occluso-cervical length using confocal laser scan-
ning microscope [CLSM]. Results: were tabulated
and statistically analyzed by Anova. Study concluded
that 1000 ppm fluoridated dentifrice showed a
greater degree of remineralization than other groups
and confocal laser scanning microscopes gives prom-
ising results in the diagnosis of early enamel lesions
over the conventional methods.
Keywords: Dental Caries; Fluoridated Dentifrice;
Confocal Laser Scanning Microscope
1. INTRODUCTION
Dental caries is a complex disease process that afflicts a
large population of the world, regardless of gender, age
and ethnicity, although it does tend to affect more indi-
viduals with a low socio-economic status to a greater
extent. Tooth minerals are lost and regained constantly in
the human oral environment. The tooth health is hence
dependent upon eq uilibrium of this mineral exchange. A
break in the equilibrium causes the tooth to either de-
mineralize or remineralize depending upon the concen-
tration of the mineral saturation in the oral cavity [1 ].
Over the last few decades, fluoride in various forms
has been proven to reduce caries in both the primary and
permanent dentitions when used in a variety of ways.
This is because it acts as a catalyst and influences reac-
tion rates with dissolution and transformation of hy-
droxyapatite to fluorapa tite that resists the demineraliza-
tion process in the tooth. Various topical agents like
fluoridated solutions, gels, mouth rinses and dentifrices
have been used to hasten the remineralization of these
carious lesions [2]. Fluoridated dentifrice in various
concentrations has been used to bring about reminerali-
zation of the carious lesion since it is a most common
and easily available vehicle that is used to cleanse the
teeth worldwide and can deliver fluoride topically to the
oral cavity. Remineralization of the carious lesions
caused by the action of fluoride supplements have been
analyzed by various qualitative and quantative techni-
ques of measurement of tooth mineral changes that in-
clude Polarized Light Microscopy (PLM), light scatter-
ing, Polarization-Sensitive Optical Coherence Tomo-
graphy, Transverse Microradiography, Energy Disper-
sive X-ray analysis, cross-sectional microhardness de-
termination and Confocal Laser Scanning Microscopy.
Confocal laser scanning microscopy is a powerful imag-
ing techniq ue based upon opti cal behavi o r o f li g ht within
specimens. Generally, confocal analysis features excita-
K. Shashikala et al. / Open Journal of Stomatology 1 (2011) 55-60
56
tion (such as fluorescence) although emission detection
is also possible [3]. The optical property of this tech-
nique helps in the detection of carious and non-carious
lesions of the tooth [4]. To date, not much information is
available on the usage of confocal microscope for the
analysis of early enamel lesions of the tooth.
Therefore, the aim of the present study is 1) Compara-
tive evaluation of the linear depth of induced remineral-
ized lesions [measured in microns] after subjecting to
fluoride supplements and 2) To assess the average fluo-
rescence at both the demineralized and the remineralized
zones in all the three study groups under confocal laser
scanning microscope.
2. MATERIALS AND METHODS
Forty five healthy human premolars which were ex-
tracted for orthodontic purposes and with no patient
identifiers were collected from the Department of Oral
and maxillofacial Surgery. The teeth were cleaned thor-
oughly to remove any blood, soft tissue or extrinsic de-
posits with hand scaler. They were stored in 100 ml of
10% buffered formalin (pH 6.8 to 7.0) for a period of
three months until they were used for the study. Teeth
were sectioned 1mm below the cemento-enamel junction
with a slow speed diamond disc. The roots were dis-
carded and the crowns were used for the study.
2.1. Artificial Smooth-Surface Enamel Lesion
Formation (Demineralization Procedure)
All the samples were covered with nail varnish leaving a
window of 3 × 3 mm on the buccal surface and were
kept in a 50 ml of de mineralizing solution in a sterile
glass beaker, which was a mixture of calcium chloride
[2.0 mmol/L], tri sodium phosphate [2.0 mmol/L] in
acetate buffer [75 mmol/L] solution at pH 4.6 for 96
hours. Following demineralization, the lower half of the
3 × 3 mm window in all the samples were covered with
nail varnish to serve as control. The samples were ran-
domly divided into three groups of fifteen teeth each [n
= 15] before they were being subjected to the pH cycle.
Group Nfd: Remineralization of the lesion using non-
fluoridated dentifrice tooth paste [Meswak Dabur, India]
was used as a control.
Group Fd5: Remineralization of the lesion using 500
ppm of fluoride containing Dentifrice Bubble Fruit tooth
paste [Colgate, India].
Group Fd10: Remineral iz at ion of t he le si on u si ng 100 0
ppm of fluoride containing Dentifrice-Colgate Total too-
th paste [Colgate, India].
2.2. Stimulated Whole Saliva Collection
Five healthy female adult volunteers in the age group of
18 yrs - 25 yrs who had full complement of teeth with no
past caries experience were chosen for the collection of
saliva between 9 am to 11 am, after obtaining clearance
from institutional ethical committee and written in-
formed consents from participating individuals. The se-
lected subjects were not on any medication that influ-
enced the salivary flow rate or had any salivary pathol-
ogy, with no faulty dental restorations, no current caries
activity, and no active periodontal disease, and were
neither with dental prosthesis nor with orthodontic ther-
apy. They were made to brush the teeth with a non-
fluoridated dentifrice and later made to rinse thoroughly
prior to the collection of saliva. They were then made to
chew on paraffin wax and empty the stimulated saliva
into sterile containers in about 5 mins. The 15 ml of the
sample was collected and stored under refrigeration until
use.
2.3. The Ph Cycling Regimen (Remineralization
Procedure)
Group Nfd: Sample of 15 teeth were subjected to a 20
day remineralization treatment regimen by immersion in
fresh non-fluoridated dentifrice slurry prepared by add-
ing 5 g of dentifrice in 10 ml of water in a glass beaker
for 2 mins, followed by rin sing with distilled water. The
remineralizing period wherein the teeth were immersed
in 15 ml of collected saliva sample was for 2 hrs.
The teeth were then subjected to 4 hrs of acid chal-
lenge in order to simulate the oral environment like the
in-vivo conditions, where samples were subjected to 15
ml of demineralizing solution, followed by 2 hrs of im-
mersion in 15 ml of saliva and then subjecting it to the
dentifrice for 2 mins again and then immersion in saliva
for the rest 16 hrs. The saliva samples were changed
each day during the acid challenge period. The proce-
dure was repeated for Groups Fd5 and Fd10 specimens,
wherein the dentifrices used contained 500 and 1000
ppm of fluoride respectively, unlike the non-fluoridated
dentifrice used in Gro up NFd.
2.4. Post-Treatment Analysis
Following the treatment period the specimens were mo-
unted in self-cure acrylic resin. The samples were sec-
tioned longitudinally perpendicular to the varnished area
so that each section included the varnish-covered base-
line lesion area and the uncovered, post-treatment lesion
area with a hard tissue microtome (Leica SP 1600) to
obtain specimens that were 100 microns thick.
The sections were polished with an abrasive stone and
were then stained with freshly prepared 0.1 mM Rhoda-
mine B solution for 1 hr. The stained samples were
washed thoroughly with phosphate buffer solution until
there was no dye leaching out of the sample. All samples
were mounted on frosted glass slides with 80% glycerol
mountant and the edges of the cover slip were coated
C
opyright © 2011 SciRes. OJST
K. Shashikala et al. / Open Journal of Stomatology 1 (2011) 55-60
Copyright © 2011 SciRes.
57
OJST
with transparent nail enamel for further analysis th rough
the Confocal Laser Scanning Microscope, Leica TCS SL
inverted microscope.
The images with CLSM were captured from the buc-
cal surface that is one each from either side of the mid-
point measured from the occluso-cervical length of the
tooth at [5×] magnification and Argon laser was used at
488 nm wavelength for excitation and emission range of
498 - 514 nm wavelength. Two images were captured on
the buccal surface from either side of the midpoint of
occluso-cervical length. The buccal surface areas were
scanned between 10 and 50 microns below the cut sur-
face and the superficial areas were not scanned because
of the concern regarding the smear layer. The captured
images were calibrated for linear depth of fluorescence
and also the average/total fluorescence of the lesion us-
ing the Leica TCS SL in-built software, Germany.
3. RESULTS
A Comparative evaluation of all the samples was under-
taken to study, 1) The linear depth of lesions in microns
[µm], as seen through con focal laser scanning micro-
scope and 2) To assess the average fluorescence at both
the demineralized and the remineralized zones in all the
three study groups under confocal laser scanning micro-
scope.
The induced carious lesion depths were assessed un-
der CLSM by measuring from the enamel surface to the
deeper zone of the lesion and an average of ten meas-
urements were taken from every image that was captured
both in the demineralized and remineralized zone of the
3 × 3 mm window of every specimen of all the three
groups. The measurements were tabulated and statistically
analyzed by Anova and student t test (Tables 1 and 2).
The extent of 0.01 mM Rhodamine B dye penetration
seen as fluorescence in the specimens under Argon Laser
were also calibrated and recorded with the in-built soft-
ware [Leica TCS SL, Germany]. The average of the
mean amplitude obtained from the images of the speci-
mens of the three groups was also tabulated and ana-
lyzed (Figures 2 and 3).
Confocal microscopic evaluation in the present study
shows that the highest value for demineralization after
96 hrs was seen in the control group, which was 183.41
± 7.81 µm and the lowest was for group NF5 [500 ppm
dentifrice] which was 180.91 ± 7.78 µm. Similarly the
highest value of remineralization was 156.74 ± 7.95 µm
seen in the group NFd specimens showing that the val-
ues were significant [p < 0.001] and the remineralization
values were 124.07 ± 3.46 µm lowest for group Fd10
[1000 ppm dentifrice]. A p-value of 0.616 was obtained
for the demineralization under CLSM (Figure 1).
Descriptive statistical analysis was carried out in the
present study. Results on continuous measurements were
presented on Mean SD (Min-Max) and results on
categorical measurements are presented in Number (%).
Significance was assessed at 5% level of significance.
Analysis of variance (ANOVA) was used to find the
significance of study parameters between three or more
groups of specimens, Student t test (two tailed, inde-
pendent) was used to find the significance of study pa-
rameters on continuous scale between two groups (Inter
group analysis) on metric parameters, Student t test (two
tailed, dependent) was used to find the significance of
study parameters on continuous scale within each group.
4. DISCUSSION
The use of artificial caries systems has greatly increased
Table 1. Evaluation of linear depth of lesion in µm as seen through confocal laser scanning microscope for both
demineralized and remineralized areas.
Zone Group NFd [Control]Group Fd5 Group Fd10 P value
Demineralised 183.41 ± 7.81 180.91 ± 7.78 181.54 ± 5.84 0.616
Reminerali ze d 156.74 ± 7.95 144.65 ± 5.71 124.07 ± 3.46 < 0.001**
Difference 26.67 ± 13.01 36.26 ± 7.57 57.47 ± 6.67 -
P value < 0.001** < 0.001** < 0.001** -
Table 2. Evaluation of average fluorescence in µm under Con focal laser scanning microscope.
Zone Group Nfd [Control ] Group Fd5 Group Fd10 P va lue
Demineralized 83.41 ± 7.81 80.31 ± 8.95 80.07 ± 8 .41 0.363
Reminerali ze d 54.07 ± 6.44 40.29 ± 4.77 25.54 ± 4.63 < 0.0014**
Difference 29.34 ± 9.13 40.03 ± 7.87 54.53 ± 9.7 3 -
P value < 0.001** < 0.001** < 0.001** -
+ Suggestive significance (P value: 0.05 < P < 0.10); * Moderately significant (P value: 0.01 < P 0.05) ** strongly significant (P
value: P 0.0 1) .
K. Shashikala et al. / Open Journal of Stomatology 1 (2011) 55-60
58
0
50
100
150
200
250
Group AGroup BGroup C
con focal l aser scannin g m icro scop e
Demineralised
Rem ineralize d
0
10
20
30
40
50
60
70
80
90
100
Group AGroup BGroup C
average flu orescence in confocal laser
Dem ineralis ed
Rem ineralize d
(a) (b)
Figure 1. (a) Average linear depth of lesion in µm as seen through confocal laser scanning microscope for both de mineralized and re
mineralized areas. (b) Average fluorescence in µm as seen through the confocal laser scanning microscope for both de mineralized
and re mineralized areas.
(a) (b) (c) (d) (e)
Figure 2. CLSM images [5×] of occlusal aspect of the 3 × 3 mm window of specimens. (a) Nfd group.(b) Fd5 group (c) Fd10 group
showing 2D and (d) 3D reconstruction of the images at every 10 µ stack, arrows indicate de mineralized and arrow heads indicate re
mineralized zones. (e) Image of group Fd10 specimen [20 × zoom] showing demineralized and re mineralized zones and the enamel
rods.
(a) (b)
Figure 3. (a) Images showing the method of calibration with the Leica TCS SL in-built software. (b) Calibrated Image showing the
graph of the intensity of fluorescence along the ten measurements (ROI 1-10) and the table showing the length measurements and
means amplitude along with minimum and maximum amplitude of fluorescence.
C
opyright © 2011 SciRes. OJST
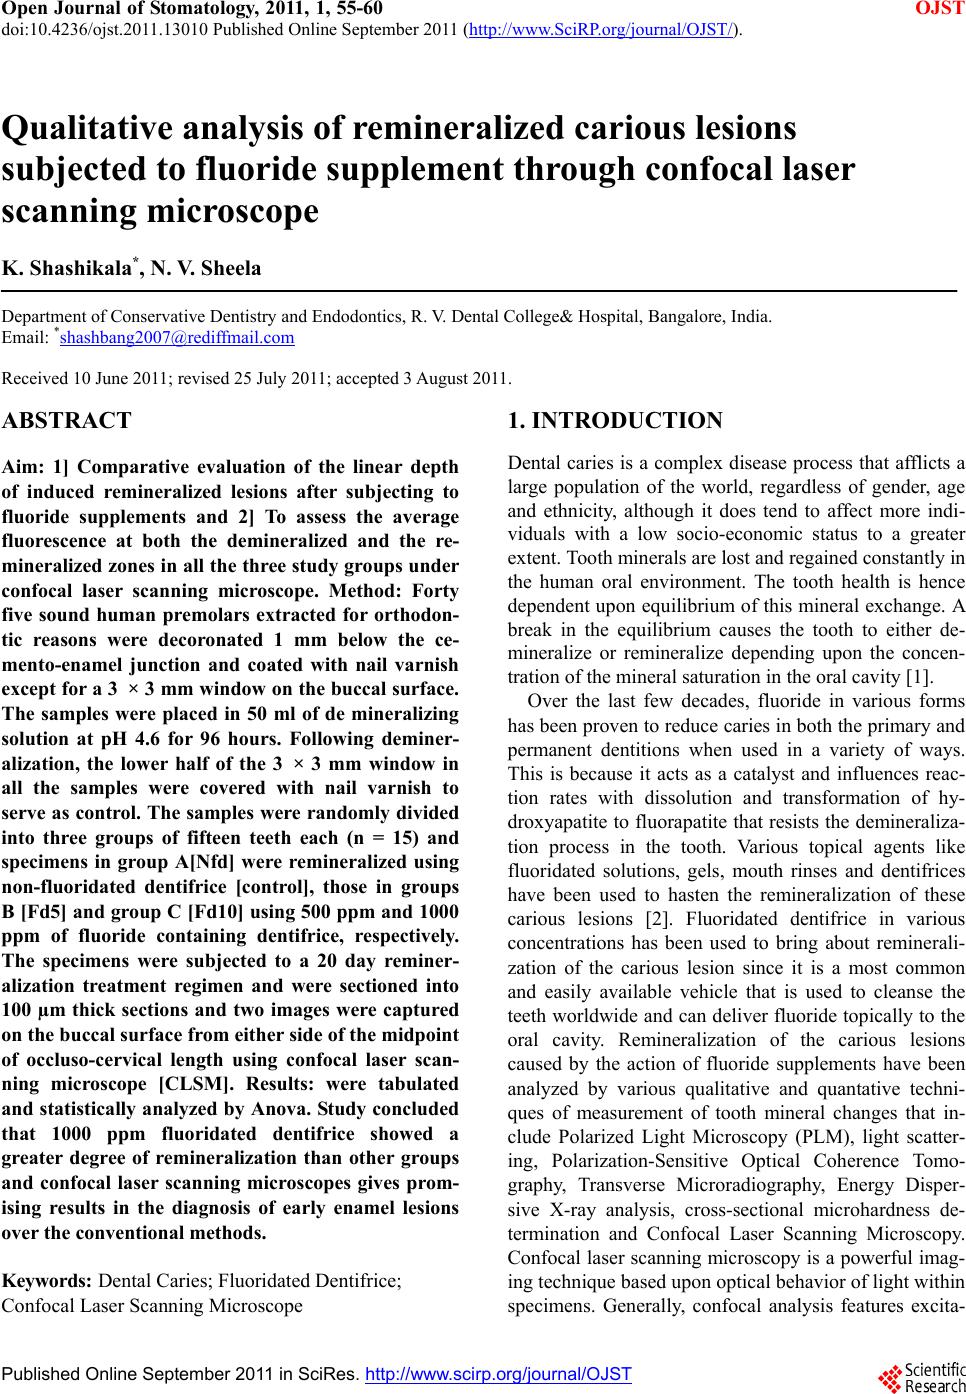
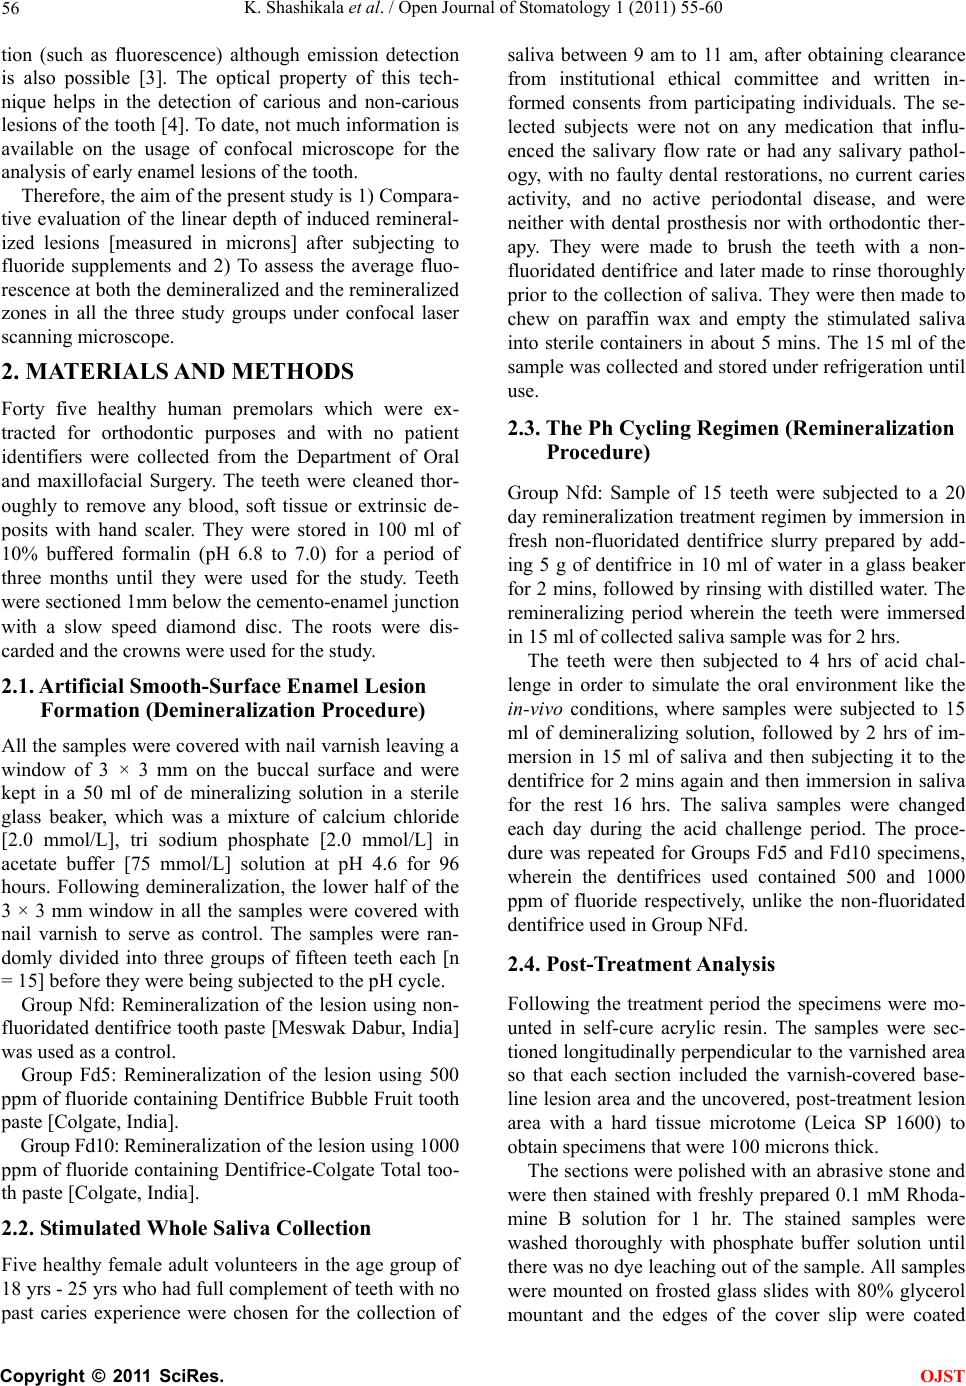
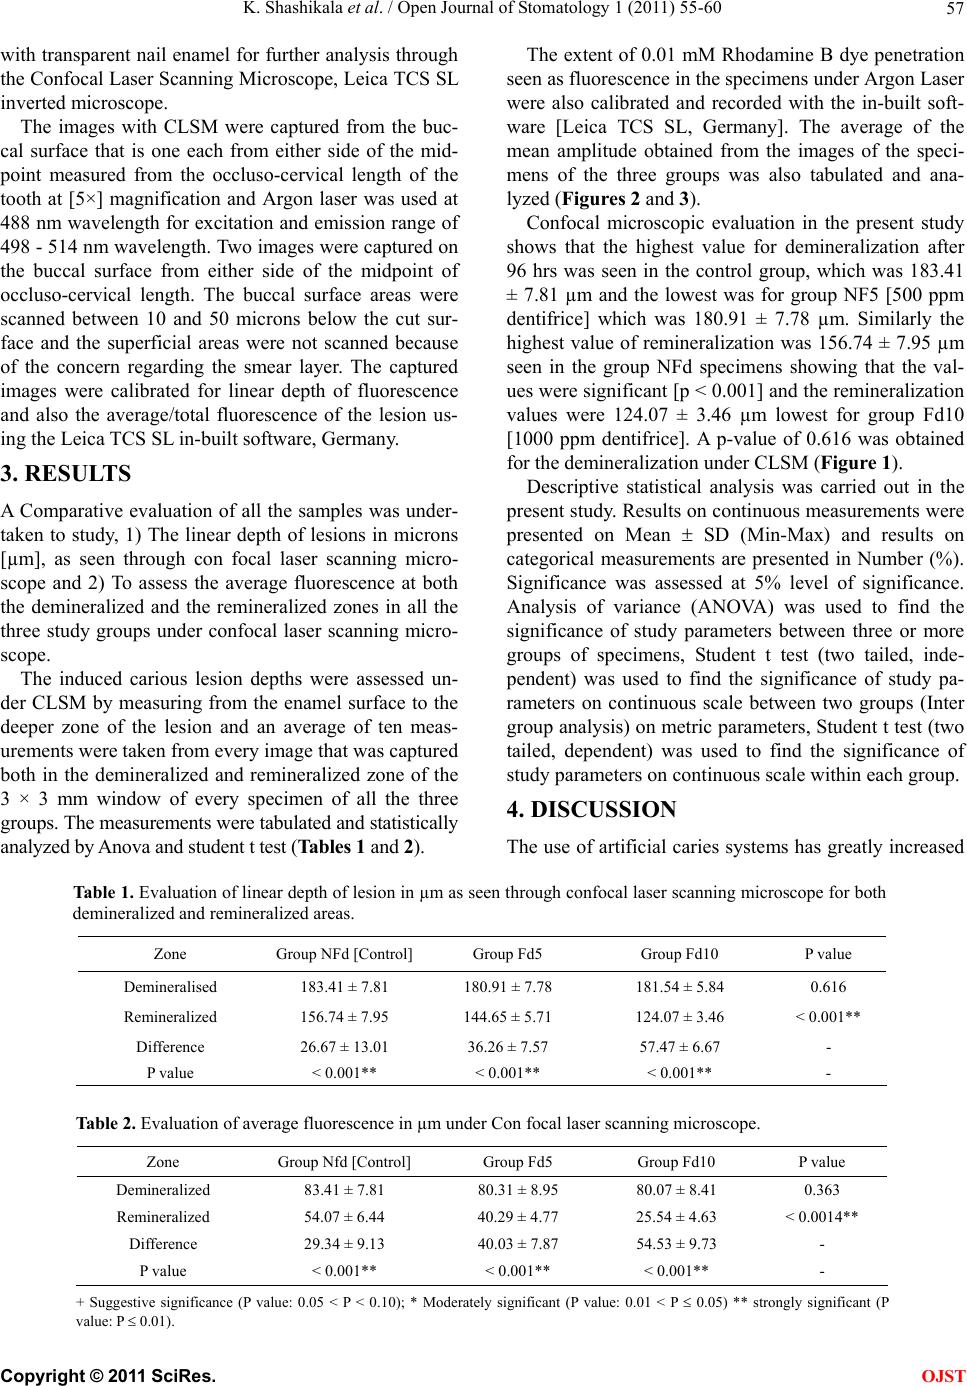
K. Shashikala et al. / Open Journal of Stomatology 1 (2011) 55-60 59
our knowledge of the demineralization and remineraliza-
tion process [13]. The administration of fluoride has
been proposed, and used, as a method of reducing
enamel susceptibility to decalcification since the time it
was discovered in the early 20th century by eminent
investigators like McKay and Black [5]. Fluoride affects
the caries process by enabling the formation of high
quality fluorapatite that aids remineralization and inhib-
its glycolysis of plaque microorganisms [6]. The early
attempts to incorporate fluoride into toothpastes which
dates back to the 1960s and it is one of the most com-
mon and effective modes of topical fluoride delivery [7].
Hence, in the present study a non-fluoridated denti-
frice has been used as a control along with two higher
concentrations of fluoride, that is 500 ppm and 1000
ppm for comparison. The study was designed in such a
way that it simulated an oral environment subjected to
acid and remineralization twice a day.
Monitoring demineralization and remineralization of
dental hard tissues is essential for the prevention and
minimally invasive treatment of dental caries and hy-
persensitivity [8]. Light based methods used for the de-
tection of dental caries induced enamel demineralization
are Conventional radiography, micro radiography, Digi-
tal Imaging Fiber Optic Trans illumination Imaging
[DIFOTI], laser induced fluorescence [DIAGNO dent],
and quantitative light-induced fluorescence [QLF]. Con-
ventional microscopy suffers from the problem as light
scattering, namely multiple scattering from objects that
are out of focus within the illuminated region prevents
imaging deep within a sample. Further, if care is not
taken, optical microscopy can lead to the observation of
certain artifacts which in turn leads to incorrect physical
interpretation of the system in question [3 ,9].
Confocal microscopy and its application in dentistry
have been advocated by Watson [9]. CLSM overcomes
the limitations of conventional wide-field microscopy
through: high resolution fluorescence, high resolution
3-D imaging, non-destructive imaging technique and
in-situ characterization of tissue microstructure images.
Fontana performed a study to correlate area of lesion,
average fluorescence and total fluorescence obtained by
con focal microscopy to lesion depth and mineral loss
obtained from micro radiography and polarized light
microscopy. The findings show that when a 0.1 mM so-
lution of rhodamine B dye was used, the lesion area cor-
related well with the mineral loss obtained from micro
radiography [10].
However, the average lesion fluorescence best repre-
sented mineral loss, based on their hypothesis that rho-
damine B penetrates the voids and pores created during
enamel demineralization which is a better method of
evaluation over the birefringence through CLSM. Ca-
bezas also conducted a correlation study between micro
radiography and con focal microscopy for measurement
of enamel remineralization. As described by Fontana, 0.1
mM rhodamine B dye was used and lesion area, total
fluorescence and average fluorescence were evaluated.
Lesion area was the confocal parameter that showed the
strongest correlation with microradiography, followed by
total lesion fluorescence [8,10].
The present study showed a lesser degree of reminer-
alization with the non-fluoridated dentifrices which was
similar to the study by Gonzalez [10], who had used 250
ppm and 1100 ppm dentifrices along with a placebo con-
trol. It was also seen in the study that the linear depth
measurements of the lesion both in the de mineralized
zone and the re mineralized zone varied significantly
under the con focal microscopic. This is on par with the
analysis by the earlier studies [11,12] showing that con
focal microscopy is an advanced tool to diagnose and
measure early enamel lesions both in-vivo and in-vitro
without requiring the tooth to be sectioned.
Fluorides are effective means of remineralization of
carious lesions in higher concentrations (1000 ppm) as
compared to the non-fluoridated control or 500 ppm
concentration [13]. Diagnosis of early enamel carious
lesions still remains a challenge to dentists worldwide.
Various in-vitro studies show promising results with con
focal laser scanning microscope as a diagnostic aid for
early carious lesion detection. This appro ach will enable
the operator to circumvent errors due to variation in the
thickness of enamel at different locations of the crown.
Recent evolution in techniques and technologies have
facilitated a relatively wide spread adoption of this im-
aging diagnostic modality with increased “user friendli-
ness and flexibility”. Study concluded that 1000 ppm
fluoridated dentifrice showed a greater degree of remin-
eralization than other groups and con focal laser scan-
ning microscopes gives promising results in the diagno-
sis of early enamel lesions over the conventional meth-
ods.
REFERENCES
[1] Sturdevant, C.M., Roberson, T.M. and Heymann, H.O.
(2006) The art and science of operative dentistry. 5th
Edition, Mosby Publishers, St. Louis.
[2] Queiroz, C.S. and Hara, A.T. (2008) PH-cycling models
to evaluate the effect of low fluoride dentifrice on enamel
de- and remineralization. Brazilian Dental Journal, 19,
21-27. doi:10.1590/S0103-64402008000100004
[3] Kishen, A., Shrestha, A. and Rafique, A. (2008) Fiber
optic backscatter spectroscopic sensor to monitor enamel
demineralization and remineralization in vitro. Journal of
Conservative Dentistry, 11, 63-70.
doi:10.4103/0972-0707.44053
[4] Ferriera-Zandona, A.G., Analoui, M. and Beiswanger,
C
opyright © 2011 SciRes. OJST
K. Shashikala et al. / Open Journal of Stomatology 1 (2011) 55-60
Copyright © 2011 SciRes.
60
OJST
B.B. (1998) An in vitro comparison between laser fluo-
rescence and visual examination for detection of demin-
eralization in occlusal pits and fissures. Caries Research,
32, 210-218. doi:10.1159/000016455
[5] Hicks, J., Garcia-Godoy, F. and Flaitz, C. (2004) Bio-
logical factors in dental caries: Role of saliva and dental
plaque in the dynamic process of demineralization and
remineralisation (Part II). Journal of Clinical Pediatric
Dentistry, 28, 119-124.
[6] Kumar, V.L.N., Itthagarun, A. and King, N.M. (2008)
The effect of casein phosphopeptide-amorphous calcium
phosphate on the remineralization of artificial caries-like
lesions: An in vitro study. Australian Dental Journal, 53,
34-40. doi:10.1111/j.1834-7819.2007.00006.x
[7] Zaura, E., ten Cate, J.M. (2004) Dental plaque as a
biofilm: A pilot study of the effects of nutrients on plaque
pH and dentin demineralization. Caries Research, 38,
9-15. doi:10.1159/000074357
[8] Fontana, M., Li, Y. and Dunipace, A.J. (1996) Measure-
ment of enamel demineralization using microradiography
and confocal microscopy. A correlation study. Caries
Research, 30, 317-325. doi:10.1159/000262337
[9] Watson, T.F. (1991) Applications of confocal scanning
optical microscopy to dentistry. British Dental Journal,
171, 287-291. doi:10.1038/sj.bdj.4807695
[10] Gonzalez-Cabezas, C. and Fontana, M. (1998) Meas-
urement of enamel remineralization using microradio-
graphy and confocal microscopy. Caries Research, 32,
385-392. doi:10.1159/000016475
[11] Hall, A.F., DeSchepper, E. and Ando, M. (1997) In vitro
studies of laser fluorescence for detection and quantifica-
tion of mineral loss from dental caries. Advance Dental
Research, 11 , 507-514.
doi:10.1177/08959374970110041901
[12] Hafstrom-Bjorkman, U. (1996) Comparison of laser fluo-
rescence and longitudinal microradiography for quantita-
tive assessment of in vitro enamel caries. Caries Re-
search, 26, 241-247. doi:10.1159/000261446
[13] Wefel, J.S. and Harless, J.D. (1984) Comparison of arti-
ficial white spots by microradiography and polarized light
microscopy. Journal of Dental Research, 63, 1271-1275.
doi:10.1177/00220345840630110301