Advances in Materials Physics and Chemistry, 2011, 1, 39-43
doi:10.4236/ampc.2011.12007 Published Online September 2011 (http://www.SciRP.org/journal/ampc)
Copyright © 2011 SciRes. AMPC
Synthesis, Crystal Growth and Characterization
of Organic NLO Material: M-Nitroacetanilide
Ramesh Rajendran1, Thangammal Harris Freeda1, Udaya Lakshmi Kalasekar 2, Rajesh Narayana Peruma3
1Physics Research Center, S. T. Hindu College, Nagercoil, India
2Department of Physics, College of Engineering and Technology, Saveetha University, Chennai, India
3Center for Crystal Growth, SSN College of Engineering, Kalavakkam, Chennai, India
E-mail: rajeshnp@ssn.edu.in
Received May 3, 2011; revised June 17, 2011; accepted June 25, 2011
Abstract
Single crystals of m-Nitroacetanilide (mNAa) were successfully grown by slow evaporation method at a
constant temperature 40°C from methanol solution. The solubility studies for mNAa were estimated. The cell
dimensions were obtained by single crystal X-ray diffraction (XRD) study. The functional groups have been
confirmed using Fourier transform infrared (FTIR) analysis. The placement of protons was identified from
Nuclear Magnetic Resonance Spectroscopy (NMR) spectral analysis. UV-visible and fluorescence spectral
analyses were carried out for the grown crystals. Thermo gravimetric analysis and differential thermal analy-
sis were carried out to determine the thermal properties of the as grown crystal. The Second Harmonic Gen-
eration (SHG) efficiency of mNAa was also determined.
Keywords: Supersaturated Solution, X-Ray Diffraction, Single Crystal Growth, Organic Compounds,
Nonlinear Optic Materials
1. Introduction
Nonlinear optical materials (NLO) have proven to be an
interesting candidate for a number of applications such
as second harmonic generation, frequency mixing, elec-
tro-optic modulation, etc. In recent years, organic NLO
materials are attracting a great deal of attention for possi-
ble use in optical devices because of their large optical
nonlinearity, low cut-off wavelengths, short response time
and high laser damage thresholds [1]. Considerable work
has been done in order to understand the microscopic
origin of nonlinear behavior of organic materials [2-5].
The NLO properties of large organic molecules and po-
lymers have been the subject of extensive theoretical and
experimental investigations during the past two decades
and they have been investigated widely due to their high
nonlinear optical properties, rapid response in electroop-
tic effect and large second- or third-order hyperpolar-
izibilities compared to inorganic NLO materials [6]. Th-
us, there is much impetus to design and understand or-
ganic compounds for SHG applications.
To possess NLO property organic materials should
contain highly conjugated electron system affected by
electron donor and acceptor groups. Hence in this class
one such acetanilide derivatives, mNAa was taken under
study which showed efficient NLO property. Some of the
acetanilide derivatives such as Acetoacetanilide [7,8] and
p-aminoacetanilide [9] were found to exhibit NLO prop-
erties. mNAa is a meta substituted aromatic compound
with molecular formula C8H8N2O3. The molecular struc-
ture of mNAa, given in Figure 1, shows the charge
transfer between electron acceptor (NO2) and electron
donor (NHCOR where R = CH3) groups. This compound
crystallizes in the monoclinic system in the chiral space
group P21 with four independent molecules in the
asymmetric unit. In this paper, we report the material
synthesis, solubility, crystal growth, single crystal X-ray
diffraction (XRD), Fourier Transform Infrared Spec-
troscopy (FTIR), optical, Fluorescence, thermal and NLO
studies of mNAa.
Figure 1. Molecular structure of mNAa.
R. RAMESH ET AL.
40
2. Experimental
2.1. Material Synthesis
The title compound was synthesized from analytical re-
agent (AR) mNA and acetic anhydride following the
procedure given by Mahalakshmi et al. [10]. Required
quantity of m-nitroaniline was dissolved in acetic anhy-
dride at room temperature. The direct reaction between
them as shown in the Scheme 1 immediately yielded
yellow colour compound. The precipitated product was
filtered and dried using vacuum filtration. The material
was repurified by recrystallization processes.
2.2. Solubility and Crystal Growth
The solubility of mNAa was determined using methanol,
since methanol is found to be a suitable solvent to grow
considerable size crystals. Recrystallized salt was dis-
solved in methanol and the solution was maintained at
30˚C in a constant temperature bath and stirred continu-
ously to ensure homogenization of the solution. On re-
aching the saturation, the amount of the salt in the solu-
tion was analyzed gravimetrically. The same procedure
was repeated for the temperatures 35˚C, 40˚C, 45˚C and
50˚C and results are shown in Figure 2. The mNAa ex-
hibits good solubility and a positive solubility-tempera-
ture gradient in methanol. From the figure we understand
that the solubility of mNAa is going saturated at higher
temperatures.
Scheme 1. Reaction mechanism of m-Nitroacetanilide.
30 35 40 45 5055 60
5.0
5.5
6.0
6.5
7.0
7.5
8.0
Concentration (gm/CC)
Temperature deg C
Figure 2. Solubility curve of mNAa.
Single crystals of mNAa were grown by slow evapo-
ration growth technique using methanol as the solvent.
About 250 ml of saturated solution was prepared at 40˚C
and it was carefully filtered at the same temperature us-
ing Whatman filter paper of pore size 11 μm. The filtered
solution was taken in a beaker and placed in a constant
temperature bath maintained at 40˚C having an accuracy
of ±0.01˚C. Optically good quality seed crystal of di-
mension 7 mm × 2 mm × 1 mm, obtained from slow
evaporation method, was introduced into this solution.
Crystal of dimension 10 mm × 4 mm ×3 mm was har-
vested in a growth period of two days using solvent
evaporation method. The morphology of the harvested
crystal was tetragonal bipyramid as shown in Figure 3.
3. Results and Discussions
3.1. Single Crystal X-Ray Diffraction
Single crystal XRD studies were carried out on the as
grown mNAa crystal using Enraf-Nonius CAD-4 single
crystal XRD reveals that mNAa belongs to monoclinic
system. The unit cell parameters obtained are a = 9.7609
Å (9.767 Å), b = 13.3084 Å (13.298 Å), c = 13.3124 Å
(13.272 Å), β = 103.15˚ (102.99˚) and cell volume is
1683.8 Å3 (1679.8 Å3). These values are in close agree-
ment with the corresponding values given in parentheses
reported by Mahalakshmi et al. [10].
3.2. Fourier Transform Infrared Spectroscopy
FTIR spectrum of the as grown crystals was recorded in
the range 400 cm–1 - 4000 cm–1 at room temperature us-
ing JASCO 460 plus FTIR spectrometer. The sample was
prepared following the pressed KBr pellet technique. The
presence of functional groups of the sample, were identi-
fied from the spectrum as shown in Figure 4. The ab-
sorption at 3263 cm–1 is due to N-H stretching. The peak
at 1674.10 cm–1 corresponds to C = O stretching vibra-
tion of carbonyl group. The presence of nitro group is
confirmed by the peaks at 1556.88 cm–1 and 1599 cm–1.
The peaks at 1380 cm–1, 1472.81 cm–1 and 1426.40 cm–1
are due to C = C stretching [11-13].
3.3. Nuclear Magnetic Resonance Spectroscopy
(NMR)
NMR spectrum of mNAa was recorded using JEOL GS
× 400 model FT-NMR spectrometer. mNAa crystal was
powdered and dissolved in deuterated Dimethyl Sulfox-
ide (DMSO). FT-NMR spectrum recorded for mNAa is
shown in Figure 5. A triplet at 7.5 ppm is due to aro-
matic proton. The singlet at 2.07 ppm is assigned to
Copyright © 2011 SciRes. AMPC
41
R. RAMESH ET AL.
Figure 3. Photograph of as grown crystal.
Figure 4. FTIR spectrum of mNAa.
Figure 5. NMR spectrum of mNAa.
CH3 proton. Singlet at 3.37 ppm is due to NH. A singlet
at 10.39 ppm is due to NH proton [12].
3.4. UV-Vis Studies
Optical transmittance spectrum of mNAa single crystal
was recorded in the region 200 nm - 1100 nm using
SHIMADZU 1601 UV-Vis spectrophotometer. The ma-
ximum transmittance is about 61% for mNAa crystal of 3
mm thickness. UV-Vis transmission spectrum presented
in Figure 6 shows that the crystal has good transparency
in the range 340 nm - 1100 nm, which indicates that this
crystal can be employed in the NLO applications in the
entire visible and IR region. The absence of the absorp-
tion in the visible region is the necessity for this com-
pound as it is to be exploited for NLO applications in the
room temperature.
3.5. Fluorescence Studies
Fluorescence may be expected generally in molecules
that are aromatic or contain multiple conjugated double
bonds with a high degree of resonance stability [14].
Fluorescence finds wide application in the branches of
biochemistry and medicine. It is also used as lighting in
fluorescent lamps, Light Emitting Diode (LED) lamps
etc. The excitation and emission spectra for mNAa re-
corded using FP-6500 Spectrofluorometer shown in Fig-
ure 7. The emission spectrum was measured in the range
350 nm - 600 nm. It is observed that the compound was
excited at 340 nm and the corresponding emission was
observed at 409 nm. The compound mNAa fluoresces
due to the carbonyl chromophore [15].
3.6. NLo Studies
A preliminary study of the powder SHG conversion effi-
ciency was carried using Kurtz and Perry powder tech-
nique [16]. Q-switched Nd:YAG laser (QUANTA RAY
ICR 11) of wavelength 1064 nm with an input power of
5 mJ and pulses of 8 ns with the repetition rate of 10 Hz
was used. The crystalline sample of mNAa was pow-
Figure 6. UV-Vis spectrum of mNAa.
Copyright © 2011 SciRes. AMPC
R. RAMESH ET AL.
42
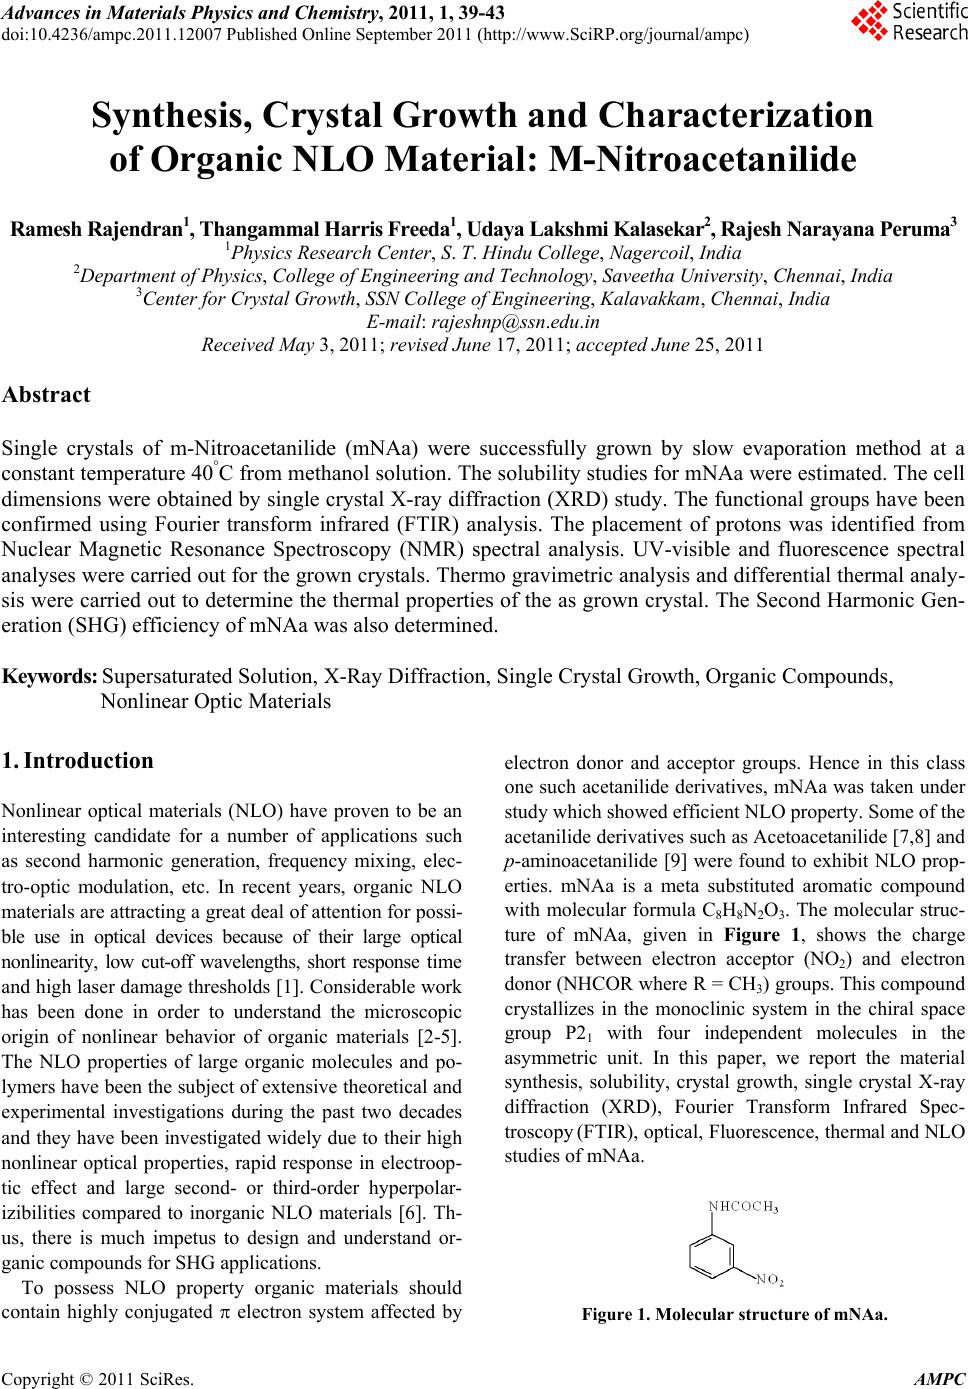
Figure 7. Emission spectrum of mNAa.
dered to a particle size of 125 m. When the powder
sample of mNAa was illuminated with this laser source
emission of green light was observed. In order to deter-
mine the efficiency of mNAa, a sample of parent com-
pound mNA, which is also found to be an important ma-
terial in the research field of nonlinear optics [17] was
powdered to the same particle size and hence was used
as reference material. The SHG conversion efficiency of
mNAa is found to be 0.1 times that of mNA.
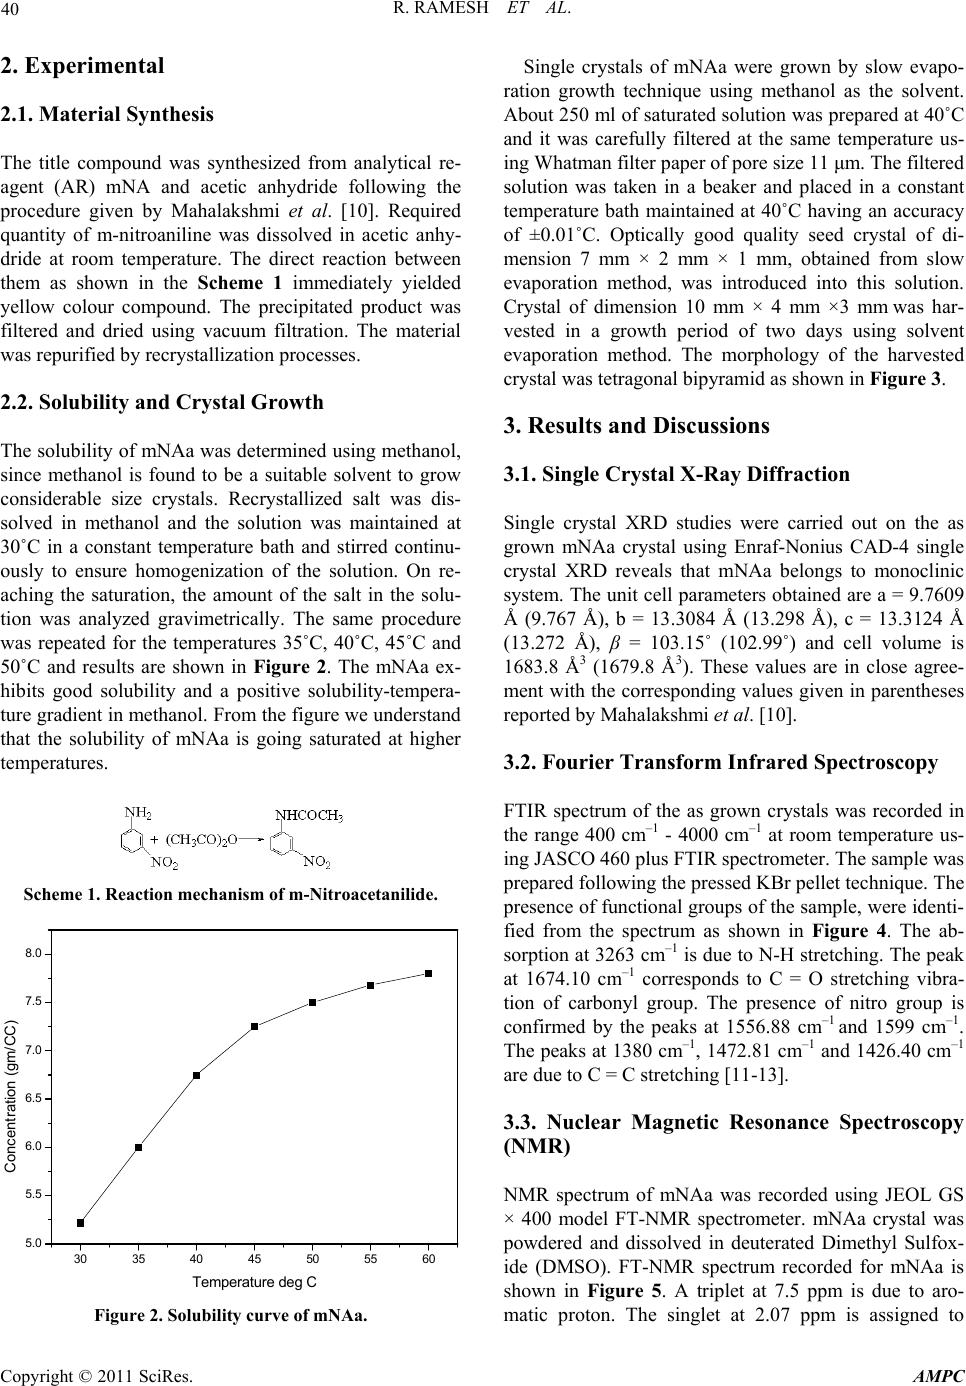
3.7. Thermo Gravimetric Analysis
Thermo Gravimetric Analysis (TGA) and Differential
Thermal Analysis (DTA) were carried out for mNAa and
spectra are shown in Figure 8. They were recorded using
a simultaneous thermal analyzer PL-STA 1500 in nitro-
gen atmosphere for temperature range 20˚C to 800˚C at a
heating rate of 20˚C/min. The sharp endothermic peak in
DTA at 148˚C indicates the melting point of the crystal.
The melting point measured directly using TEMPO
melting point apparatus was 149˚C. There is no exother-
mic or endothermic peak below this endotherm. This
illustrates the absence of any absorbed water in the crys-
tal sample. It also shows the absence of any isomorphic
transition. The material exhibits single sharp weight loss
starting at 215˚C and below this temperature no signifi-
cant weight loss is observed. The sharpness of the peaks
indicates a good degree of crystallinity of the sample.
4. Conclusions
A single crystal of mNAa, an organic NLO material, was
grown by solvent evaporation method from methanol
solution. The single crystal X-ray analysis revealed that
the crystal belongs to monoclinic system. The functional
groups were identified using FT-IR spectroscopic tech-
nique. NMR spectral analysis were carried out to identify
Figure 8. TGA-DTA curves of mNAa.
the position of protons. The optical properties such as
UV-Vis in transmittance mode and second harmonic
generation (SHG) conversion efficiency were investi-
gated to explore the nonlinear optical characteristics of
the above crystal. In addition, the thermal properties of
the mNAa crystal were studied with TG analysis.
5. Acknowledgements
This work supported by the Department of Science and
Technology, New Delhi, India under the grant of project
ref-SR/FTP/PS-20/2005, is hereby gratefully acknowl-
edged. The authors thank Prof. K. Panchanatheswaran,
School of Chemistry, Bharathidasan University, Tiru-
chirappalli for fruitful discussions. The authors also
thank Regional Sophisticated Instrumentation Centre, IIT,
Chennai for recording NMR, FTIR and single crystal
data collection. The authors acknowledge Prof. P. K. Das
and Sampa Ghosh, IISc, Bangalore for having extended
the laser facilities for SHG measurements and Centre for
Electrochemical Research Institute (CECRI) for having
extended the TGA-DTA measurements.
6. References
[1] M. Narayan Bhat and S. M. Dharmaprakash, J. Cryst
Growth, Vol. 236, 2002, pp. 376-380.
doi:10.1016/S0022-0248(01)02094-2
[2] T. Suthan and N. P. Rajesh, J. Cryst. Growth, Vol. 312,
2010, pp. 3156-3160. doi:10.1016/j.jcrysgro.2010.08.002
[3] Huaihong Zhang, Yu Sun, Xiaodan Chen, Xin Yan and
Baiwang Sun, J. Cryst. Growth, Vol. 324, 2011, pp.
196-200. doi:10.1016/j.jcrysgro.2011.03.044
[4] Natalia Zaitseva, Leslie Carman, Andrew Glenn, Jason
Newby, Michelle Faust, Sebastien Hamel, Nerine
Cherepy and Stephen Payne, J. Cryst. Growth, Vol. 314,
2011, pp. 163-170. doi:10.1016/j.jcrysgro.2010.10.139
[5] D. S. Chemla and J. Zyss, “NonlinearOptical Properties
of Organic Molecule and Crystals,” Academic press, New
Copyright © 2011 SciRes. AMPC
R. RAMESH ET AL.
Copyright © 2011 SciRes. AMPC
43
York, 1987.
[6] N. Bloembergen and J. Nonlinear, Opt. Phys. Mater, Vol.
15, 1996, pp. 1-8. doi:10.1142/S0218863596000027
[7] S. G. Prabhu and P. Mohan Rao, J. Cryst Growth, Vol.
210, 2000, pp. 824-827.
doi:10.1016/S0022-0248(99)00843-X
[8] N. Vijayan, R. Ramesh Babu, R. Gopalakrishnan and P.
Ramasamy, J. Cryst. Growth, Vol. 267, 2004, pp.
646-653. doi:10.1016/j.jcrysgro.2004.04.008
[9] D. Sajan, I. Hubert Joe and V. S. Jayakumar, J. Physics:
Conference Series, Vol. 28, 2006, pp. 123-126.
[10] L. Mahalakshmi, V. Upadhyaya and T. N. Guru Row,
Acta Cryst, Vol. E58, 2002, pp. 983-984.
[11] J. R. Dyer, “Applications of Absorption Spectroscopy of
Organic Compounds,” Prentice-Hall of India, New Delhi,
1994.
[12] R. M. Silverstein, G. Clayton Bassler and T. C. Morrill,
“Spectroscopic Identification of Organic Compounds,”
4th edition, John Wiley & Sons, New York, 1981.
[13] Hobart H. Willard, Lynne L. Merritt jr., John A. Dean
and Frank A. Settle jr., “Instrumental Methods of Analy-
sis, Sixth Edition,” Wadsworth Publishing Company,
Florence, 1986, p. 609.
[14] N. J. Turro, “Molecular Photochemistry,” Benjamin, New
York, 1965.
[15] K. Biemann, “Tables of Spectral Data for Structure De-
termination of Organic Compounds,” Springer-Verlag,
Berlin Heidelberg, 1989.
[16] S. K. Kurtz and T. T. Perry, J. Appl. Phys., Vol. 39, 1968,
pp. 3798-3813. doi:10.1063/1.1656857
[17] H. -X. Cang, W. -D. Huang and Y. -H. Zhou, J. Cryst.
Growth, Vol. 192, 1998, pp. 236-242.
doi:10.1016/S0022-0248(98)00408-4