 American Journal of Plant Sciences, 2011, 2, 416-424 doi:10.4236/ajps.2011.23047 Published Online September 2011 (http://www.SciRP.org/journal/ajps) Copyright © 2011 SciRes. AJPS Analysis of Genetic Diversity in Poeciloneuron pauciflorum Bedd.―An Endemic Tree Species from the Western Ghats of India Padmesh Pandaram Pillai1*, Jayakumari Sanakan Sajan1, Kuttapetty Manikantan Menon1, Achuthan Sudarshanan Hemanthakumar1, Alagramam Govindasamy Pandurangan1, Peringatulli Narayanan Krishnan1, Soorimuthu Seeni2 1Tropical Botanic Garden and Research Institute, Thiruvananthapuram, India; 2Sathyabama University, Chennai, India. Email: *padmeshpad@rediffmail.com, padmeshpillai@gmail.com Received April 18th, 2011; revised May 6th, 2011; accepted May 26th, 2011. ABSTRACT Poeciloneuron pauciflorum is a narrow endemic having highly restricted distribution in the southern-western Ghats region of India. 18 accessions of P. pauciflorum collected from four different locations were analyzed for genetic varia- tion using 20 random primers. Out of 14 1 amplicons generated, 130 of them were polymorphic (92.20% polymorphism). Contrary to the general concept of low genetic variation associated with endemic plant species, P. pauciflorum exhibits high genetic diversity as the similarity index value based on Nei & Li’s similarity coefficient ranges from 0.36 to 0.95 with mean GS = 0.72 and Shannon’s information measure (0.43). Cluster analysis showed grouping of all accessions from the State of Tamil Nadu into two major clusters with few outliers while those from the State of Kerala also clus- tered with them. Accessions from Kalliankadu forest segment harbors maximum diversity as indicated by various ge- netic diversity indices like h, I, Ht, Hs, Gst, PL and hence this site is recommended for in situ conservation of this nar- row endemic. The main factors responsible for the high level of genetic diversity among accessions are probably re- lated to the reproductive isolation and ecological breadth. The strong genetic variability among accessions indicates that the management for the conservation of the genetic diversity in P. pauciflorum should aim to preserve every acces- sion. The present study assumes significance as it negotiates endemism and genetic variation in tree species, a global phenomenon having wide implications in species diversity and conservation. Keywords: RAPD, Neoendemism, Xanthones 1. Introduction Poeciloneuron pauciflorum Bedd.―(Clusiaceae) is a critically endangered tree species endemic to India hav- ing sparse distribution in the Southern Western Ghats of Kerala and Tamil Nadu States [1]. It is a medium sized tree growing up to 15 m tall and 2 m in girth, distributed in the evergreen forest on the hills, particularly along riverbanks or watercourse between 600 to 1500 MSL al- titude. The species is seen in KMTR (Kalakadu Mudan- thurai Tiger Reserve) forest segment of Tamil Nadu. Re- cently 12 new additional sites grouped under three major regions viz. Mahendragiri, Chambakuchi and Kallar comprising the Kanyakumari Wildlife Sanctuary of Ta- mil Nadu [2] and from Chemungi-Attayar forest region of Kerala [3] has been reported. The species yields economi- cally important timber with the wood reddish in colour, hard and heavy. The genus Poeciloneuron with the species P. indicum was initially considered as mono- typic by Beddome [4] under the family Tenstromeiaceae and later in 1871 added P. pauciflorum as the second species. However, the genus with just two species finds itself in taxonomic reassessments based on morphologi- cal, wood anatomical and palynological data [5] as the extent of variation at the interspecific level is estimated to be high. Like few other endemics of the Western Ghats, P. pauciflorum shows large amount of variation in plant morphology and is threatened by habitat loss. The family Clusiaceae is known for high amount of xanthones [6,7] and P. pauciflorum is no exception as it is a rich source of xanthones like (1,6-dihydroxy-7-methoxyxanthone and 1,6-dihydroxy-7-methoxyxanthone 6-O-β-d-glucoside) in addition to 12 others, such as 1,5-dihydroxy-, 1,5-dihy- 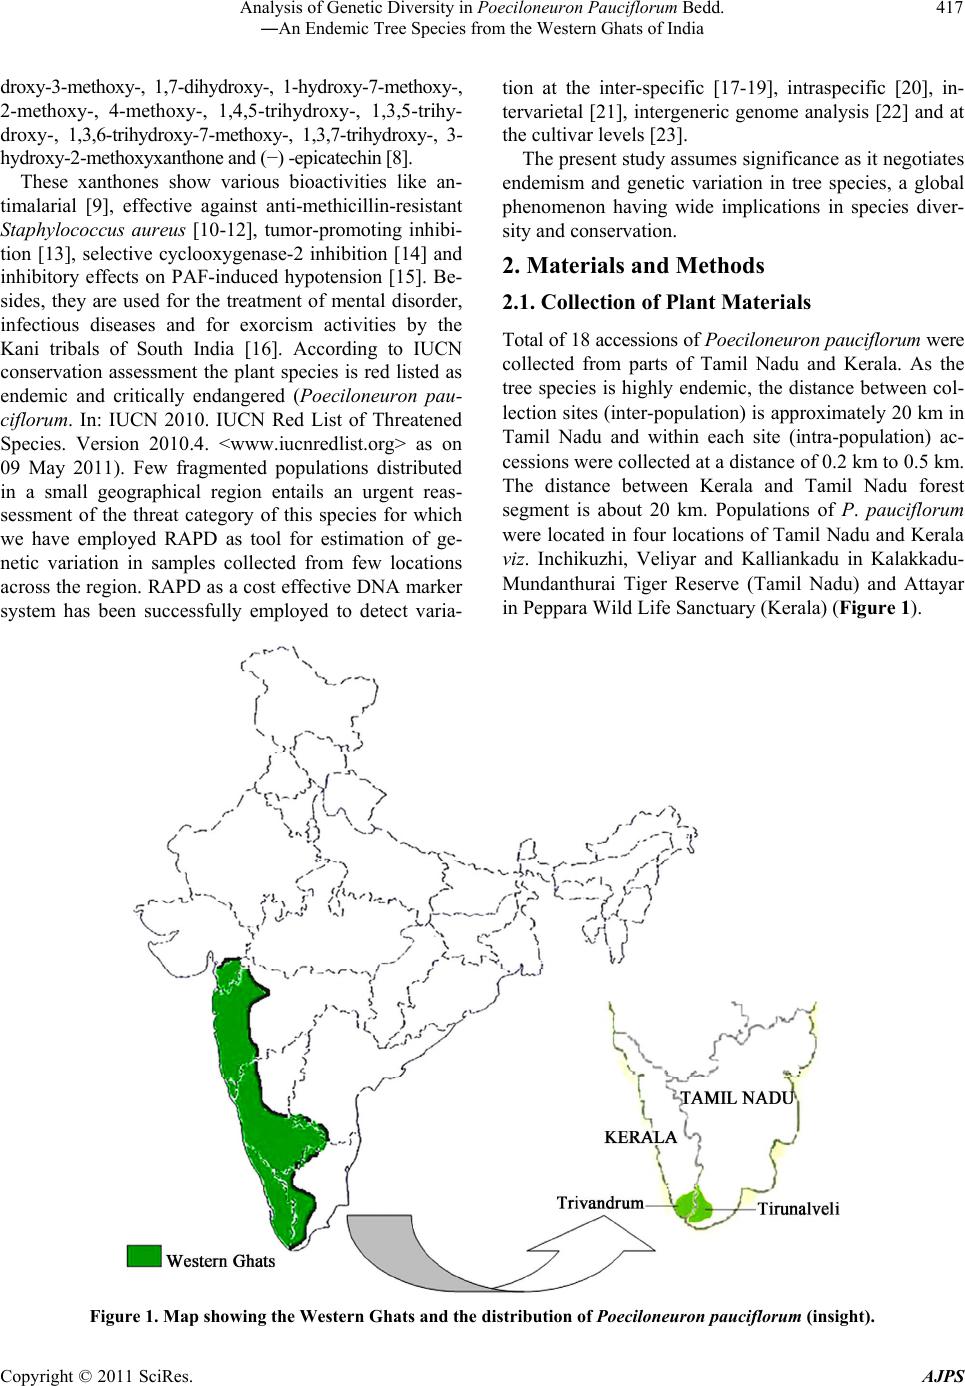 Analysis of Genetic Diversity in Poeciloneuron Pauciflorum Bedd. 417 ―An Endemic Tree Species from the Western Ghats of India droxy-3-methoxy-, 1,7-dihydroxy-, 1-hydroxy-7-methoxy-, 2-methoxy-, 4-methoxy-, 1,4,5-trihydroxy-, 1,3,5-trihy- droxy-, 1,3,6-trihydroxy-7-methoxy-, 1,3,7-trihydroxy-, 3- hydroxy-2-methoxyxanthone and (−) -epicatechin [8]. These xanthones show various bioactivities like an- timalarial [9], effective against anti-methicillin-resistant Staphylococcus aureus [10-12], tumor-promoting inhibi- tion [13], selective cyclooxygenase-2 inhibition [14] and inhibitory effects on PAF-induced hypotension [15]. Be- sides, they are used for the treatment of mental disorder, infectious diseases and for exorcism activities by the Kani tribals of South India [16]. According to IUCN conservation assessment the plant species is red listed as endemic and critically endangered (Poeciloneuron pau- ciflorum. In: IUCN 2010. IUCN Red List of Threatened Species. Version 2010.4. <www.iucnredlist.org> as on 09 May 2011). Few fragmented populations distributed in a small geographical region entails an urgent reas- sessment of the threat category of this species for which we have employed RAPD as tool for estimation of ge- netic variation in samples collected from few locations across the region. RAPD as a cost effective DNA marker system has been successfully employed to detect varia- tion at the inter-specific [17-19], intraspecific [20], in- tervarietal [21], intergeneric genome analysis [22] and at the cultivar levels [23]. The present study assumes significance as it negotiates endemism and genetic variation in tree species, a global phenomenon having wide implications in species diver- sity and conservation. 2. Materials and Methods 2.1. Collection of Plant Materials Total of 18 accessions of Poeciloneuron pauciflorum were collected from parts of Tamil Nadu and Kerala. As the tree species is highly endemic, the distance between col- lection sites (inter-population) is approximately 20 km in Tamil Nadu and within each site (intra-population) ac- cessions were collected at a distance of 0.2 km to 0.5 km. The distance between Kerala and Tamil Nadu forest segment is about 20 km. Populations of P. pauciflorum were located in four locations of Tamil Nadu and Kerala viz. Inchikuzhi, Veliyar and Kalliankadu in Kalakkadu- Mundanthurai Tiger Reserve (Tamil Nadu) and Attayar in Peppara Wild Life Sanctuary (Kerala) (Figure 1). Figure 1. Map showing the Western Ghats and the distribution of Poeciloneuron pauciflorum (insight). Copyright © 2011 SciRes. AJPS 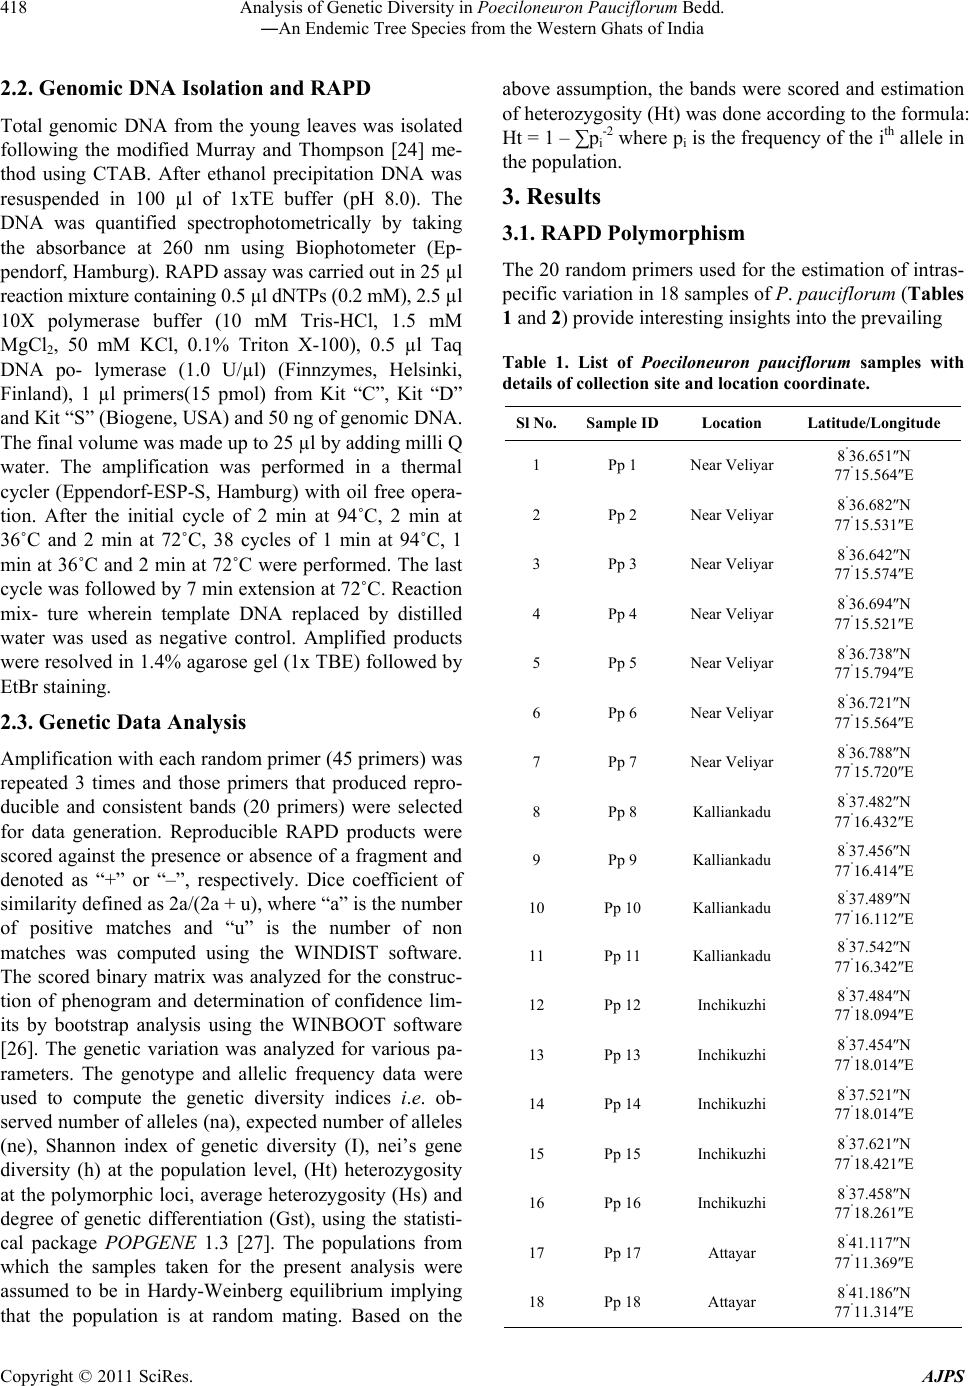 Analysis of Genetic Diversity in Poeciloneuron Pauciflorum Bedd. 418 ―An Endemic Tree Species from the Western Ghats of India 2.2. Genomic DNA Isolation and RAPD Total genomic DNA from the young leaves was isolated following the modified Murray and Thompson [24] me- thod using CTAB. After ethanol precipitation DNA was resuspended in 100 µl of 1xTE buffer (pH 8.0). The DNA was quantified spectrophotometrically by taking the absorbance at 260 nm using Biophotometer (Ep- pendorf, Hamburg). RAPD assay was carried out in 25 µl reaction mixture containing 0.5 µl dNTPs (0.2 mM), 2.5 µl 10X polymerase buffer (10 mM Tris-HCl, 1.5 mM MgCl2, 50 mM KCl, 0.1% Triton X-100), 0.5 µl Taq DNA po- lymerase (1.0 U/µl) (Finnzymes, Helsinki, Finland), 1 µl primers(15 pmol) from Kit “C”, Kit “D” and Kit “S” (Biogene, USA) and 50 ng of genomic DNA. The final volume was made up to 25 µl by adding milli Q water. The amplification was performed in a thermal cycler (Eppendorf-ESP-S, Hamburg) with oil free opera- tion. After the initial cycle of 2 min at 94˚C, 2 min at 36˚C and 2 min at 72˚C, 38 cycles of 1 min at 94˚C, 1 min at 36˚C and 2 min at 72˚C were performed. The last cycle was followed by 7 min extension at 72˚C. Reaction mix- ture wherein template DNA replaced by distilled water was used as negative control. Amplified products were resolved in 1.4% agarose gel (1x TBE) followed by EtBr staining. 2.3. Genetic Data Analysis Amplification with each random primer (45 primers) was repeated 3 times and those primers that produced repro- ducible and consistent bands (20 primers) were selected for data generation. Reproducible RAPD products were scored against the presence or absence of a fragment and denoted as “+” or “–”, respectively. Dice coefficient of similarity defined as 2a/(2a + u), where “a” is the number of positive matches and “u” is the number of non matches was computed using the WINDIST software. The scored binary matrix was analyzed for the construc- tion of phenogram and determination of confidence lim- its by bootstrap analysis using the WINBOOT software [26]. The genetic variation was analyzed for various pa- rameters. The genotype and allelic frequency data were used to compute the genetic diversity indices i.e. ob- served number of alleles (na), expected number of alleles (ne), Shannon index of genetic diversity (I), nei’s gene diversity (h) at the population level, (Ht) heterozygosity at the polymorphic loci, average heterozygosity (Hs) and degree of genetic differentiation (Gst), using the statisti- cal package POPGENE 1.3 [27]. The populations from which the samples taken for the present analysis were assumed to be in Hardy-Weinberg equilibrium implying that the population is at random mating. Based on the above assumption, the bands were scored and estimation of heterozygosity (Ht) was done according to the formula: Ht = 1 – ∑pi -2 where pi is the frequency of the ith allele in the population. 3. Results 3.1. RAPD Polymorphism The 20 random primers used for the estimation of intras- pecific variation in 18 samples of P. pauciflorum (Tables 1 and 2) provide interesting insights into the prevailing Table 1. List of Poeciloneuron pauciflorum samples with details of collection site and location coordinate. Sl No.Sample ID Location Latitude/Longitude 1 Pp 1 Near Veliyar 8˚36.651N 77˚15.564E 2 Pp 2 Near Veliyar 8˚36.682N 77˚15.531E 3 Pp 3 Near Veliyar 8˚36.642N 77˚15.574E 4 Pp 4 Near Veliyar 8˚36.694N 77˚15.521E 5 Pp 5 Near Veliyar 8˚36.738N 77˚15.794E 6 Pp 6 Near Veliyar 8˚36.721N 77˚15.564E 7 Pp 7 Near Veliyar 8˚36.788N 77˚15.720E 8 Pp 8 Kalliankadu 8˚37.482N 77˚16.432E 9 Pp 9 Kalliankadu 8˚37.456N 77˚16.414E 10 Pp 10 Kalliankadu 8˚37.489N 77˚16.112E 11 Pp 11 Kalliankadu 8˚37.542N 77˚16.342E 12 Pp 12 Inchikuzhi 8˚37.484N 77˚18.094E 13 Pp 13 Inchikuzhi 8˚37.454N 77˚18.014E 14 Pp 14 Inchikuzhi 8˚37.521N 77˚18.014E 15 Pp 15 Inchikuzhi 8˚37.621N 77˚18.421E 16 Pp 16 Inchikuzhi 8˚37.458N 77˚18.261E 17 Pp 17 Attayar 8˚41.117N 77˚11.369E 18 Pp 18 Attayar 8˚41.186N 77˚11.314E Copyright © 2011 SciRes. AJPS 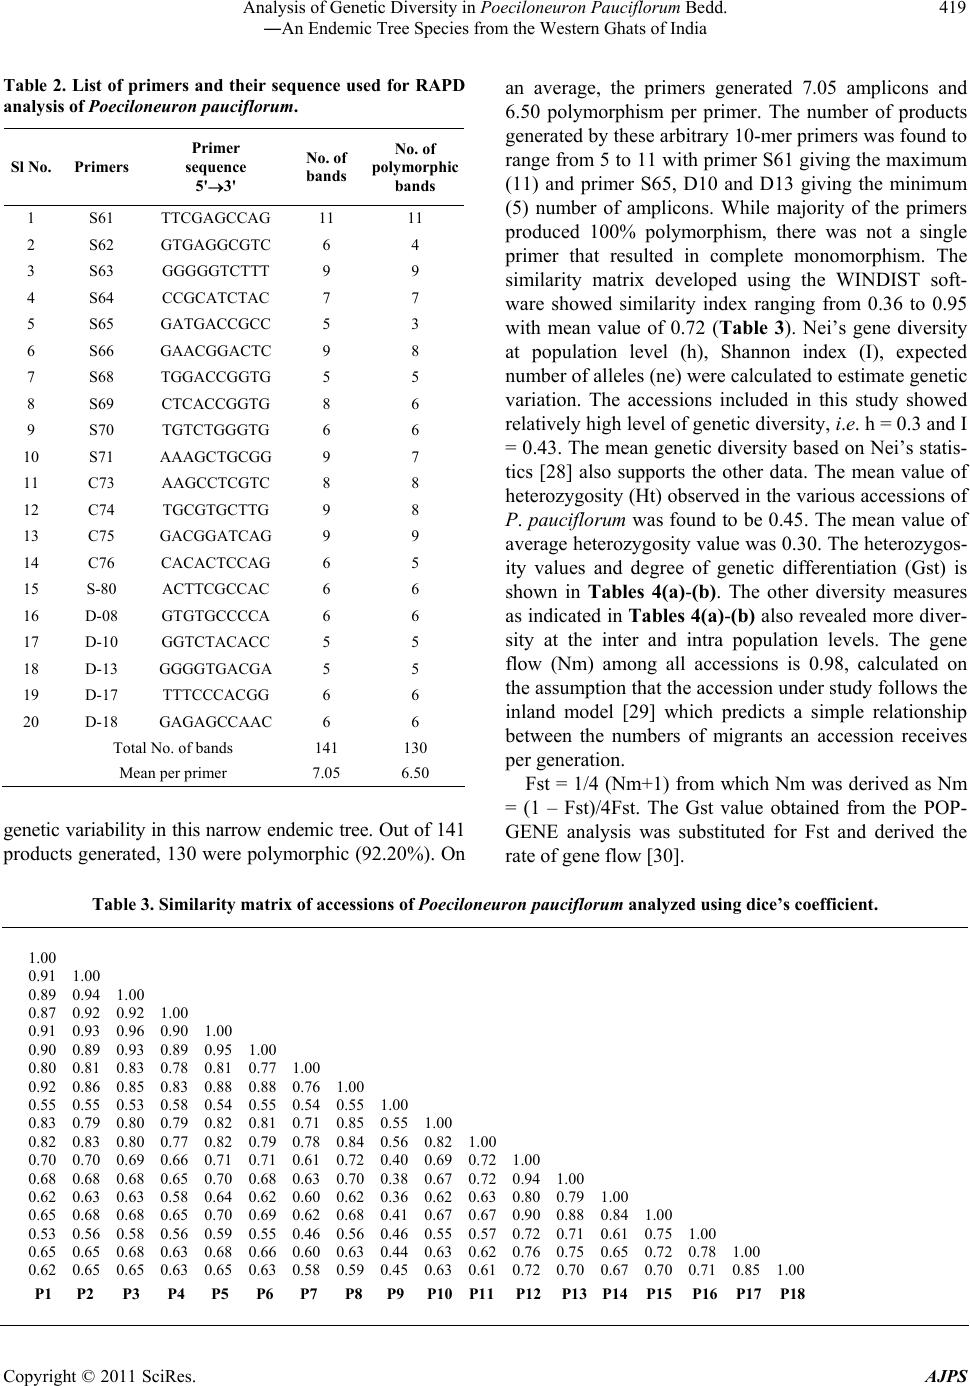 Analysis of Genetic Diversity in Poeciloneuron Pauciflorum Bedd. 419 ―An Endemic Tree Species from the Western Ghats of India Table 2. List of primers and their sequence used for RAPD analysis of Poeciloneuron pauciflorum. Sl No. Primers Primer sequence 5'3' No. of bands No. of polymorphic bands 1 S61 TTCGAGCCAG 11 11 2 S62 GTGAGGCGTC 6 4 3 S63 GGGGGTCTTT 9 9 4 S64 CCGCATCTAC 7 7 5 S65 GATGACCGCC 5 3 6 S66 GAACGGACTC 9 8 7 S68 TGGACCGGTG 5 5 8 S69 CTCACCGGTG 8 6 9 S70 TGTCTGGGTG 6 6 10 S71 AAAGCTGCGG 9 7 11 C73 AAGCCTCGTC 8 8 12 C74 TGCGTGCTTG 9 8 13 C75 GACGGATCAG 9 9 14 C76 CACACTCCAG 6 5 15 S-80 ACTTCGCCAC 6 6 16 D-08 GTGTGCCCCA 6 6 17 D-10 GGTCTACACC 5 5 18 D-13 GGGGTGACGA 5 5 19 D-17 TTTCCCACGG 6 6 20 D-18 GAGAGCCAAC 6 6 Total No. of bands 141 130 Mean per primer 7.05 6.50 genetic variability in this narrow endemic tree. Out of 141 products generated, 130 were polymorphic (92.20%). On an average, the primers generated 7.05 amplicons and 6.50 polymorphism per primer. The number of products generated by these arbitrary 10-mer primers was found to range from 5 to 11 with primer S61 giving the maximum (11) and primer S65, D10 and D13 giving the minimum (5) number of amplicons. While majority of the primers produced 100% polymorphism, there was not a single primer that resulted in complete monomorphism. The similarity matrix developed using the WINDIST soft- ware showed similarity index ranging from 0.36 to 0.95 with mean value of 0.72 (Table 3). Nei’s gene diversity at population level (h), Shannon index (I), expected number of alleles (ne) were calculated to estimate genetic variation. The accessions included in this study showed relatively high level of genetic diversity, i.e. h = 0.3 and I = 0.43. The mean genetic diversity based on Nei’s statis- tics [28] also supports the other data. The mean value of heterozygosity (Ht) observed in the various accessions of P. pauciflorum was found to be 0.45. The mean value of average heterozygosity value was 0.30. The heterozygos- ity values and degree of genetic differentiation (Gst) is shown in Tables 4(a)-(b). The other diversity measures as indicated in Tables 4(a)-(b) also revealed more diver- sity at the inter and intra population levels. The gene flow (Nm) among all accessions is 0.98, calculated on the assumption that the accession under study follows the inland model [29] which predicts a simple relationship between the numbers of migrants an accession receives per generation. Fst = 1/4 (Nm+1) from which Nm was derived as Nm = (1 – Fst)/4Fst. The Gst value obtained from the POP- GENE analysis was substituted for Fst and derived the rate of gene flow [30]. Table 3. Similarity matrix of accessions of Poeciloneuron pauciflorum analyzed using dice’s coefficient. 1.00 0.91 1.00 0.89 0.94 1.00 0.87 0.92 0.92 1.00 0.91 0.93 0.96 0.90 1.00 0.90 0.89 0.93 0.89 0.95 1.00 0.80 0.81 0.83 0.78 0.81 0.77 1.00 0.92 0.86 0.85 0.83 0.88 0.88 0.76 1.00 0.55 0.55 0.53 0.58 0.54 0.55 0.54 0.55 1.00 0.83 0.79 0.80 0.79 0.82 0.81 0.71 0.85 0.55 1.00 0.82 0.83 0.80 0.77 0.82 0.79 0.78 0.84 0.56 0.82 1.00 0.70 0.70 0.69 0.66 0.71 0.71 0.61 0.72 0.40 0.69 0.72 1.00 0.68 0.68 0.68 0.65 0.70 0.68 0.63 0.70 0.38 0.67 0.72 0.94 1.00 0.62 0.63 0.63 0.58 0.64 0.62 0.60 0.62 0.36 0.62 0.63 0.80 0.79 1.00 0.65 0.68 0.68 0.65 0.70 0.69 0.62 0.68 0.41 0.67 0.67 0.90 0.88 0.84 1.00 0.53 0.56 0.58 0.56 0.59 0.55 0.46 0.56 0.46 0.55 0.57 0.72 0.71 0.61 0.75 1.00 0.65 0.65 0.68 0.63 0.68 0.66 0.60 0.63 0.44 0.63 0.62 0.76 0.75 0.65 0.72 0.78 1.00 0.62 0.65 0.65 0.63 0.65 0.63 0.58 0.59 0.45 0.63 0.61 0.72 0.70 0.67 0.70 0.71 0.85 1.00 P1 P2 P3 P4 P5 P6 P7 P8 P9 P10 P11 P12 P13 P14 P15 P16 P17 P18 Copyright © 2011 SciRes. AJPS 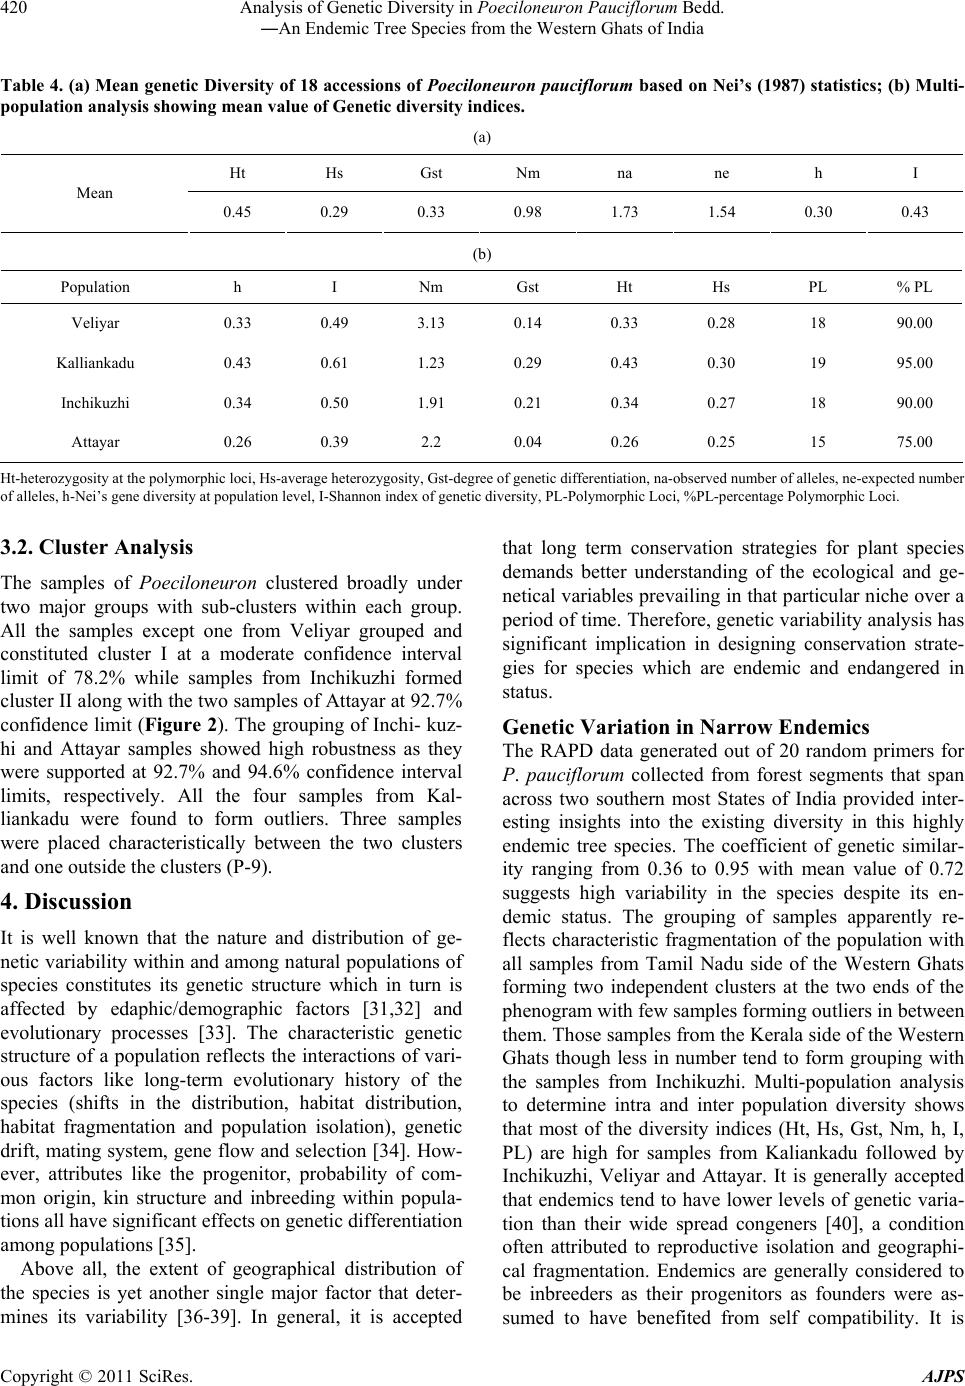 Analysis of Genetic Diversity in Poeciloneuron Pauciflorum Bedd. 420 ―An Endemic Tree Species from the Western Ghats of India Table 4. (a) Mean genetic Diversity of 18 accessions of Poeciloneuron pauciflorum based on Nei’s (1987) statistics; (b) Multi- population analysis showing mean value of Genetic diversity indices. (a) Ht Hs Gst Nm na ne h I Mean 0.45 0.29 0.33 0.98 1.73 1.54 0.30 0.43 (b) Population h I Nm Gst Ht Hs PL % PL Veliyar 0.33 0.49 3.13 0.14 0.33 0.28 18 90.00 Kalliankadu 0.43 0.61 1.23 0.29 0.43 0.30 19 95.00 Inchikuzhi 0.34 0.50 1.91 0.21 0.34 0.27 18 90.00 Attayar 0.26 0.39 2.2 0.04 0.26 0.25 15 75.00 Ht-heterozygosity at the polymorphic loci, Hs-average heterozygosity, Gst-degree of genetic differentiation, na-observed number of alleles, ne-expected number of alleles, h-Nei’s gene diversity at population level, I-Shannon index of genetic diversity, PL-Polymorphic Loci, %PL-percentage Polymorphic Loci. 3.2. Cluster Analysis The samples of Poeciloneuron clustered broadly under two major groups with sub-clusters within each group. All the samples except one from Veliyar grouped and constituted cluster I at a moderate confidence interval limit of 78.2% while samples from Inchikuzhi formed cluster II along with the two samples of Attayar at 92.7% confidence limit (Figure 2). The grouping of Inchi- kuz- hi and Attayar samples showed high robustness as they were supported at 92.7% and 94.6% confidence interval limits, respectively. All the four samples from Kal- liankadu were found to form outliers. Three samples were placed characteristically between the two clusters and one outside the clusters (P-9). 4. Discussion It is well known that the nature and distribution of ge- netic variability within and among natural populations of species constitutes its genetic structure which in turn is affected by edaphic/demographic factors [31,32] and evolutionary processes [33]. The characteristic genetic structure of a population reflects the interactions of vari- ous factors like long-term evolutionary history of the species (shifts in the distribution, habitat distribution, habitat fragmentation and population isolation), genetic drift, mating system, gene flow and selection [34]. How- ever, attributes like the progenitor, probability of com- mon origin, kin structure and inbreeding within popula- tions all have significant effects on genetic differentiation among populations [35]. Above all, the extent of geographical distribution of the species is yet another single major factor that deter- mines its variability [36-39]. In general, it is accepted that long term conservation strategies for plant species demands better understanding of the ecological and ge- netical variables prevailing in that particular niche over a period of time. Therefore, genetic variability analysis has significant implication in designing conservation strate- gies for species which are endemic and endangered in status. Genetic Variation in Narrow Endemics The RAPD data generated out of 20 random primers for P. pauc iflorum collected from forest segments that span across two southern most States of India provided inter- esting insights into the existing diversity in this highly endemic tree species. The coefficient of genetic similar- ity ranging from 0.36 to 0.95 with mean value of 0.72 suggests high variability in the species despite its en- demic status. The grouping of samples apparently re- flects characteristic fragmentation of the population with all samples from Tamil Nadu side of the Western Ghats forming two independent clusters at the two ends of the phenogram with few samples forming outliers in between them. Those samples from the Kerala side of the Western Ghats though less in number tend to form grouping with the samples from Inchikuzhi. Multi-population analysis to determine intra and inter population diversity shows that most of the diversity indices (Ht, Hs, Gst, Nm, h, I, PL) are high for samples from Kaliankadu followed by Inchikuzhi, Veliyar and Attayar. It is generally accepted that endemics tend to have lower levels of genetic varia- tion than their wide spread congeners [40], a condition often attributed to reproductive isolation and geographi- cal fragmentation. Endemics are generally considered to be inbreeders as their progenitors as founders were as- sumed to have benefited from self compatibility. It is Copyright © 2011 SciRes. AJPS 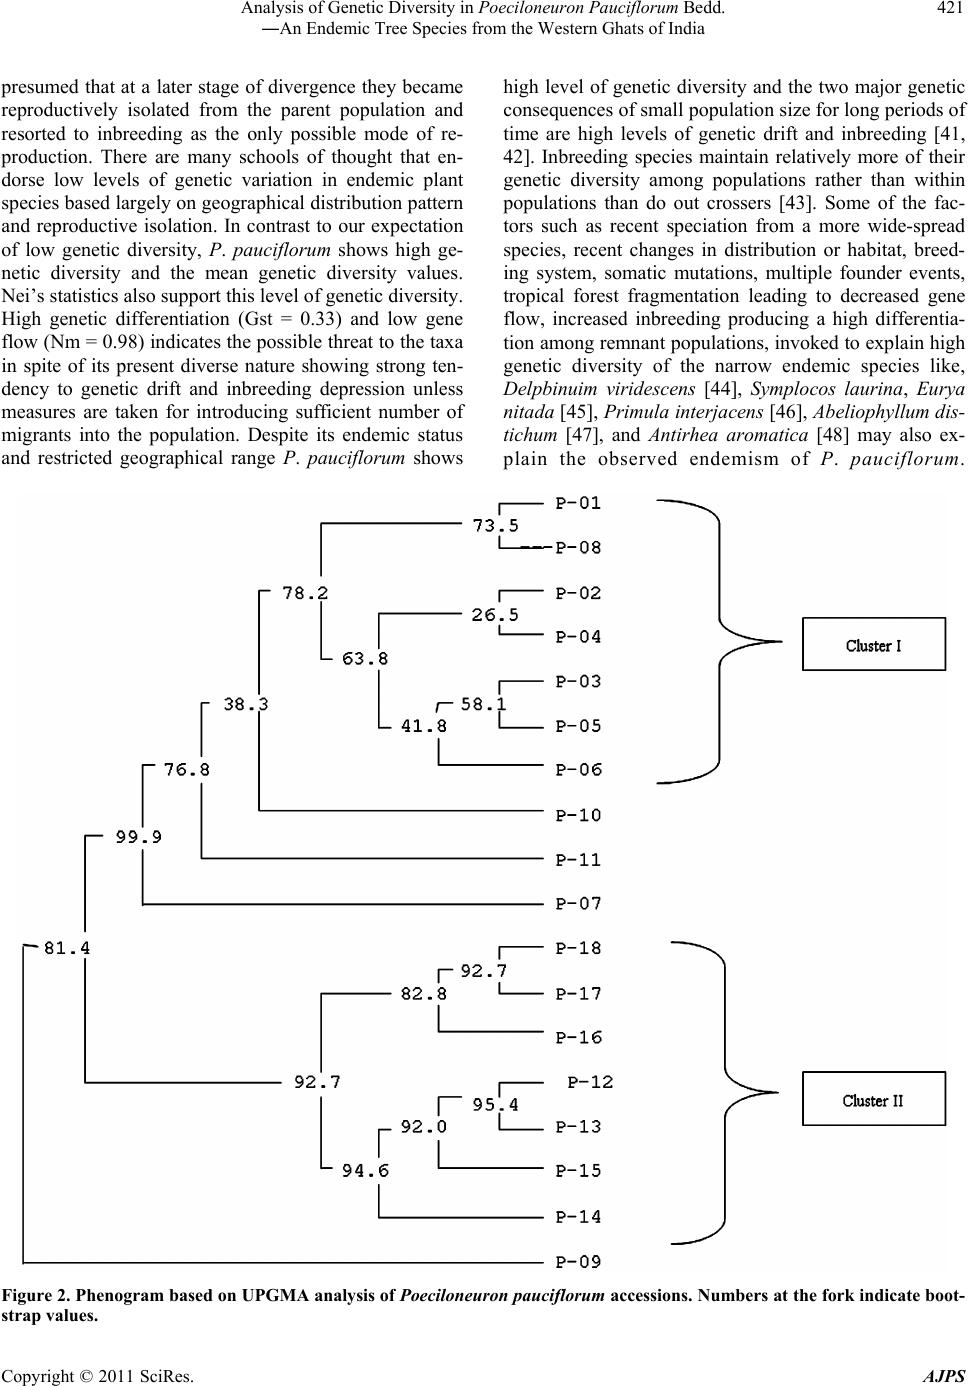 Analysis of Genetic Diversity in Poeciloneuron Pauciflorum Bedd. 421 ―An Endemic Tree Species from the Western Ghats of India presumed that at a later stage of divergence they became reproductively isolated from the parent population and resorted to inbreeding as the only possible mode of re- production. There are many schools of thought that en- dorse low levels of genetic variation in endemic plant species based largely on geographical distribution pattern and reproductive isolation. In contrast to our expectation of low genetic diversity, P. pauciflorum shows high ge- netic diversity and the mean genetic diversity values. Nei’s statistics also support this level of genetic diversity. High genetic differentiation (Gst = 0.33) and low gene flow (Nm = 0.98) indicates the possible threat to the taxa in spite of its present diverse nature showing strong ten- dency to genetic drift and inbreeding depression unless measures are taken for introducing sufficient number of migrants into the population. Despite its endemic status and restricted geographical range P. pauciflorum shows high level of genetic diversity and the two major genetic consequences of small population size for long periods of time are high levels of genetic drift and inbreeding [41, 42]. Inbreeding species maintain relatively more of their genetic diversity among populations rather than within populations than do out crossers [43]. Some of the fac- tors such as recent speciation from a more wide-spread species, recent changes in distribution or habitat, breed- ing system, somatic mutations, multiple founder events, tropical forest fragmentation leading to decreased gene flow, increased inbreeding producing a high differentia- tion among remnant populations, invoked to explain high genetic diversity of the narrow endemic species like, Delpbinuim viridescens [44], Symplocos laurina, Eurya nitada [45], Primula interjacens [46], Abeliophyllum dis- tichum [47], and Antirhea aromatica [48] may also ex- plain the observed endemism of P. pauciflorum. Figure 2. Phenogram based on UPGMA analysis of Poeciloneuron pauciflorum accessions. Numbers at the fork indicate boot- strap values. Copyright © 2011 SciRes. AJPS  Analysis of Genetic Diversity in Poeciloneuron Pauciflorum Bedd. 422 ―An Endemic Tree Species from the Western Ghats of India Accordingly, narrow endemics are mostly referred as products of speciation that differ in their origin and status of rarity only in certain aspects that in turn are controlled by such factors as geographic area, ecological breadth, reproductive isolation and most importantly the amount of genetic variation inherent in the taxa [49]. In fact, the first three factors defines the genetic structure of the taxa to a considerable extent that perpetuation and establish- ment relies mostly on the extent of genetic variation. The niche variation hypothesis which refers to species adaptation to narrow ecological conditions also explains the significant role of heterozygosity in genetic diversity and endemism and thereby the genesis of narrow endem- ics. Thereby other major factor besides selection pressure that determine heterozygosity is effective population size which in turn could be the product of (a) smaller total population size compared to those species having cos- mopolitan distribution (b) genetic bottle neck at the time of origin of the species which in due course with rapid speciation may produce a certain low level of genetic variation, a condition that could be transitory (c) in- breeding/selfing may reduce effective population size and hence heterozygosity and (d) population fragmenta- tion due to geographical or reproductive isolation. We assume that some or all of these factors must have con- tributed to the peculiar distribution and current status of endemism seen in P. pauciflorum. The populations from which the samples taken for the present analysis were assumed to be in Hardy-Weinberg equilibrium implying that the population is at random mating. Though direct measure of heterozygosity was not calculated in the pre- sent study the indirect measures reflected through various diversity indices clearly demonstrates high variability in the taxa that is not otherwise expected in this category of narrow endemics in general and in a taxon like P. pau- ciflorum in particular where the natural mode of repro- duction is through selfing as indicated by the floral structure (bi-sexual flowers, stigma acute wherein both stigma and anther are placed in the same level suggestive of inbreeding). Therefore the general concept of associ- ating low genetic variation in natural populations of plant species with endemism entails further extrapolation to negotiate the prevalence of unseemingly high diversity in this species. However such situations of associating en- demism with high genetic diversity has been earlier re- ported in vascular plants like rare ferns Adenophorus periens [50], endemic Agave victoriae-reginae [51], nar- row endemic tree species Antirhea aromatica, Antir- rhinum charidemi and A. valentinum [52], narrow en- demic conifer Cupressus macrocarpa, which has highly restricted distribution shows fairly good variability. All seven species of the Californian endemic grass genus Orcuttia that have as much genetic variability as any other widely distributed members of Graminae [53]. Among these, Antirhea aromatica has exceptionally high genetic diversity and variability, despite its low popula- tion density [48]. The phenomenon is likely to be associ- ated with the reproductive system as in certain members of the family Rubiaceae, there is pre-zygotic incompati- bility crossing system which reduces inbreeding and thereby loss of genetic diversity. We also propose similar or associated mechanism underlying the reproductive biology of P. pauciflorum that reduces the possibility of selfing and maintains the observed levels of genetic di- versity in this narrow endemic species. In conclusion our results show that this narrow en- demic tree species has generated a systematic process of genetic isolation yet capable of maintaining genetically viable populations in few patches of the Western Ghats region. Further the data is suggestive that in situ con- servation may be adopted for those populations in Kal- liankadu as they are shown to harbor maximum amount of variability possibly present in the species. We also re- commend an ex situ conservation strategy through con- ventional or non-conventional approach involving simple micropropagation to increase the number of plantlets and thereby delist the species from its current endemic status. 6. Acknowledgements The authors greatly acknowledge the Kerala and Tamil Nadu Forest Departments for granting permission to col- lect plant samples from the respective forest segments. Also, PP, AGP, PNK and SS thank the Department of Biotechnology, Government of India for the research grant (Grant No. BT/PR7058/BCE/08/440/2006). REFERENCES [1] R. Gopalan and A. N. Henry, “Endemic Plants of India- Endemics of Agasthiyamalai Hills,” Bishen Singh Ma- hendrapal Singh Publications, Dehradun, 2000. [2] D. Narasimhan and Sheeba J. Irwin, “Population Status of Poeciloneuron pauciflorum Bedd. (Clusiaceae): An En- demic and Critically Endangered Tree Species from Southern Western Ghats, India,” Indian Journal of For- estry, Vol. 33, No. 3, 2010, pp. 419-424. [3] N. Mohanan, T. Shaju, M. S. Raj Kiran and N. Ravi, “Rediscovery of Poeciloneuron pauciflorum Bedd. (Bonnetiaceae): An Endemic and Little Known Species of Western Ghats, Presumed to Be Extinct,” Annals of For- estry, Vol. 7, 1999, pp. 87-89. [4] R. H. Beddome, “On a New Genus of Ternstroemiaceae: Poeciloneuron from Nilgiris,” Journal of Linnean Society, Vol. 8, 1865, p. 267. [5] S. Rajkumar and M. K. Janarthanam, “Agasthiyamalaia (Clusiaceae): A New Genus for Poeciloneuron pauciflo- Copyright © 2011 SciRes. AJPS  Analysis of Genetic Diversity in Poeciloneuron Pauciflorum Bedd. 423 ―An Endemic Tree Species from the Western Ghats of India rum, an Endemic and Endangered Tree of Western Ghats, India,” Journal of the Botanical Research Institute of Texas, Vol. 1, No. 1, 2007, pp. 129-133. [6] M. U. S. Sultanbawa, “Xanthonoids of Tropical Plants,” Tetrahedron, Vol. 36, 1980, pp. 1465-1506. [7] G. J. Bennett and H. K. Lee, “Xanthones from Guttif- erae,” Phytochemistry, Vol. 28, 1989, pp. 967-998. [8] T. Hideki, I. Munekazu, I. M. Koh, I. Tetsuro, T. Toshi- yuki, C. Veliah and R. Soedarsono, “Three Xanthones from Poeciloneruon pauciflorum and Mammea acumi- nate,” Phytochemistry , Vol. 45, No. 1, 1997, pp. 133-136. [9] M. V. Ignatushchenko, R. W. Winter and M. Riscoe, “Xanthones as Antimalarial Agents, Stage Specificity,” American Journal of Tropical Medicine and Hygiene, Vol. 62, 2000, pp. 77-81. [10] V. Rukachaisirikul, M. Kamkaew, D. Sukavisit, S. Phon- gpaichit, P. Sawangchote and W. Taylor, “Antibacterial Xanthones from the Leaves of Garcinia nigrolineata,” Journal of Natural Products, Vol. 66, No. 12, 2003, pp. 1531-1535. doi:10.1021/np0303254 [11] V. Rukachaisirikul, K. Tadpetch, A. Watthanaphanit, N. Saengsanae and S. Phongpaichit, “Benzopyran, Biphenyl, and Tetraoxygenated Xanthone Derivatives from the Twigs of Garcinia nigrolineata,” Journal of Natural Products, Vol. 68, No. 8, 2005, pp. 1218-1221. doi:10.1021/np058050a [12] Y. Sukpondma, V. Rukachaisirikul and S. Phongpaichit, “Xanthone and Sesquiterpene Derivatives from the Fruits of Garcinia scortechinii,” Journal of Natural Products, Vol. 68, No. 7, 2005, pp. 1010-1017. doi:10.1021/np058050a [13] C. Ito, M. Itoigawa, T. Takakura, N. Ruangrungsi, F. Enjo, H. Tokuda, H. Nishino and H. Furukawa, “Chemi- cal Constituents of Garcinia fusca: Structure Elucidation of Eight New Xanthone and Their Cancer Chemopreven- tive Activity,” Journal of Natural Products, Vol. 66, No. 2, 2003, pp. 200-205. doi:10.1021/np020290s [14] J. Zou, D. Jin, W. Chen, J. Wang, Q. Liu, X. Zhu and W. Zhao, “Selective Cyclooxygenase-2 Inhibitors from Ca- lophyllum membranaceum,” Journal of Natural Products, Vol. 68, No. 10, 2005, pp. 1514-1518. doi:10.1021/np0502342 [15] H. Oku, Y. Ueda, M. Iinuma and K. Ishiguro, “Inhibitory Effects of Xanthones from Guttiferae Plants on PAF-Induced Hypotension in Mice,” Planta Medica, Vol. 71, No. 1, 2005, pp. 90-92. doi:10.1055/s-2005-837760 [16] K. S. Ghanthi and V. S. Manickam, “Ethnobotanical Uti- lization of Poeciloneuron pauciflorum Bedd. by the Kani Tribes of Agasthiamalai, Western Ghats, Tamil Nadu, In- dia,” Ethnobotanical Leaflets, Vol. 12, 2008, pp. 719-722. [17] S. Nayak, G. R. Rout and P. Das, “Evaluation of the Ge- netic Variability in Bamboo Using RAPD Markers,” Plant, Soil and Environment, Vol. 49, No. 1, 2003, pp. 24-28. [18] M. Das, S. Bhattacharya, J. Basak and A. Pal, “Phyloge- netic Relationships among the Bamboo Species as Re- vealed by Morphological Characters and Polymorphism Analysis,” Biologica Plantarum, Vol. 51, No. 4, 2007, pp. 667-672. doi:10.1007/s10535-007-0140-7 [19] S. M. S. D. Ramanayake, V. N. Meemaduma and T. E. Weerawardene, “Genetic Diversity and Relationships between Nine Species of Bamboo in Sri Lanka, Using Random Amplified Polymorphic DNA,” Plant Systemat- ics and Evolution, Vol. 269, No. 1-2, 2007, pp. 55-61. doi:10.1007/s00606-007-0587-1 [20] S. Narasimhan, P. Padmesh and G. M. Nair, “Assessment of Genetic Diversity in Coscinium fenestratum,” Biologia Plantarum, Vol. 50, No. 1, 2006, pp. 111-113. doi:10.1007/s10535-005-0082-x [21] P. Padmesh, J. V. Reji, D. M. Jinish and S. Seeni, “Esti- mation of Genetic Diversity in Varities of Mucuna pru- riens Using RAPD,” Biologica Plantarum, Vol. 50, No. 3, 2006, pp. 367-372. doi:10.1007/s10535-006-0051-z [22] H. Q. Zhang and Y. H. Zhou, “Genetic Relationships among Hystrix patula, H. duthiei and H. longearistata According to Meiotic Studies and Genome-Specific RAPD Assay,” Biologica Plantarum, Vol. 53, No. 1, 2009, pp. 45-52. doi:10.1007/s10535-009-0007-1 [23] P. Padmesh, J. V. Reji, P. C. Benadict, S. Mukunthaku- mar, G. Praveen and S. Seeni, “Analysis of Genetic Va- riability in Two Diploid Musa Cultivars Using RAPD,” Biologica Plantarum, Vol. 53, No. 4, 2009, pp. 711-714. doi:10.1007/s10535-009-0128-6 [24] M. G. Murray and W. F. Thompson, “Rapid Isolation of High-Molecular Weight Plant DNA,” Nucleic Acids Re- search, Vol. 8, No. 19, 1980, pp. 4321-4325. doi:10.1093/nar/8.19.4321 [25] E. V. Wulff, “An Introduction to Historical Plant Geog- raphy,” Chronica Botanica, Waltham, 1943. [26] I. V. Yap and R. J. Nelson, “In WinBoot: A programme for Performing Bootstrap Analysis for Binary Data to Determine the Confidence Limits of UPGMA Based Dendrograms,” International Rice Research Institute, Manila, 1996. [27] F. C. Yeh, T. B. J. Boyle, Z. H. Ye and J. X. Mao, “PO- PGENE: The User-Friendly Software for Population Ge- netic Analysis,” University of Alberta, Edmonton, 1999. [28] M. Nei, “Molecular Evolution Genetics,” Columbia Uni- versity Press, New York, 1987. [29] S. Wright, “The Genetic Structure of Populations,” An- nals of Eugenetics, Vol. 16, 1931, pp. 97-159. [30] C. W. Michael and E. M. David, “Indirect Measures of Gene Flow and Migration: FST≠1/(4Nm+1),” Heredity, Vol. 82, 1999, pp. 117-125. [31] J. Antonovics and S. Via, “Genetic Influences on the Distribution and Abundance of Plants,” In: A. J. Devy, M. J. Hutchings and A. R. Watkinson, eds., Perspectives on Plant Population Biology, Sinauer Associates, Sunder- land, 1987, pp. 185-203. [32] M. D. Loveless and J. L. Hamrick, “Ecological Determi- Copyright © 2011 SciRes. AJPS  Analysis of Genetic Diversity in Poeciloneuron Pauciflorum Bedd. 424 ―An Endemic Tree Species from the Western Ghats of India nants of Genetic Structure in Plant Populations,” Annual Review of Ecology and Evolutions, Vol. 15, 1984, pp. 65-95. [33] S. Wright, “The Genetic Structure of Populations,” An- nals of Eugenetics, Vol. 16, 1931, pp. 97-159. [34] B. A. Schaal, D. A. Hayworth, K. M. Olsen, J. T. Rausher and W. A. Smith, “Phylogeographical Studies in Plant: Problems and Prospects,” Molecular Ecology, Vol. 7, No. 4, 1998, pp. 465-474. doi:10.1046/j.1365-294x.1998.00318.x [35] M. C. Whitlock and D. E. McCauley, “Some Population Genetic Consequences of Colony Formation and Extinc- tion: Genetic Correlations within Founding Groups,” Evolution, Vol. 44, 1990, pp. 1717-1724. [36] J. L. Hamrick and M. J. W. Godt, “Conservation Genetics of Endemic Plant Species,” In: J. C. Avise and J. L. Ha- mrick, eds., Conservation Genetics, Case Histories from Nature, Chapman & Hall, New York, 1996a, pp. 281-304. [37] J. L. Hamrick and M. J. W. Godt, “Effects of the History Traits on Genetic Diversity in Plants,” Philosophical Transactions of the Royal Society of London Biological Sciences, Vol. 351, 1996b, pp. 129-129. [38] Savolainen and H. Kuittien, “Small Populations Proc- esses,” In: A. Young, D. Boshier and T. Boyle, eds., For- est Conservation Genetics, CABI Publishing, Colling- wood, 2000, pp. 91-100. [39] G. L. Stebbins, “Rarity of Plant Species―A Synthetic View Point,” Rhodora, Vol. 82, No. 829, 1980, pp. 77-86. [40] M. A. Gitzendanner and P. A. Solitis, “Patterns of Ge- netic Variation in Rare and Widespread Plant Conge- ners,” American Journal of Botany, Vol. 87, No. 6, 2000, pp. 783-792. doi:10.2307/2656886 [41] S. C. H. Barrett and J. K. Kohn, “Genetic and Evolution- ary Consequences of Small Population Size Inplants: Im- plications for Conservation,” In: D. A. Falk and K. E. Holsinger, eds., Genetics and Conservation of Rare Plants, Oxford University Press, Oxford, 1991, pp. 3-30. [42] N. C. Ellstrand and D. R. Elam, “Population Genetic Consequences of Small Population Size: Implications for Plant Conservation,” Annual Review of Ecology and Sys- tematics, Vol. 24, 1993, pp. 217-242. doi:10.1146/annurev.es.24.110193.001245 [43] A. H. D. Brown, “Enzyme Polymorphism in Plant Popu- lations,” Theoretical Population Biology, Vol. 15, No. 1, 1979, pp. 1-42. doi:10.1016/0040-5809(79)90025-X [44] T. S. Richter, P. S. Soltis and D. E. Soltis, “Genetic Variation within and among Populations of the Narrow Endemic, Delpbinuim viridescens (Ranunculaceae),” American Journal of Botany, Vol. 81, No. 8, 1994, pp. 1070-1076. doi:10.2307/2445302 [45] A. U. Deshpande, G. S. Apte, et al., “Genetic Diversity across Natural Populations of Three Montane Plant Spe- cies from the Western Ghats, India Revealed by Intersim- ple Sequence Repeats,” Molecular Ecology, Vol. 10, No. 10, 2001, pp. 2361-2367. doi:10.1046/j.0962-1083.2001.01379.x [46] Da-Wei Xue, Xue-Jun Ge, Gang Hao and Chang-Qin Zhang, “High Genetic Diversity in a Rare, Narrowly En- demic Primrose Species: Primula interjacens by ISSR Analysis,” Acta Botanica Sinica, Vol. 46, No. 10, 2004, pp. 1163-1169. [47] U. Kang, C. S. Chang and Y. S. Kim, “Genetic Structure and Conservation Considerations of Rare Endemic Abe- liophyllum Distichum Nakai (Oleaceae) in Korea,” Jour- nal of Plant Resources,Vol. 113, 2000, pp. 127-138. [48] J. Gonzalez-Astorga and G. Castillo-Campos, “Genetic Variability of the Narrow Endemic Tree Antirhea aro- matica Castillo-Campos and Lorence (Rubiaceae, Guet- tardeae) in a Tropical Forest of Mexico,” Annals of Bot- any, Vol. 93, No. 5, 2004, pp. 521-528. doi:10.1093/aob/mch070 [49] R. K. Arthur and R. Deborah, “Biological Aspects of Endemism in Higher Plants,” Annual Review of Ecology and Systematics, Vol. 16, 1985, pp. 447-479. doi:10.1146/annurev.es.16.110185.002311 [50] T. A. Ranker, “Evolution of High Genetic Variability in the Rare Hawaiian Fern Adenophorus periens and Impli- cations for Conservation Management,” Biological Con- servation, Vol. 70, No. 1, 1994, pp. 19-24. doi:10.1016/0006-3207(94)90294-1 [51] P. A. Martinez, L. E. Eguiarte and G. R. Furnier, “Genetic Diversity of the Endangered Endemic Agave victoriae- reginae (Agavaceae) in the Chihuahuan Desert,” Ameri- can Journal of Botany, Vol. 86, No. 8, 1999, pp. 1093-1098. doi:10.2307/2656971 [52] A. I. Mateu and M. G. Segura, “Population Subdivision and Genetic Diversity in Two Narrow Endemics of An- tirrhinum L,” Molecular Ecology, Vol. 9, No. 12, 2000, pp. 2081-2087. doi:10.1046/j.1365-294X.2000.01119.x [53] A. Young, T. Boyle and T. Brown, “The Population Ge- netic Consequences of Habitat Fragmentation for Plants,” Trends in Ecology and Evolution, Vol. 11, No. 10, 1996, pp. 413-418. doi:10.1016/0169-5347(96)10045-8 Abbreviations: RAPD: Random Amplified Polymorphic DNA; GS: Genetic Similarity Coefficient. Copyright © 2011 SciRes. AJPS
|