 American Journal of Plant Sciences, 2011, 2, 396-407 doi:10.4236/ajps.2011.23045 Published Online September 2011 (http://www.SciRP.org/journal/ajps) Copyright © 2011 SciRes. AJPS A Survey of Genetic Diversity of the Weedy Species Ipomoea lacunosa L. in the USA Mid-South Nilda R. Burgos1*, Daniel O. Stephenson2, Hesham A. Agrama3, Lawrence R. Oliver1, Jason A. Bond4 1Department of Crop, Soil and Environmental Sciences, University of Arkansas, Fayetteville, USA; 2Dean Lee Research Station, Louisiana State University Agricultural Center, Alexandria, USA; 3Rice Research & Extension Center, University of Arkansas and Dale Bumpers National Rice Research Center, Stuttgart, USA; 4Mississippi State University, Delta Research and Extension Center, Stoneville, USA. Email:*nburgos@uark.edu Received April 17th, 2011; revised May 14th, 2011; accepted June 1st, 2011. ABSTRACT Morningglories (Ipomoea spp.) are among the most troublesome weedy species in agroecological environments. Ipo- moea lacunosa is one of the most prevalent of these species. Localized adaptations resulted in the evolution of several I. lacunosa ecotypes in North America, which could potentially impact its response to crop management practices. To evaluate the genetic diversity and population structure of I. lacunosa populations, we amplified inter-simple sequence repeats loci by polymerase chain reaction (ISSR-PCR) of 64 accessions using 14 ISSR primers for Ipomoea. Of these, 64 polymorphic fragments were scored. Analysis of Nei’s genetic distance (GD) values placed the accessions into four genotypic clusters, two of which were composed primarily of accessions from Arkansas and Mississippi with GD be- tween clusters of 0.318. The overall GD was 0.238, indicating a narrow genetic base. Population structure analysis determined three ancestral subgroups, with the majority of Arkansas and Mississippi accessions separated into two subgroups. The existence of various genotypes and ecotypes of I. lacunosa demonstrates the evolutionary diversification of this weedy species as it adapts to new colonized environments and agricultural activities. Keywords: DNA Fingerprinting, Genetic Diversity, Ipomoea, ISSR, Morningglory Species, Morningglory Genotypes, Population Structure 1. Introduction Plant communities in agroecosystems undergo rapid changes in composition, phenology, or genetic makeup because of exposure to strong selection factors as crop growers implement measures to favor crop growth. Ex- amples of such activities include tillage, irrigation, fertil- izer application, and use of herbicides to remove or minimize competition from weedy species. Thus, plant population composition quickly shifts to species that can thrive in these altered environments. The morningglory (Convolvulaceae) plant family is among such plant fami- lies that are well adapted to agroecosystems and are se- rious weeds in many crops. This family is composed of Ipomoea and Jacquemontia species, which are generally viney annuals or perennials [1]. There are more than 500 Ipomoea species worldwide [2], 342 of which exist in the Americas [3]. Annual morningglories of the genus Ipomoea are among the most troublesome weeds in numerous crops throughout the USA. Full-season interference of annual morningglories with soybean [Glycine max (L.) Merr.] causes crop lodging, reduces harvest efficiency, and re- duces yield up to 75% [4]. Ipomoea lacunosa L. (pitted morningglory) is one of the more prevalent annual morningglories [5]. Its indigenous range encompasses the southern Midwest to the southeastern regions of the USA [6,7]. It is among the top 10 most troublesome weeds in southern USA row crops [8] as well as in fruit trees, nuts, and vegetable crops [9]. Full-season interference of I. lacunosa with soybean could cause up to 50% economic loss [10]. Morningglories have generally large seeds with hard seed coat, which contributes to its seed dormancy and persistence in the soil seed bank [1]. Being large- seeded enables it to emerge from greater depths and tol- erate more stress factors around germination time than many other annual weedy species and crops; therefore, morningglories can easily become a dominant species in disturbed environments such as crop production areas. The reliance on chemical weed control in large crop 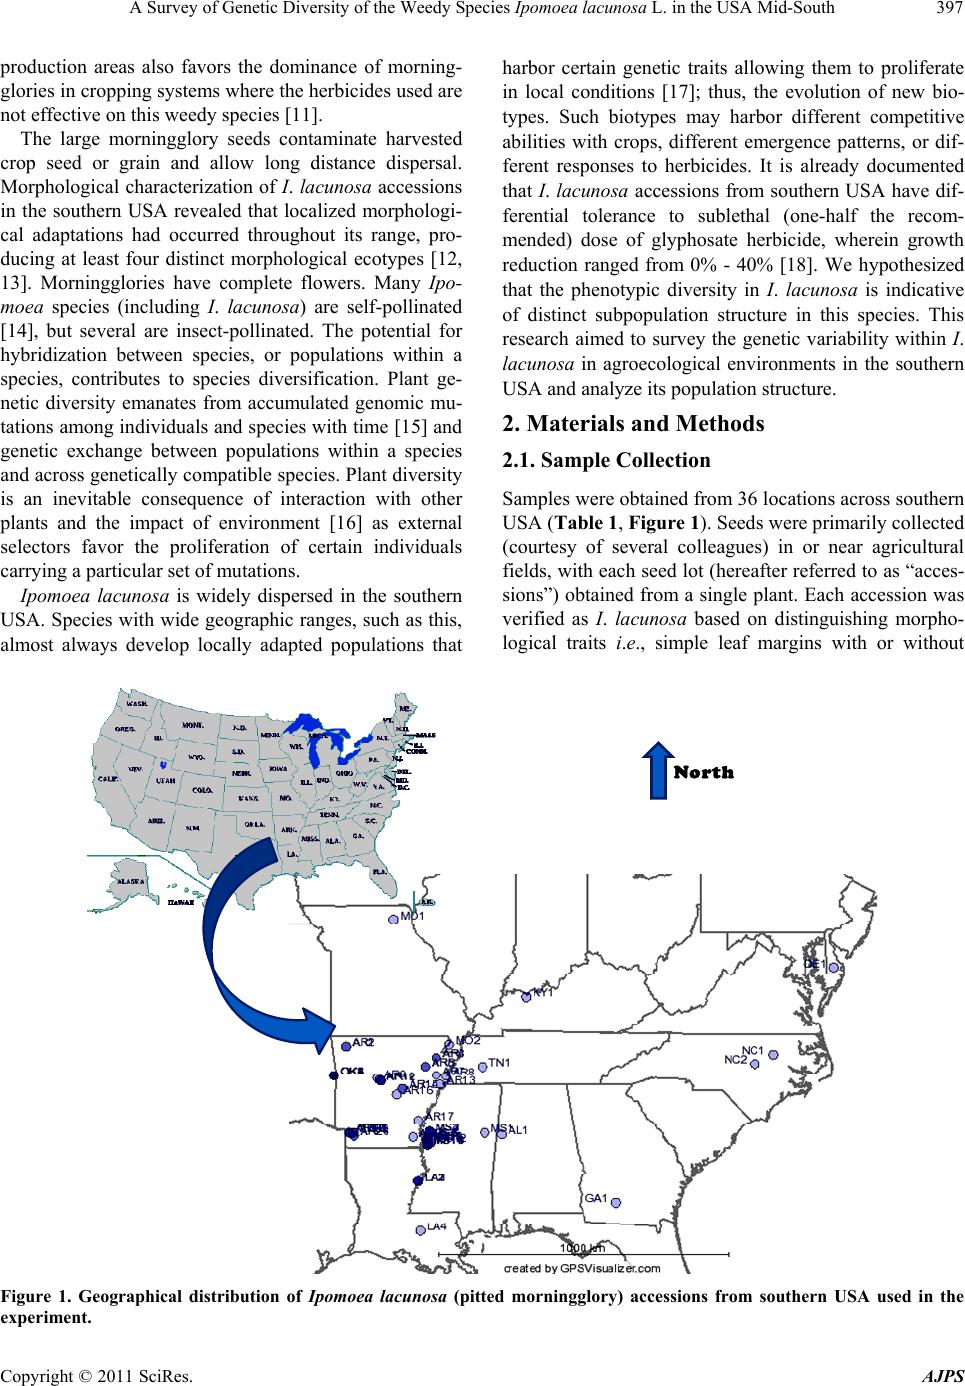 A Survey of Genetic Diversity of the Weedy Species Ipomoea lacunosa L. in the USA Mid-South397 production areas also favors the dominance of morning- glories in cropping systems where the herbicides used are not effective on this weedy species [11]. The large morningglory seeds contaminate harvested crop seed or grain and allow long distance dispersal. Morphological characterization of I. lacunosa accessions in the southern USA revealed that localized morphologi- cal adaptations had occurred throughout its range, pro- ducing at least four distinct morphological ecotypes [12, 13]. Morningglories have complete flowers. Many Ipo- moea species (including I. lacunosa) are self-pollinated [14], but several are insect-pollinated. The potential for hybridization between species, or populations within a species, contributes to species diversification. Plant ge- netic diversity emanates from accumulated genomic mu- tations among individuals and species with time [15] and genetic exchange between populations within a species and across genetically compatible species. Plant diversity is an inevitable consequence of interaction with other plants and the impact of environment [16] as external selectors favor the proliferation of certain individuals carrying a particular set of mutations. Ipomoea lacunosa is widely dispersed in the southern USA. Species with wide geographic ranges, such as this, almost always develop locally adapted populations that harbor certain genetic traits allowing them to proliferate in local conditions [17]; thus, the evolution of new bio- types. Such biotypes may harbor different competitive abilities with crops, different emergence patterns, or dif- ferent responses to herbicides. It is already documented that I. lacunosa accessions from southern USA have dif- ferential tolerance to sublethal (one-half the recom- mended) dose of glyphosate herbicide, wherein growth reduction ranged from 0% - 40% [18]. We hypothesized that the phenotypic diversity in I. lacunosa is indicative of distinct subpopulation structure in this species. This research aimed to survey the genetic variability within I. lacunosa in agroecological environments in the southern USA and analyze its population structure. 2. Materials and Methods 2.1. Sample Collection Samples were obtained from 36 locations across southern USA (Table 1, Figure 1). Seeds were primarily collected (courtesy of several colleagues) in or near agricultural fields, with each seed lot (hereafter referred to as “acces- sions”) obtained from a single plant. Each accession was verified as I. lacunosa based on distinguishing morpho- logical traits i.e., simple leaf margins with or without No r th Figure 1. Geographical distribution of Ipomoea lacunosa (pitted morningglory) accessions from southern USA used in the experiment. Copyright © 2011 SciRes. AJPS 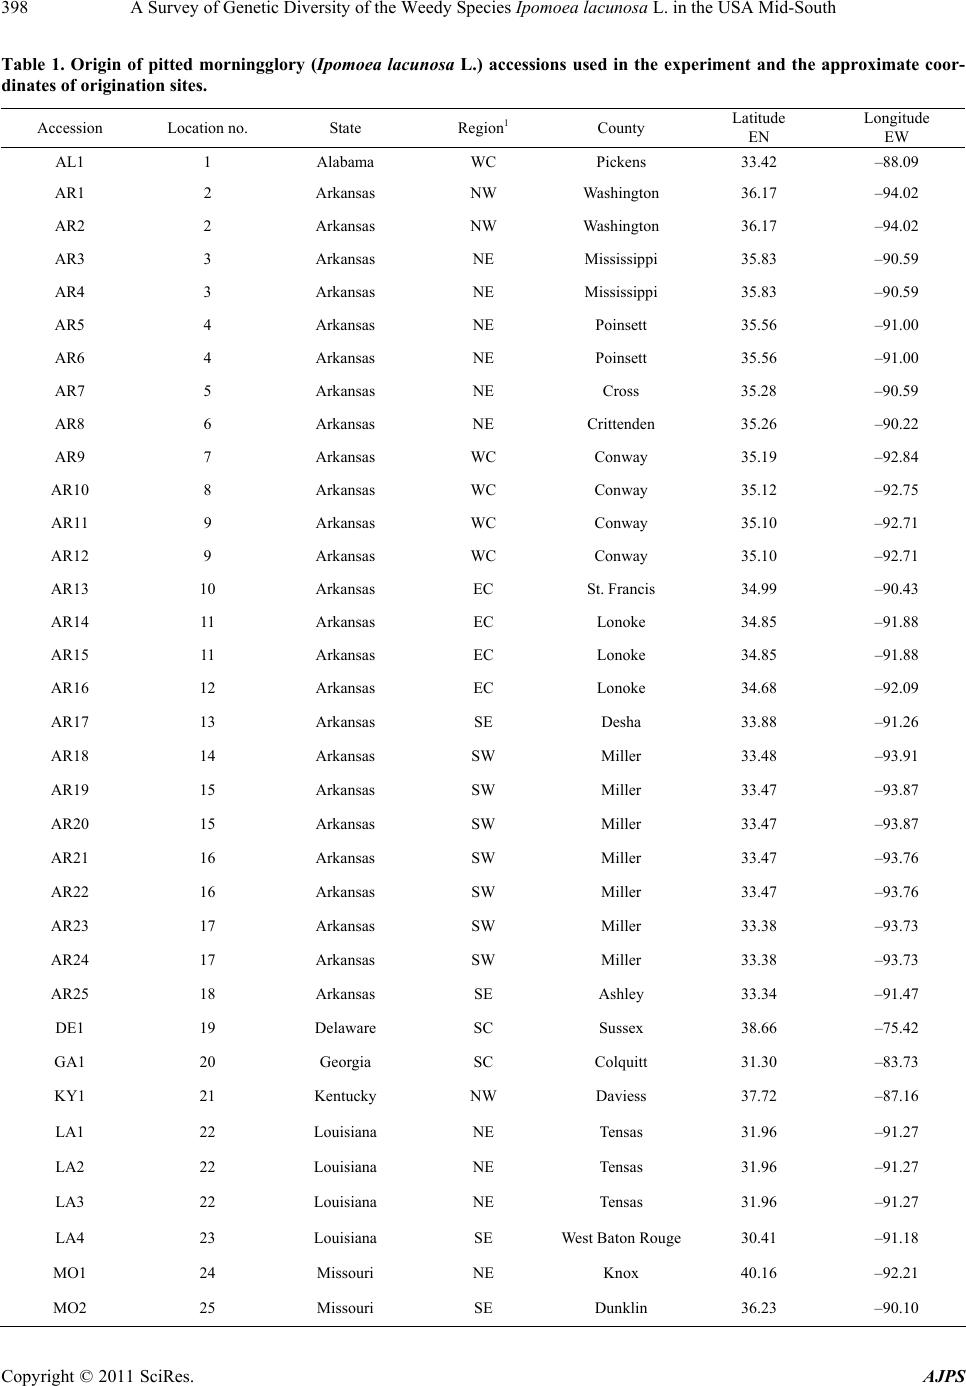 A Survey of Genetic Diversity of the Weedy Species Ipomoea lacunosa L. in the USA Mid-South 398 Table 1. Origin of pitted morningglory (Ipomoea lacunosa L.) accessions used in the experiment and the approximate coor- dinates of origination sites. Accession Location no. State Region1 County Latitude N Longitude W AL1 1 Alabama WC Pickens 33.42 –88.09 AR1 2 Arkansas NW Washington 36.17 –94.02 AR2 2 Arkansas NW Washington 36.17 –94.02 AR3 3 Arkansas NE Mississippi 35.83 –90.59 AR4 3 Arkansas NE Mississippi 35.83 –90.59 AR5 4 Arkansas NE Poinsett 35.56 –91.00 AR6 4 Arkansas NE Poinsett 35.56 –91.00 AR7 5 Arkansas NE Cross 35.28 –90.59 AR8 6 Arkansas NE Crittenden 35.26 –90.22 AR9 7 Arkansas WC Conway 35.19 –92.84 AR10 8 Arkansas WC Conway 35.12 –92.75 AR11 9 Arkansas WC Conway 35.10 –92.71 AR12 9 Arkansas WC Conway 35.10 –92.71 AR13 10 Arkansas EC St. Francis 34.99 –90.43 AR14 11 Arkansas EC Lonoke 34.85 –91.88 AR15 11 Arkansas EC Lonoke 34.85 –91.88 AR16 12 Arkansas EC Lonoke 34.68 –92.09 AR17 13 Arkansas SE Desha 33.88 –91.26 AR18 14 Arkansas SW Miller 33.48 –93.91 AR19 15 Arkansas SW Miller 33.47 –93.87 AR20 15 Arkansas SW Miller 33.47 –93.87 AR21 16 Arkansas SW Miller 33.47 –93.76 AR22 16 Arkansas SW Miller 33.47 –93.76 AR23 17 Arkansas SW Miller 33.38 –93.73 AR24 17 Arkansas SW Miller 33.38 –93.73 AR25 18 Arkansas SE Ashley 33.34 –91.47 DE1 19 Delaware SC Sussex 38.66 –75.42 GA1 20 Georgia SC Colquitt 31.30 –83.73 KY1 21 Kentucky NW Daviess 37.72 –87.16 LA1 22 Louisiana NE Tensas 31.96 –91.27 LA2 22 Louisiana NE Tensas 31.96 –91.27 LA3 22 Louisiana NE Tensas 31.96 –91.27 LA4 23 Louisiana SE West Baton Rouge30.41 –91.18 MO1 24 Missouri NE Knox 40.16 –92.21 MO2 25 Missouri SE Dunklin 36.23 –90.10 Copyright © 2011 SciRes. AJPS 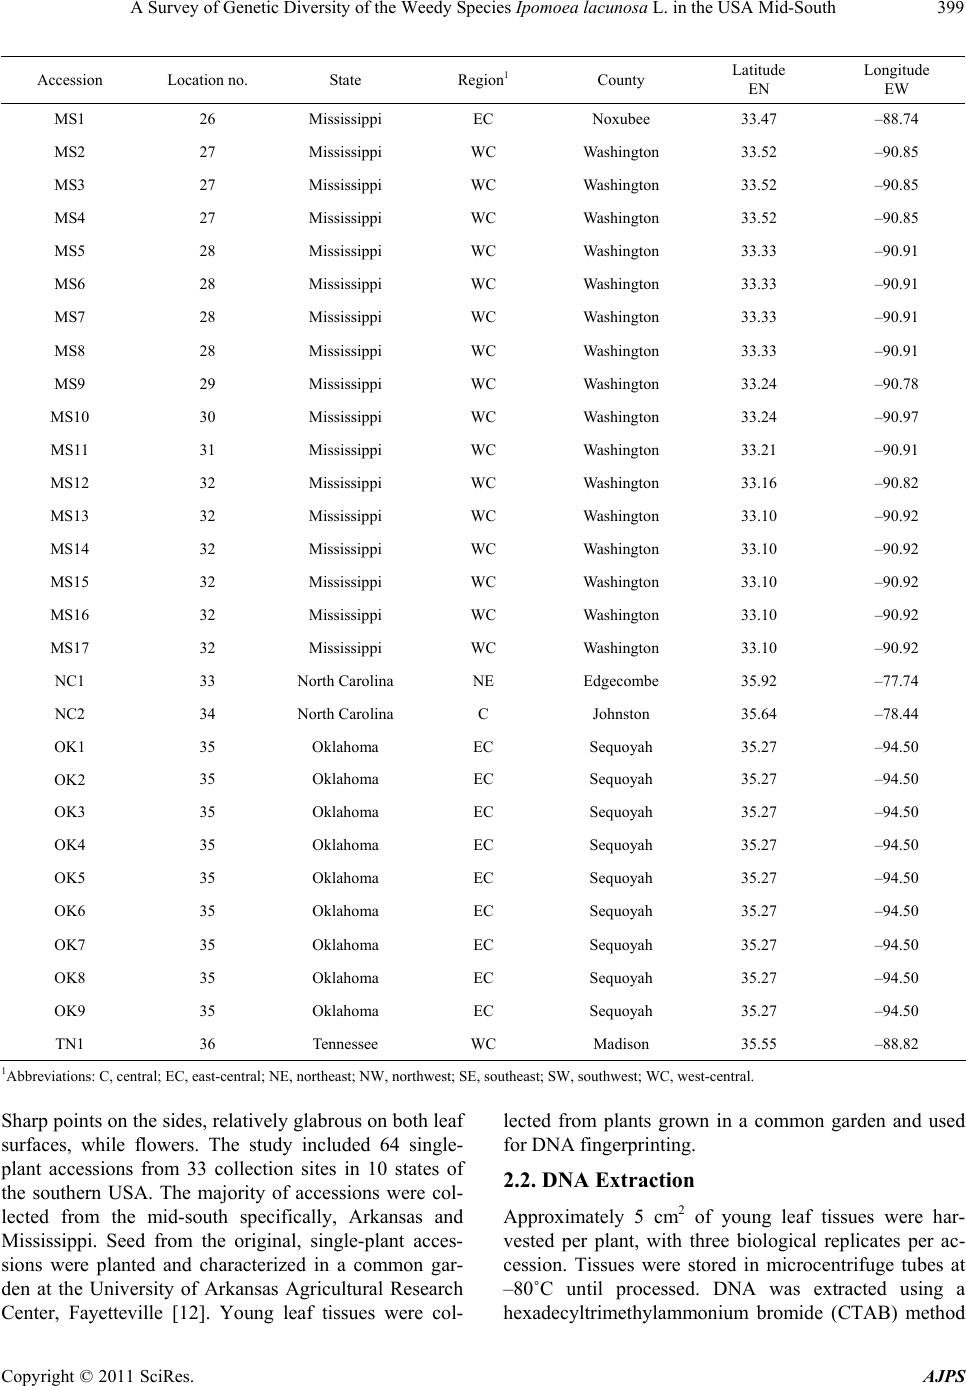 A Survey of Genetic Diversity of the Weedy Species Ipomoea lacunosa L. in the USA Mid-South Copyright © 2011 SciRes. AJPS 399 Accession Location no. State Region1 County Latitude N Longitude W MS1 26 Mississippi EC Noxubee 33.47 –88.74 MS2 27 Mississippi WC Washington 33.52 –90.85 MS3 27 Mississippi WC Washington 33.52 –90.85 MS4 27 Mississippi WC Washington 33.52 –90.85 MS5 28 Mississippi WC Washington 33.33 –90.91 MS6 28 Mississippi WC Washington 33.33 –90.91 MS7 28 Mississippi WC Washington 33.33 –90.91 MS8 28 Mississippi WC Washington 33.33 –90.91 MS9 29 Mississippi WC Washington 33.24 –90.78 MS10 30 Mississippi WC Washington 33.24 –90.97 MS11 31 Mississippi WC Washington 33.21 –90.91 MS12 32 Mississippi WC Washington 33.16 –90.82 MS13 32 Mississippi WC Washington 33.10 –90.92 MS14 32 Mississippi WC Washington 33.10 –90.92 MS15 32 Mississippi WC Washington 33.10 –90.92 MS16 32 Mississippi WC Washington 33.10 –90.92 MS17 32 Mississippi WC Washington 33.10 –90.92 NC1 33 North Carolina NE Edgecombe 35.92 –77.74 NC2 34 North Carolina C Johnston 35.64 –78.44 OK1 35 Oklahoma EC Sequoyah 35.27 –94.50 OK2 35 Oklahoma EC Sequoyah 35.27 –94.50 OK3 35 Oklahoma EC Sequoyah 35.27 –94.50 OK4 35 Oklahoma EC Sequoyah 35.27 –94.50 OK5 35 Oklahoma EC Sequoyah 35.27 –94.50 OK6 35 Oklahoma EC Sequoyah 35.27 –94.50 OK7 35 Oklahoma EC Sequoyah 35.27 –94.50 OK8 35 Oklahoma EC Sequoyah 35.27 –94.50 OK9 35 Oklahoma EC Sequoyah 35.27 –94.50 TN1 36 Tennessee WC Madison 35.55 –88.82 1Abbreviations: C, central; EC, east-central; NE, northeast; NW, northwest; SE, southeast; SW, southwest; WC, west-central. Sharp points on the sides, relatively glabrous on both leaf surfaces, while flowers. The study included 64 single- plant accessions from 33 collection sites in 10 states of the southern USA. The majority of accessions were col- lected from the mid-south specifically, Arkansas and Mississippi. Seed from the original, single-plant acces- sions were planted and characterized in a common gar- den at the University of Arkansas Agricultural Research Center, Fayetteville [12]. Young leaf tissues were col- lected from plants grown in a common garden and used for DNA fingerprinting. 2.2. DNA Extraction Approximately 5 cm2 of young leaf tissues were har- vested per plant, with three biological replicates per ac- cession. Tissues were stored in microcentrifuge tubes at –80˚C until processed. DNA was extracted using a hexadecyltrimethylammonium bromide (CTAB) method 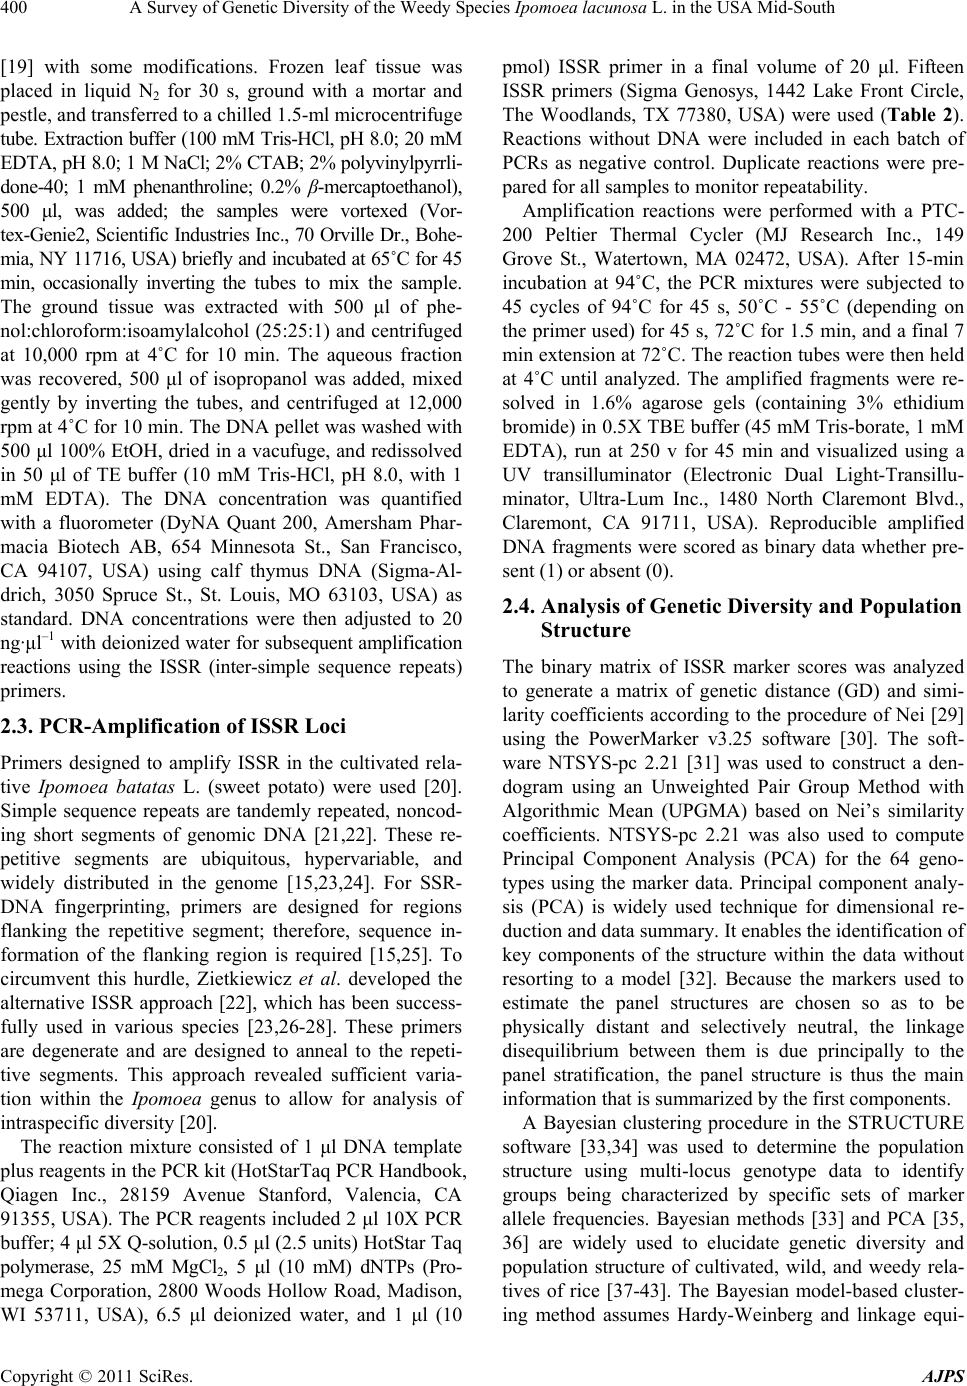 A Survey of Genetic Diversity of the Weedy Species Ipomoea lacunosa L. in the USA Mid-South 400 [19] with some modifications. Frozen leaf tissue was placed in liquid N2 for 30 s, ground with a mortar and pestle, and transferred to a chilled 1.5-ml microcentrifuge tube. Extraction buffer (100 mM Tris-HCl, pH 8.0; 20 mM EDTA, pH 8.0; 1 M NaCl; 2% CTAB; 2% polyvinylpyrrli- done-40; 1 mM phenanthroline; 0.2% β-mercaptoethanol), 500 μl, was added; the samples were vortexed (Vor- tex-Genie2, Scientific Industries Inc., 70 Orville Dr., Bohe- mia, NY 11716, USA) briefly and incubated at 65˚C for 45 min, occasionally inverting the tubes to mix the sample. The ground tissue was extracted with 500 μl of phe- nol:chloroform:isoamylalcohol (25:25:1) and centrifuged at 10,000 rpm at 4˚C for 10 min. The aqueous fraction was recovered, 500 μl of isopropanol was added, mixed gently by inverting the tubes, and centrifuged at 12,000 rpm at 4˚C for 10 min. The DNA pellet was washed with 500 μl 100% EtOH, dried in a vacufuge, and redissolved in 50 μl of TE buffer (10 mM Tris-HCl, pH 8.0, with 1 mM EDTA). The DNA concentration was quantified with a fluorometer (DyNA Quant 200, Amersham Phar- macia Biotech AB, 654 Minnesota St., San Francisco, CA 94107, USA) using calf thymus DNA (Sigma-Al- drich, 3050 Spruce St., St. Louis, MO 63103, USA) as standard. DNA concentrations were then adjusted to 20 ng·μl–1 with deionized water for subsequent amplification reactions using the ISSR (inter-simple sequence repeats) primers. 2.3. PCR-Amplification of ISSR Loci Primers designed to amplify ISSR in the cultivated rela- tive Ipomoea batatas L. (sweet potato) were used [20]. Simple sequence repeats are tandemly repeated, noncod- ing short segments of genomic DNA [21,22]. These re- petitive segments are ubiquitous, hypervariable, and widely distributed in the genome [15,23,24]. For SSR- DNA fingerprinting, primers are designed for regions flanking the repetitive segment; therefore, sequence in- formation of the flanking region is required [15,25]. To circumvent this hurdle, Zietkiewicz et al. developed the alternative ISSR approach [22], which has been success- fully used in various species [23,26-28]. These primers are degenerate and are designed to anneal to the repeti- tive segments. This approach revealed sufficient varia- tion within the Ipomoea genus to allow for analysis of intraspecific diversity [20]. The reaction mixture consisted of 1 μl DNA template plus reagents in the PCR kit (HotStarTaq PCR Handbook, Qiagen Inc., 28159 Avenue Stanford, Valencia, CA 91355, USA). The PCR reagents included 2 μl 10X PCR buffer; 4 μl 5X Q-solution, 0.5 μl (2.5 units) HotStar Taq polymerase, 25 mM MgCl2, 5 μl (10 mM) dNTPs (Pro- mega Corporation, 2800 Woods Hollow Road, Madison, WI 53711, USA), 6.5 μl deionized water, and 1 μl (10 pmol) ISSR primer in a final volume of 20 μl. Fifteen ISSR primers (Sigma Genosys, 1442 Lake Front Circle, The Woodlands, TX 77380, USA) were used (Table 2). Reactions without DNA were included in each batch of PCRs as negative control. Duplicate reactions were pre- pared for all samples to monitor repeatability. Amplification reactions were performed with a PTC- 200 Peltier Thermal Cycler (MJ Research Inc., 149 Grove St., Watertown, MA 02472, USA). After 15-min incubation at 94˚C, the PCR mixtures were subjected to 45 cycles of 94˚C for 45 s, 50˚C - 55˚C (depending on the primer used) for 45 s, 72˚C for 1.5 min, and a final 7 min extension at 72˚C. The reaction tubes were then held at 4˚C until analyzed. The amplified fragments were re- solved in 1.6% agarose gels (containing 3% ethidium bromide) in 0.5X TBE buffer (45 mM Tris-borate, 1 mM EDTA), run at 250 v for 45 min and visualized using a UV transilluminator (Electronic Dual Light-Transillu- minator, Ultra-Lum Inc., 1480 North Claremont Blvd., Claremont, CA 91711, USA). Reproducible amplified DNA fragments were scored as binary data whether pre- sent (1) or absent (0). 2.4. Analysis of Genetic Diversity and Population Structure The binary matrix of ISSR marker scores was analyzed to generate a matrix of genetic distance (GD) and simi- larity coefficients according to the procedure of Nei [29] using the PowerMarker v3.25 software [30]. The soft- ware NTSYS-pc 2.21 [31] was used to construct a den- dogram using an Unweighted Pair Group Method with Algorithmic Mean (UPGMA) based on Nei’s similarity coefficients. NTSYS-pc 2.21 was also used to compute Principal Component Analysis (PCA) for the 64 geno- types using the marker data. Principal component analy- sis (PCA) is widely used technique for dimensional re- duction and data summary. It enables the identification of key components of the structure within the data without resorting to a model [32]. Because the markers used to estimate the panel structures are chosen so as to be physically distant and selectively neutral, the linkage disequilibrium between them is due principally to the panel stratification, the panel structure is thus the main information that is summarized by the first components. A Bayesian clustering procedure in the STRUCTURE software [33,34] was used to determine the population structure using multi-locus genotype data to identify groups being characterized by specific sets of marker allele frequencies. Bayesian methods [33] and PCA [35, 36] are widely used to elucidate genetic diversity and population structure of cultivated, wild, and weedy rela- tives of rice [37-43]. The Bayesian model-based cluster- ing method assumes Hardy-Weinberg and linkage equi- Copyright © 2011 SciRes. AJPS 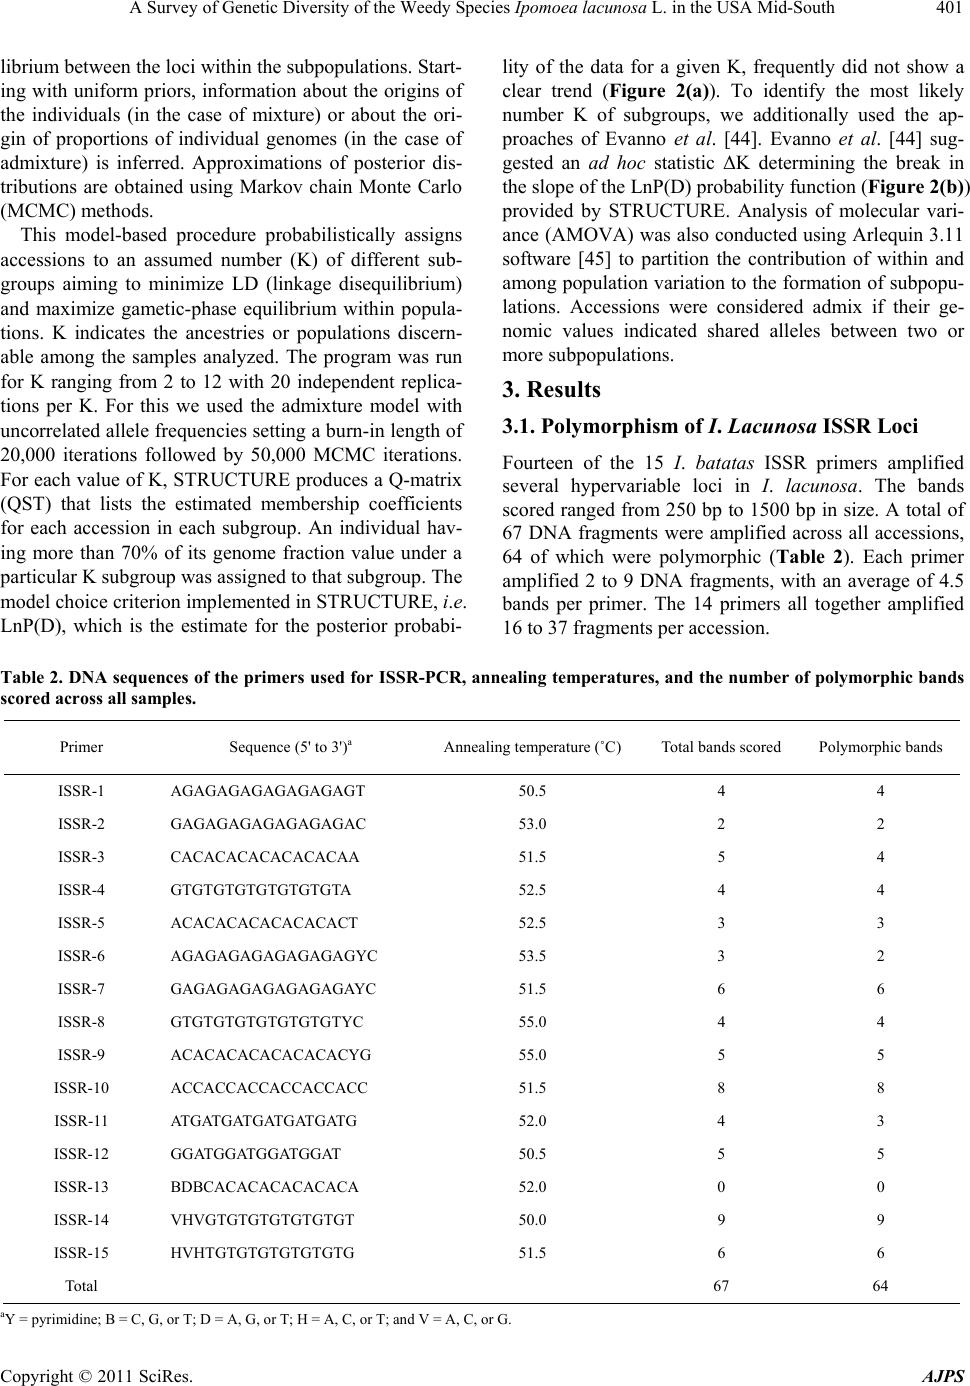 A Survey of Genetic Diversity of the Weedy Species Ipomoea lacunosa L. in the USA Mid-South Copyright © 2011 SciRes. AJPS 401 librium between the loci within the subpopulations. Start- ing with uniform priors, information about the origins of the individuals (in the case of mixture) or about the ori- gin of proportions of individual genomes (in the case of admixture) is inferred. Approximations of posterior dis- tributions are obtained using Markov chain Monte Carlo (MCMC) methods. This model-based procedure probabilistically assigns accessions to an assumed number (K) of different sub- groups aiming to minimize LD (linkage disequilibrium) and maximize gametic-phase equilibrium within popula- tions. K indicates the ancestries or populations discern- able among the samples analyzed. The program was run for K ranging from 2 to 12 with 20 independent replica- tions per K. For this we used the admixture model with uncorrelated allele frequencies setting a burn-in length of 20,000 iterations followed by 50,000 MCMC iterations. For each value of K, STRUCTURE produces a Q-matrix (QST) that lists the estimated membership coefficients for each accession in each subgroup. An individual hav- ing more than 70% of its genome fraction value under a particular K subgroup was assigned to that subgroup. The model choice criterion implemented in STRUCTURE, i.e. LnP(D), which is the estimate for the posterior probabi- lity of the data for a given K, frequently did not show a clear trend (Figure 2(a)). To identify the most likely number K of subgroups, we additionally used the ap- proaches of Evanno et al. [44]. Evanno et al. [44] sug- gested an ad hoc statistic ΔK determining the break in the slope of the LnP(D) probability function (Figure 2(b)) provided by STRUCTURE. Analysis of molecular vari- ance (AMOVA) was also conducted using Arlequin 3.11 software [45] to partition the contribution of within and among population variation to the formation of subpopu- lations. Accessions were considered admix if their ge- nomic values indicated shared alleles between two or more subpopulations. 3. Results 3.1. Polymorphism of I. Lacunosa ISSR Loci Fourteen of the 15 I. batatas ISSR primers amplified several hypervariable loci in I. lacunosa. The bands scored ranged from 250 bp to 1500 bp in size. A total of 67 DNA fragments were amplified across all accessions, 64 of which were polymorphic (Table 2). Each primer amplified 2 to 9 DNA fragments, with an average of 4.5 bands per primer. The 14 primers all together amplified 16 to 37 fragments per accession. Table 2. DNA sequences of the primers used for ISSR-PCR, annealing temperatures, and the number of polymorphic bands scored across all samples. Primer Sequence (5' to 3')a Annealing temperature (˚C) Total bands scored Polymorphic bands ISSR-1 AGAGAGAGAGAGAGAGT 50.5 4 4 ISSR-2 GAGAGAGAGAGAGAGAC 53.0 2 2 ISSR-3 CACACACACACACACAA 51.5 5 4 ISSR-4 GTGTGTGTGTGTGTGTA 52.5 4 4 ISSR-5 ACACACACACACACACT 52.5 3 3 ISSR-6 AGAGAGAGAGAGAGAGYC 53.5 3 2 ISSR-7 GAGAGAGAGAGAGAGAYC 51.5 6 6 ISSR-8 GTGTGTGTGTGTGTGTYC 55.0 4 4 ISSR-9 ACACACACACACACACYG 55.0 5 5 ISSR-10 ACCACCACCACCACCACC 51.5 8 8 ISSR-11 ATGATGATGATGATGATG 52.0 4 3 ISSR-12 GGATGGATGGATGGAT 50.5 5 5 ISSR-13 BDBCACACACACACACA 52.0 0 0 ISSR-14 VHVGTGTGTGTGTGTGT 50.0 9 9 ISSR-15 HVHTGTGTGTGTGTGTG 51.5 6 6 Total 67 64 aY = pyrimidine; B = C, G, or T; D = A, G, or T; H = A, C, or T; and V = A, C, or G.  A Survey of Genetic Diversity of the Weedy Species Ipomoea lacunosa L. in the USA Mid-South 402 (a) (b) Figure 2. Analysis of optimum ancestral subgroups for Ipomoea lacunosa (pitted morningglory) accessions, mostly from the southern USA using STRUCTURE software. 3.2. Genetic Diversity of I. Lacunosa from Southern USA In this study, Arkansas (AR) and Mississippi (MS) were more intensively sampled than the other states at 25 and 17, respectively. The overall GD among AR accessions was 0.206 and that of the MS accessions was 0.201. The 64 accessions separated into four genotypic clusters (Figure 3) with an overall average GD of 0.238. This is relatively low, similar to that of rice cultivars grown in the USA with an overall GD of 0.26, indicating a narrow genetic base [41]. The largest cluster (cluster 1) was composed of 38 accessions with three subclusters. The majority (83%) of accessions from AR fell in subcluster 1a. The one accession each from Alabama (AL1), Dela- ware (DE1) and Kentucky (KY1), two accessions from North Carolina (NC), and one accession from Mississippi (MS3) also were in the large AR subcluster. Another accession from MS (MS1) grouped with three AR acces- sions in subcluster 1c. The remaining 15 (88%) MS ac- cessions fell in cluster 4, where one AR accession (AR10) also belonged. Thus, in general, AR and MS accessions belonged to different genotypic groups with an average GD of 0.318 between groups. All nine accessions from East-central Oklahoma (OK), which were collected from one field, composed subcluster 1b. The average GD within the OK population was 0.146, indicating that plants in this field were very highly similar. Genetic similarity approaches 1.0 as GD approaches 0. Although the OK accessions were collected from a field close to the AR border, collectively the OK population belonged to a different genotypic subgroup relative to the AR population with an average GD of 0.269 among the two populations. The two accessions from eastern Missouri Copyright © 2011 SciRes. AJPS  A Survey of Genetic Diversity of the Weedy Species Ipomoea lacunosa L. in the USA Mid-South403 (MO) grouped with AR1 and AR5 from northern AR in cluster 2. One accession from Tennessee (TN1) was in a cluster by itself (cluster 3). The four Louisiana (LA) ac- cessions were all in cluster 4, together with the majority of MS accessions. The one accession from Georgia (GA1) also fell in the large MS cluster, forming a subcluster with three of the LA accessions. Figure 3. UPGMA tree of 64 accessions of Ipomoea lacunosa (pitted morningglory) mostly from the southern USA, based on Nei’s [29] similarity coefficients using NTSYS-pc 2.21 software. The LA accessions and GA1 originated from latitudes of 31.97˚N or further south (Table 1). In many cases in this data set, accessions collected along the same latitude were more genetically similar. The grouping of LA accessions and GA1 within the same genotypic subcluster indicates that longitude (within its habitat range) might not influence ge- netic variation of I. lacunosa as much as latitude would. The LA and AR accessions were from a longitude of –91.18˚W to –91.27˚W, while GA1 was from a longitude of –83.73˚W. However, to properly define the relationship between lati- tude and species diversification of I. lacunosa, a follow-up experiment need to be conducted involving intensive and structured sampling along different latitudinal gradients. Different ecotypes of this species [12] may also be dispersed along latitudinal gradient depending on its photoperiodicity [46]. 3.3. Population Structure of I. Lacunosa The most probable number of ancestral lineage (K) of these accessions is three (Figure 2(a)). This is the num- ber of subgrouping that optimizes ΔK (Figure 2(b)). The partitioning of molecular variance within and among subpopulations was significant (P < 0.0001) and the greatest contribution to population genetic divergence (73%) emanated from within the subpopulation (Figure 4). The majority (15 of 25) AR accessions, which con- stituted a large proportion of genotypic cluster 1, fell under subpopulation K1 (Figure 5). This subpopulation also included the two accessions from MO, the two ac- cessions from NC, and the single accessions from DE, KY, and TN. Only the MS1 accession from MS belonged to this group. Three accessions in this group were ad- mixtures (AR14, AR12, AR4), sharing > 30% of its al- leles with other subgroups (Table 3). The second subpopulation (K2) included all accessions from OK, seven accessions from AR, and the one acces- sion from Alabama (AL1) (Figure 5). Specifically, this included subclusters 1b and 1c, 32% of accessions from subcluster 1a, and two (AR4 and NC2) of four accessions from cluster 2 (Figure 3). Three accessions in this sub- group were admixtures: OK2, AR16, and AL1 (Table 3). The third subpopulation (K3) included all accessions from MS (except MS1) and LA, two accessions from AR (AR10, AR23), and the single accession from GA (Figure 5). Thus, this ancestral subgroup covered all accessions in genotypic cluster 4 (Figure 3). Five accessions in this sub- population were admixtures (Table 3), generally sharing alleles with K1. The presence of admix accessions indicated genetic introgression between subpopulations. 4. Discussion ISSR markers have been used to study the genetic diversity of crops including barley [47], rice [48], sweet potato [20], Copyright © 2011 SciRes. AJPS 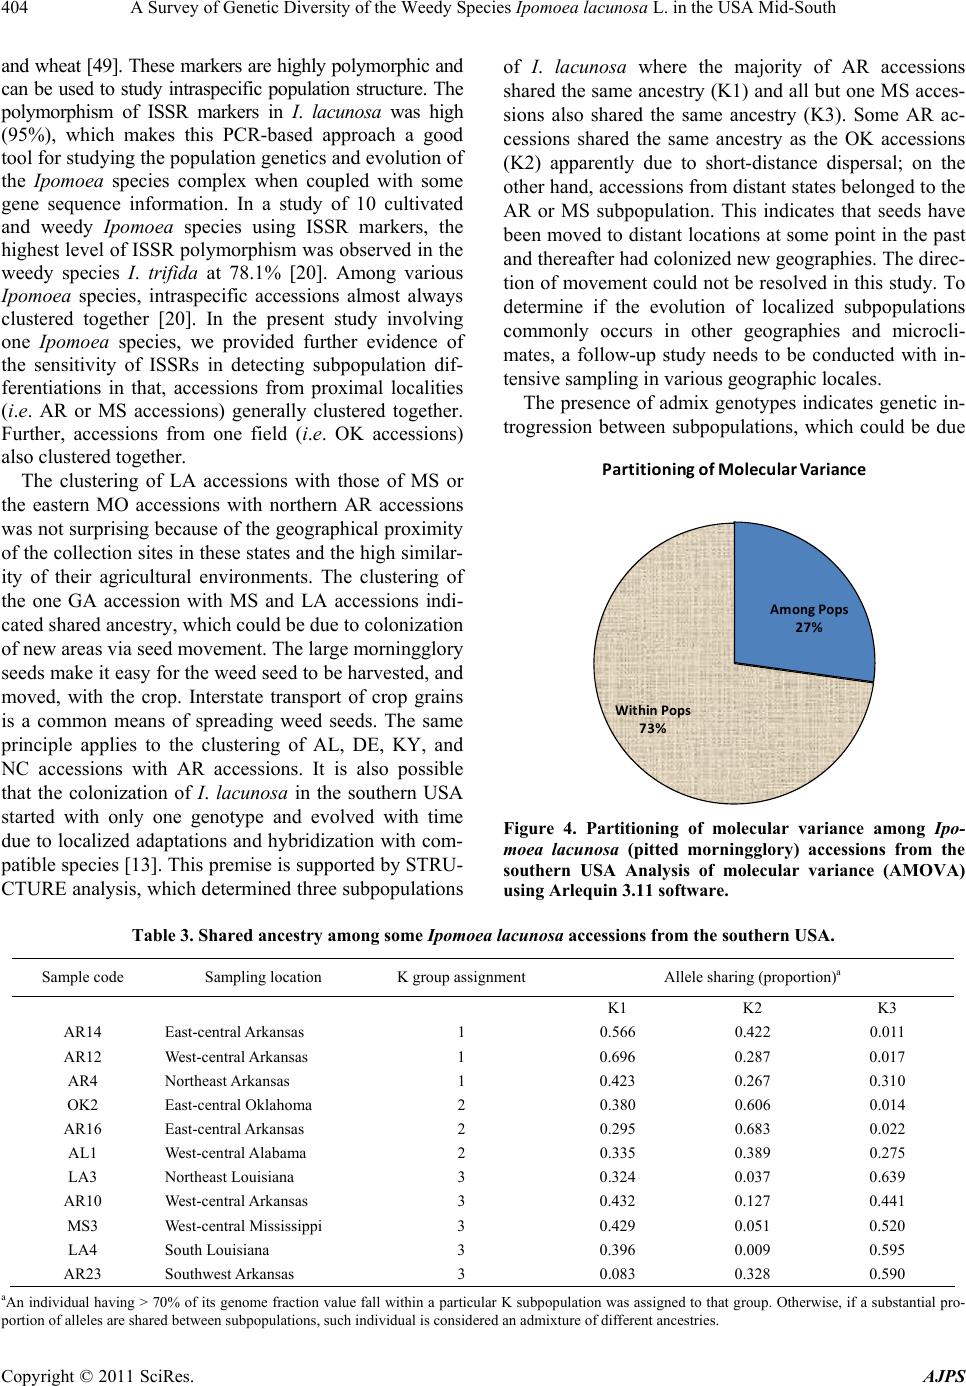 A Survey of Genetic Diversity of the Weedy Species Ipomoea lacunosa L. in the USA Mid-South Copyright © 2011 SciRes. AJPS 404 and wheat [49]. These markers are highly polymorphic and can be used to study intraspecific population structure. The polymorphism of ISSR markers in I. lacunosa was high (95%), which makes this PCR-based approach a good tool for studying the population genetics and evolution of the Ipomoea species complex when coupled with some gene sequence information. In a study of 10 cultivated and weedy Ipomoea species using ISSR markers, the highest level of ISSR polymorphism was observed in the weedy species I. trifida at 78.1% [20]. Among various Ipomoea species, intraspecific accessions almost always clustered together [20]. In the present study involving one Ipomoea species, we provided further evidence of the sensitivity of ISSRs in detecting subpopulation dif- ferentiations in that, accessions from proximal localities (i.e. AR or MS accessions) generally clustered together. Further, accessions from one field (i.e. OK accessions) also clustered together. of I. lacunosa where the majority of AR accessions shared the same ancestry (K1) and all but one MS acces- sions also shared the same ancestry (K3). Some AR ac- cessions shared the same ancestry as the OK accessions (K2) apparently due to short-distance dispersal; on the other hand, accessions from distant states belonged to the AR or MS subpopulation. This indicates that seeds have been moved to distant locations at some point in the past and thereafter had colonized new geographies. The direc- tion of movement could not be resolved in this study. To determine if the evolution of localized subpopulations commonly occurs in other geographies and microcli- mates, a follow-up study needs to be conducted with in- tensive sampling in various geographic locales. The presence of admix genotypes indicates genetic in- trogression between subpopulations, which could be due AmongPops 27% WithinPops 73% PartitioningofMolecularVariance The clustering of LA accessions with those of MS or the eastern MO accessions with northern AR accessions was not surprising because of the geographical proximity of the collection sites in these states and the high similar- ity of their agricultural environments. The clustering of the one GA accession with MS and LA accessions indi- cated shared ancestry, which could be due to colonization of new areas via seed movement. The large morningglory seeds make it easy for the weed seed to be harvested, and moved, with the crop. Interstate transport of crop grains is a common means of spreading weed seeds. The same principle applies to the clustering of AL, DE, KY, and NC accessions with AR accessions. It is also possible that the colonization of I. lacunosa in the southern USA started with only one genotype and evolved with time due to localized adaptations and hybridization with com- patible species [13]. This premise is supported by STRU- CTURE analysis, which determined three subpopulations Figure 4. Partitioning of molecular variance among Ipo- moea lacunosa (pitted morningglory) accessions from the southern USA Analysis of molecular variance (AMOVA) using Arlequin 3.11 software. Table 3. Shared ancestry among some Ipomoea lac uno sa accessions from the southern USA. Sample code Sampling location K group assignment Allele sharing (proportion)a K1 K2 K3 AR14 East-central Arkansas 1 0.566 0.422 0.011 AR12 West-central Arkansas 1 0.696 0.287 0.017 AR4 Northeast Arkansas 1 0.423 0.267 0.310 OK2 East-central Oklahoma 2 0.380 0.606 0.014 AR16 East-central Arkansas 2 0.295 0.683 0.022 AL1 West-central Alabama 2 0.335 0.389 0.275 LA3 Northeast Louisiana 3 0.324 0.037 0.639 AR10 West-central Arkansas 3 0.432 0.127 0.441 MS3 West-central Mississippi 3 0.429 0.051 0.520 LA4 South Louisiana 3 0.396 0.009 0.595 AR23 Southwest Arkansas 3 0.083 0.328 0.590 aAn individual having > 70% of its genome fraction value fall within a particular K subpopulation was assigned to that group. Otherwise, if a substantial pro- portion of alleles are shared between subpopulations, such individual is considered an admixture of different ancestries. 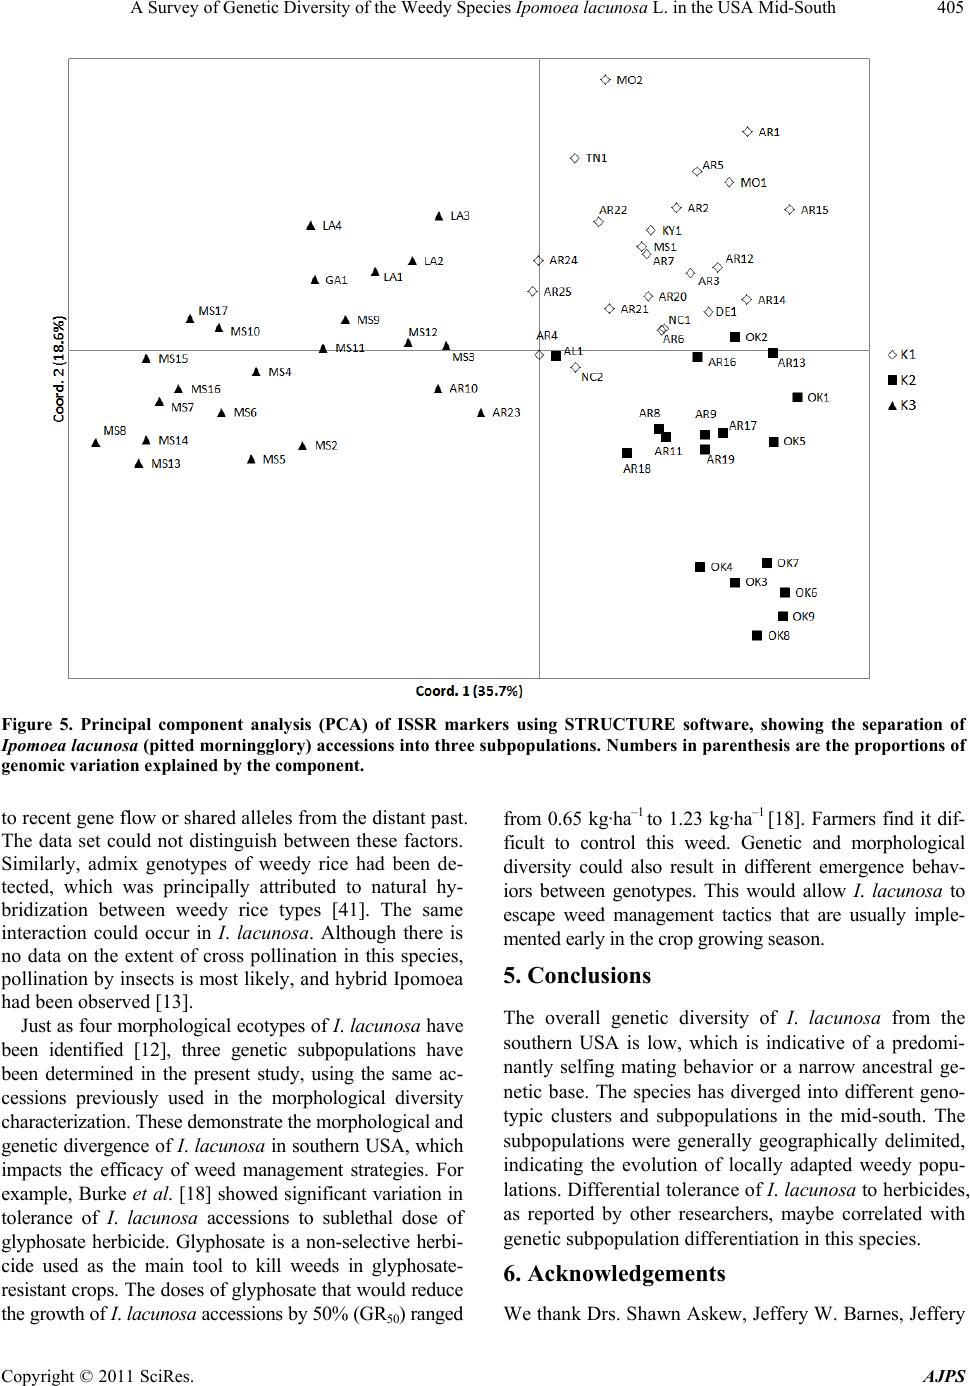 A Survey of Genetic Diversity of the Weedy Species Ipomoea lacunosa L. in the USA Mid-South405 Figure 5. Principal component analysis (PCA) of ISSR markers using STRUCTURE software, showing the separation of Ipomoea lacunosa (pitted morningglory) accessions into three subpopulations. Numbers in parenthesis are the proportions of genomic variation explained by the c omponent. to recent gene flow or shared alleles from the distant past. The data set could not distinguish between these factors. Similarly, admix genotypes of weedy rice had been de- tected, which was principally attributed to natural hy- bridization between weedy rice types [41]. The same interaction could occur in I. lacunosa. Although there is no data on the extent of cross pollination in this species, pollination by insects is most likely, and hybrid Ipomoea had been observed [13]. Just as four morphological ecotypes of I. lacunosa have been identified [12], three genetic subpopulations have been determined in the present study, using the same ac- cessions previously used in the morphological diversity characterization. These demonstrate the morphological and genetic divergence of I. lacunosa in southern USA, which impacts the efficacy of weed management strategies. For example, Burke et al. [18] showed significant variation in tolerance of I. lacunosa accessions to sublethal dose of glyphosate herbicide. Glyphosate is a non-selective herbi- cide used as the main tool to kill weeds in glyphosate- resistant crops. The doses of glyphosate that would reduce the growth of I. lacunosa accessions by 50% (GR50) ranged from 0.65 kg·ha–1 to 1.23 kg·ha–1 [18]. Farmers find it dif- ficult to control this weed. Genetic and morphological diversity could also result in different emergence behav- iors between genotypes. This would allow I. lacunosa to escape weed management tactics that are usually imple- mented early in the crop growing season. 5. Conclusions The overall genetic diversity of I. lacunosa from the southern USA is low, which is indicative of a predomi- nantly selfing mating behavior or a narrow ancestral ge- netic base. The species has diverged into different geno- typic clusters and subpopulations in the mid-south. The subpopulations were generally geographically delimited, indicating the evolution of locally adapted weedy popu- lations. Differential tolerance of I. lacunosa to herbicides, as reported by other researchers, maybe correlated with genetic subpopulation differentiation in this species. 6. Acknowledgements We thank Drs. Shawn Askew, Jeffery W. Barnes, Jeffery Copyright © 2011 SciRes. AJPS  A Survey of Genetic Diversity of the Weedy Species Ipomoea lacunosa L. in the USA Mid-South 406 W. Edwards, James L. Griffin, Robert Hayes, William G. Johnson, Donnie K. Miller, Edward C. Murdock, Don S. Murray, Eric Palmer, Andrew Price, Jason C. Sanders, Mark Van Gessel, William Vencill, Blaine J. Viator, and the late Drs. William Barrentine and John W. Wilcut for contributing seed samples for this research. We also thank Dr. Satyendra N. Rajguru, former Postdoctoral Associate, for his help in setting up the DNA finger- printing process. They made this research possible. REFERENCES [1] C. D. Elmore, H. R. Hurst and D. F. Austin, “Biology and Control of Morningglories (Ipomoea spp.),” Reviews in Weed Science, Vol. 5, 1990, pp. 83-114. [2] J. A. McDonald and T. J. Mabry, “Phylogenetic System- atic of New World Ipomoea (Convolvulaceae) Based on Chloroplast DNA Restriction Site Variation,” Plant Sys- tematic Evolution, Vol. 180, 1992, pp. 243-259. [3] D. F. Austin and Z. Huáman, “A Synopsis of the Ipomoea (Convolvulaceae) in the Americas,” Taxon, Vol. 45, 1996, pp. 3-38. [4] M. A. Barker, L. Thompson Jr and F. M. Godley, “Con- trol of Annual Morningglories (Ipomoea spp.) in Soy- beans (Glycine max),” Weed Science, Vol. 32, 1984, pp. 813-818. [5] C. D. Elmore, J. B. Wiseman and S. McDaniel, “Morn- ingglory Survey of Cotton and Soybean Fields in the Mississippi Delta: 1981,” Proceedings of Southern Weed Science Society, Vol. 35, 1982, pp. 319-328. [6] M. L. Fernald, “Gray’s Manual of Botany,” 8th Edition (Centennial), American Book Company, New York, 1950. [7] A. E. Radford, H. E. Ahles and C. R. Bell, “Manual of the Vascular Flora of the Carolinas,” The University of North Carolina Press, Chapel Hill, 1968. [8] T. M. Webster, “Weed Survey—Southern States: Broad- leaf Crops Subsection,” Annual Meeting Abstracts, Southern Weed Science Society, Champaign, 2005. [9] T. M. Webster, “Weed Survey—Southern States: Vegeta- bles, Fruits and Nut Crops,” Annual Meeting Abstracts, Southern Weed Science Society, Champaign, 2006. [10] O. W. Howe III and L. R. Oliver, “Influence of Soybean (Glycine max) Row Spacing on Pitted Morningglory In- terference,” Weed Science, Vol. 35, 1987, pp. 185-193. [11] C. D. Elmore, “Weed Survey—Southern States,” South- ern Weed Science Society Report, Vol. 37, 1984, pp. 192-198. [12] D. O. Stephenson IV, L. R. Oliver, N. R. Burgos and E. E. Gbur Jr, “Identification and Characterization of Pitted Morningglory (Ipomoea lacunosa) Ecotypes,” Weed Sci- ence, Vol. 54, No. 1, 2006, pp. 78-86. doi:10.1614/WS-04-205R.1 [13] C. T. Bryson, K. N. Reddy and I. C. Burke, “Morpho- logical Comparison of Morningglory (Ipomoea and Jac- quemontia spp.) Populations from the Southeastern United States,” Weed Science, Vol. 56, No. 5, 2008, pp. 692-698. doi:10.1614/WS-07-198.1 [14] C. D. Elmore, “Mode of Reproduction and Inheritance of Leaf Shape in Ipomoea hederacea,” Weed Science, Vol. 34, 1986, pp. 391-395. [15] M. Jasieniuk and B. D. Maxwell, “Plant Diversity: New Insights from Molecular Biology and Genomics Tech- nologies,” Weed Science, Vol. 49, No. 2, 2001, pp. 257-265. doi:10.1614 /0043-1745 (2001)04 9[0257:PDNI FM]2.0.CO;2 [16] L. Dekker, “Weed Diversity and Weed Management,” Weed Science, Vol. 45, 1997, pp. 357-363. [17] E. P. Odum, “Fundamentals in Ecology,” 3rd Edition, W. B. Saunders Co., Philadelphia, 1971. [18] I. C. Burke, K. N. Reddy and C. T. Bryson, “Pitted and Hybrid Morningglory Accessions Have Variable Toler- ance to Glyphosate,” Weed Technology, Vol. 23, No. 4, 2009, pp. 592-598. doi:10.1614/WT-09-028.1 [19] J. J. Doyle and J. L. Doyle, “Isolation of Plant DNA from Fresh Tissue,” Focus, Vol. 1, 1990, pp. 13-15. [20] J. C. Huang and M. Sun, “Genetic Diversity and Rela- tionships of Sweet Potato and Its Wild Relatives in Ipo- moea series Batatas (Convolvulaceae) as Revealed by In- ter-Simple Sequence Repeat (ISSR) and Restriction Analysis of Chloroplast DNA,” Theoretical and Applied Genetics, Vol. 100, No. 7, 2000, pp. 1050-1060. doi:10.1007/s001220051386 [21] M. V. Katti, P. K. Ranjekar and V. S. Gupta, “Differential Distribution of Simple Sequence Repeats in Eukaryotic Genome Sequences,” Molecular Biology and Evolution, Vol. 18, 2001, pp. 1161-1167. [22] E. Zietkiewicz, A. Rafalski and D. Labuda, “Genomic Fin- gerprinting by Simple Sequence Repeat (SSR)-Anchored Polymerase Chain Reaction Amplification,” Genomics, Vol. 20, 1994, pp. 176-183. [23] B. Liu and J. F. Wendel, “Intersimple Sequence Repeat (ISSR) Polymorphisms as a Genetic Marker in Cotton,” Molecular Ecology Notes, Vol. 1, No. 3, 2001, pp. 205-208. doi:10.1046/j.1471-8278.2001.00073.x [24] M. Morgante and M. Olivieri, “PCR-Amplified Microsatel- lites as Markers in Plant Genetics,” Plant Journal, Vol. 3, 1993, pp. 175-182. doi:10.1111/j.1365-313X.1993.tb00020.x [25] P. C. O. Hanlon, R. Peakall and D. T. Briese, “A Review of New PCR-Based Genetic Markers and Their Utility to Weed Ecology,” Weed Research, Vol. 40, No. 3, 2000, pp. 239-254. doi:10.1046/j.1365-3180.2000.00191.x [26] M. Z. Galvan, B. Bornet, P. A. Balatti and M. Branchard, “Inter Simple Sequence Repeat (ISSR) Markers as a Tool for the Assessment of Both Genetic Diversity and Gene Pool Origin in Common Bean (Phaseolus vulgaris L.),” Euphytica, Vol. 123, 2003, pp. 297-301. [27] G. A. Lallemand and M. Bourgoin, “Fast and Reliable Strawberry Cultivar Identification Using Inter Simple Sequence Repeat (ISSR) Amplification,” Euphytica, Vol. 129, 2002, pp. 69-79. Copyright © 2011 SciRes. AJPS  A Survey of Genetic Diversity of the Weedy Species Ipomoea lacunosa L. in the USA Mid-South Copyright © 2011 SciRes. AJPS 407 [28] B. J. Parsons, H. J. Newbury, M. T. Jackson and B. V. Ford-Lloyd, “Contrasting Genetic Diversity Relationships Are Revealed in Rice (Oryza sativa L.) Using Different Marker Types,” Molecular Breeding, Vol. 3, No. 2, 1997, pp. 115-125. doi:10.1023/A:1009635721319 [29] M. Nei, “Genetic Distance between Populations,” Ameri- can Naturalist, Vol. 106, 1972, pp. 283-292. [30] K. Liu and S. V. Muse, “PowerMarker: An Integrated Analysis Environment for Genetic Marker Analysis,” Bioinformatics, Vol. 21, 2005, pp. 2128-2129. [31] F. J. Rohl, “NTSYS-pc: Numerical Taxonomy System, v 2.21,” Exeter Publishing, Ltd., New York, 2008. [32] G. McVean, “A Genealogical Interpretation of Principal Components Analysis,” PLoS Genetics, Vol. 5, No. 10, 2009, p. e1000686. doi:10.1371/journal.pgen.1000686 [33] J. K. Pritchard, M. Stephens and P. Donnelly, “Inference of Population Structure Using Multilocus Genotype Data,” Genetics, Vol. 155, 2000, 945-959. [34] D. Falush, M. Stephens and J. K. Pritchard, “Inference of Population Structure Using Multilocus Genotype Data: Linked Loci and Correlated Allele Frequencies,” Genetics, Vol. 164, 2003, pp. 1567-1587. [35] A. L. Price, N. J. Patterson, R. M. Plenge, M. E. Wein- blatt, N. A. Shadick and D. Reich, “Principal Components Analysis Corrects for Stratification in Genome-Wide As- sociation Studies,” Nature Genetics, Vol. 38, No. 8, 2006, pp. 904-909. doi:10.1038/ng1847 [36] N. Patterson, A. L. Price and D. Reich, “Population Struc- ture and Eigen Analysis,” PloS Genetics, Vol. 2, No. 12, 2006, p. e190. doi:10.1371/journal.pgen.0020190 [37] H. A. Agrama and G. C. Eizenga, “Molecular Diversity and Genome-Wide Linkage Disequilibrium Pattern in Worldwide Rice and Its Wild Relatives,” Euphytica, Vol. 160, 2008, pp. 339-355. [38] H. A. Agrama, J. M. Yan, R. Fjellstrom and A. M. McClung, “Genetic Structure Associated with Diversity and Geographic Distribution in the USDA Rice World Collection,” Natural Science, Vol. 2, No. 4, 2010, pp. 247-291. doi:10.4236/ns.2010.24036 [39] G. C. Eizenga, H. A. Agrama, F. N. Lee and Y. Jia, “Ex- ploring Genetic Diversity and Potential Novel Disease Resistance Genes in a Collection of Rice Wild Relatives,” Genetic Resources and Crop Evolution, Vol. 56, No. 1, 2009, pp. 65-76. doi:10.1007/s10722-008-9345-7 [40] D. R. Gealy, H. A. Agrama and G. Eizenga, “Exploring the Genetic and Spatial Structure of U.S. Weedy Red Rice (Oryza sativa) Accessions in Relation to Global Oryza spp.,” Weed Science, Vol. 57, No. 6, 2009, pp. 627-643. doi:10.1614/WS-09-018.1 [41] V. K. Shivrain, N. R. Burgos, H. A. Agrama, A. Lawton-Rauh, B. LU, M. A. Sales, V. Boyett, D. R. Gealy and K. A. K. Moldenhauer, “Genetic Diversity of Weedy Rice (Oryza sativa L.) in Arkansas, USA,” Weed Research, Vol. 50, 2010, pp. 289-302. [42] J. Xie, H. A. Agrama, D. Kong, J. Zhuang, W. Yan, B. Hu and Z. Zhuang, “Genetic Diversity of Endangered Dongxiang Wild Rice (Oryza rufipogon),” Genetic Re- sources and Crop Evolution, Vol. 57, No. 4, 2010, pp. 597-609. doi:10.1007/s10722-009-9498-z [43] W. Yan, H. A. Agrama, M. Jia, R. Fjellstrom and A. M. McClung, “Geographic Description of Genetic Diversity and Genetic Relationships in the USDA Rice World Col- lection,” Crop Science, Vol. 50, No. 6, 2010, pp. 2406-2417. doi:10.2135/cropsci2010.02.0096 [44] G. Evanno, S. Regnaut and J. Goudet, “Detecting the Number of Clusters of Individuals Using the Software STRUCTURE: A Simulation Study,” Molecular Ecology, Vol. 14, No. 8, 2005, pp. 2611-2620. doi:10.1111/j.1365-294X.2005.02553.x [45] L. Excoffer, G. Laval and S. Schneider, “Arlequin (Ver- sion 3.0): An Integrated Software Package for Population Genetics Data Analysis,” Evolutionary Bioinformatics Online, Vol. 1, 2005, pp. 47-50. [46] S. A. Senseman and L. R. Oliver, “Flowering Patterns, Seed Production, and Somatic Polymorphism of Three Weed Species,” Weed Science, Vol. 41, 1993, pp. 418- 425. [47] B. Tanyolac, “Inter-Simple Sequence Repeat (ISSR) and RAPD Variation Among Wild Barley Hordeum vulgare subsp. spontaneum) Populations from West Turkey,” Genetic Resources in Crop Evolution, Vol. 50, No. 6, 2003, pp. 611-614. doi:10.1023/A:1024412814757 [48] S. P. Joshi, V. S. Gupta, R. K. Aggarwal, P. K. Ranjekar and D. S. Brar, “Genetic Diversity and Phylogenetic Re- lationship as Revealed by Inter-Simple Sequence Repeat (ISSR) Polymorphism in the Genus Oryza,” Theoretical and Applied Genetics, Vol. 100, No. 8, 2000, pp. 1311-1320. doi:10.1007/s001220051440 [49] T. Nagaoka and Y. Ogihara, “Applicability of Inter-Si- mple Sequence Repeat Polymorphisms in Wheat for Use as DNA Markers in Comparison to RFLP and RAPD Markers,” Theoretical and Applied Genetics, Vol. 94, No. 5, 1997, pp. 597-602. doi:10.1007/s001220050456
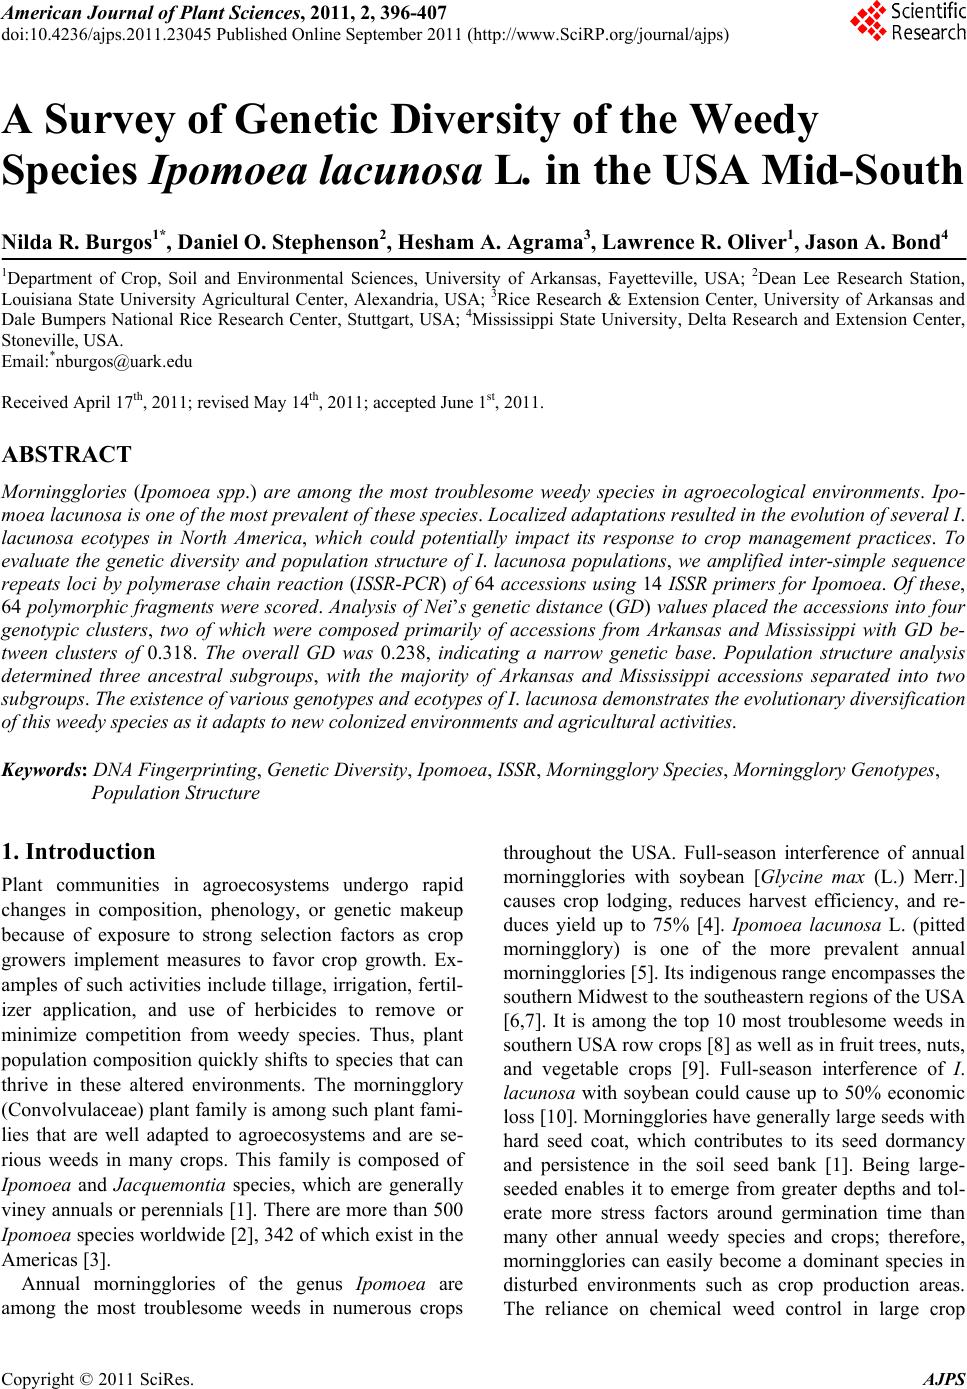
|