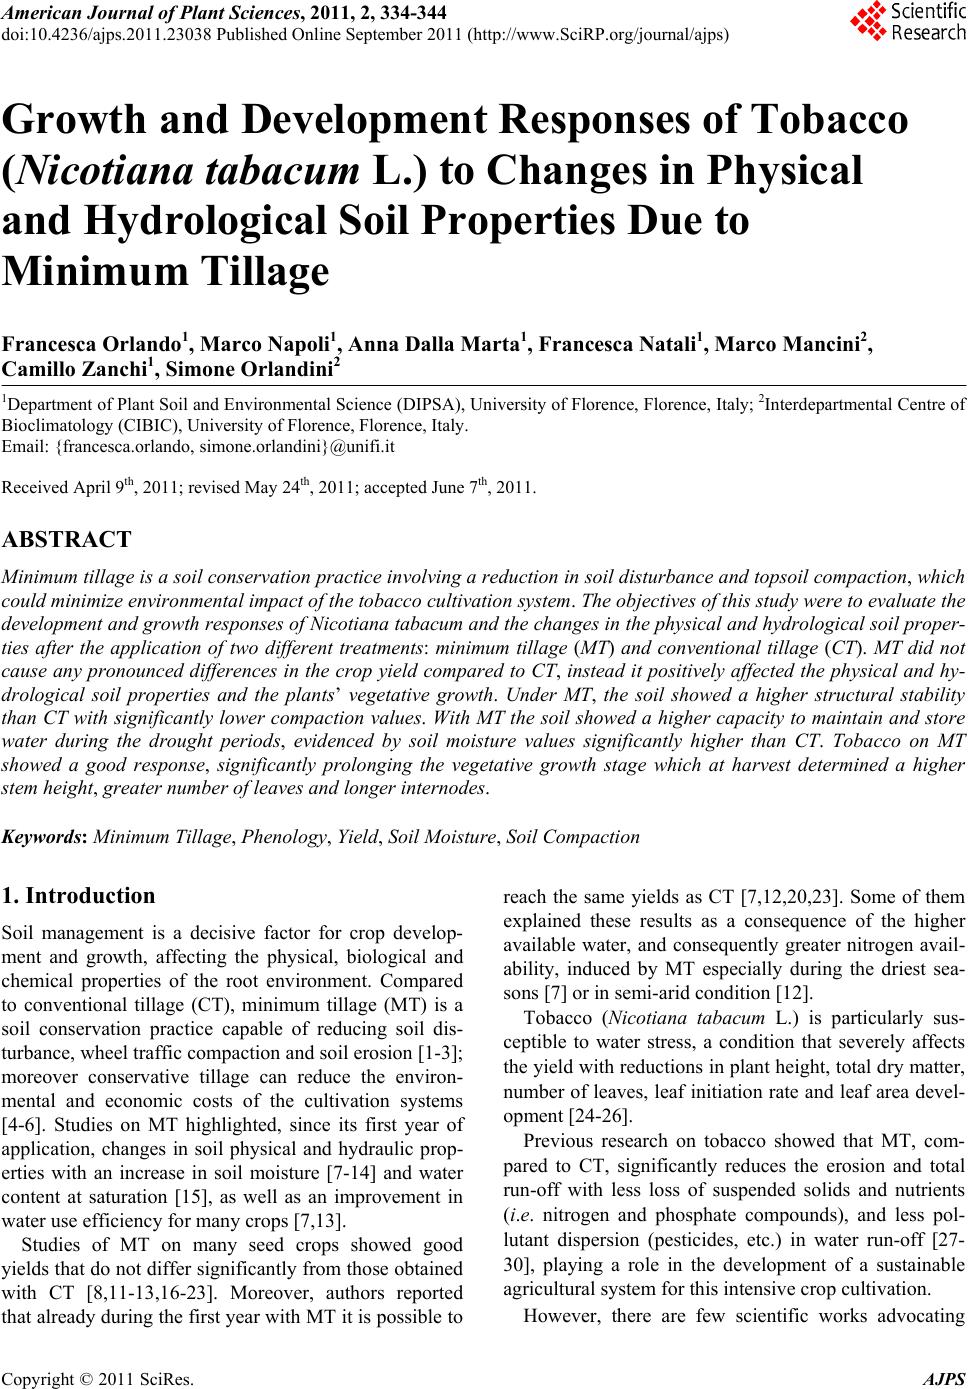
 American Journal of Plant Sciences, 2011, 2, 334-344 doi:10.4236/ajps.2011.23038 Published Online September 2011 (http://www.SciRP.org/journal/ajps) Copyright © 2011 SciRes. AJPS Growth and Development Responses of Tobacco (Nicotiana tabacum L.) to Changes in Physical and Hydrological Soil Properties Due to Minimum Tillage Francesca Orlando1, Marco Napoli1, Anna Dalla Marta1, Francesca Natali1, Marco Mancin i 2, Camillo Zanchi1, Simone Orlandini2 1Department of Plant Soil and Environmental Science (DIPSA), University of Florence, Florence, Italy; 2Interdepartmental Centre of Bioclimatology (CIBIC), University of Florence, Florence, Italy. Email: {francesca.orlando, simone.orlandini}@unifi.it Received April 9th, 2011; revised May 24th, 2011; accepted June 7th, 2011. ABSTRACT Minimum tillage is a so il conservation pra ctice involving a red uction in soil distu rbance and topsoil compa ction, wh ic h could minimize environmen ta l impact of th e toba cco cu ltivatio n system . The objectives o f this study were to evalua te the development and growth responses of Nicotiana tabacum and the changes in the physical and hydrological soil proper- ties after the application of two different treatments: minimum tillage (MT) and conventional tillage (CT). MT did not cause any pronounced differences in the crop yield compared to CT, instead it positively affected the physical and hy- drological soil properties and the plants’ vegetative growth. Under MT, the soil showed a higher structural stability than CT with significantly lower compaction values. With MT the soil showed a higher capacity to main tain and store water during the drought periods, evidenced by soil moisture values significantly higher than CT. Tobacco on MT showed a good response, significantly prolonging the vegetative growth stage which at harvest determined a higher stem heig h t, greater num ber of leaves an d l o nger internodes . Keywords: Minimum Tillage, Phenology, Yield, Soil Moisture, Soil Compaction 1. Introduction Soil management is a decisive factor for crop develop- ment and growth, affecting the physical, biological and chemical properties of the root environment. Compared to conventional tillage (CT), minimum tillage (MT) is a soil conservation practice capable of reducing soil dis- turbance, wheel traffic compaction and soil erosion [1-3]; moreover conservative tillage can reduce the environ- mental and economic costs of the cultivation systems [4-6]. Studies on MT highlighted, since its first year of application, changes in soil physical and hydraulic prop- erties with an increase in soil moisture [7-14] and water content at saturation [15], as well as an improvement in water use efficiency for many crops [7,13]. Studies of MT on many seed crops showed good yields that do not differ significantly from those obtained with CT [8,11-13,16-23]. Moreover, authors reported that already during the first year with MT it is possible to reach the same yields as CT [7,12,20,23]. Some of them explained these results as a consequence of the higher available water, and consequently greater nitrogen avail- ability, induced by MT especially during the driest sea- sons [7] or in semi-arid condition [12]. Tobacco (Nicotiana tabacum L.) is particularly sus- ceptible to water stress, a condition that severely affects the yield with reductions in plant height, total dry matter, number of leaves, leaf initiation rate and leaf area devel- opment [24-26]. Previous research on tobacco showed that MT, com- pared to CT, significantly reduces the erosion and total run-off with less loss of suspended solids and nutrients (i.e. nitrogen and phosphate compounds), and less pol- lutant dispersion (pesticides, etc.) in water run-off [27- 30], playing a role in the development of a sustainable agricultural system for this intensive crop cultivation. However, there are few scientific works advocating  Growth and Development Responses of Tobacco (Nicotiana tabacum L.) to Changes in Physical and 335 Hydrological Soil Properties Due to Minimum Tillage the use of MT on tobacco, and the primary factors limit- ing the diffusion of this conservation tillage practice in- clude the mistrust of the growers, who traditionally use an intensive tillage system for this cash crop, and the uncertainty surrounding crop growth and yield responses [31]. The aim of this study was to analyze the effects of MT, compared to CT, on physical and hydrological soil prop- erties, with particular attention to soil surface compaction and soil water availability, with an analysis of the re- sponses of tobacco in terms of phenological development, biomass growth and yield. 2. Materials and Methods 2.1. Experimental Design and Tillage Treatments The experimental design was set up in four randomized blocks, with a total of eight replications for treatment (Fig- ure 1), in a level and pedologically homogeneous land. The plots, measuring 140 m2 (20 m × 7 m) each, were treated with two different soil tillage methods: MT and CT. Thanks to the uniformity of the chemical, physical and morphological properties of the soil in the experimental land, the extensive survey design, including large plots and many replications for treatment, and the meteoro- logical analysis of the growing season, it was possible to monitor the consequences on the soil and their effect on the plants due to the tillage treatments, minimizing the influence of the spatial and temporal variability and evaluating the interaction between environmental vari- ables and crop growth and development. The MT plots were left until transplanting with stand- ing stubble from the previous wheat crop (Triticum aes- tivum L.). They were tilled on the same day as the trans- plant with a rotating harrow (0.10 m deep) used to create the transplanting bed. The CT plots were tilled according to the traditional tillage management adopted by the farm: with deep ploughing (0.40 m) in the winter of 2007-2008, followed by a surface-disking tillage (0.10 m deep) in March and a rotating harrow (0.10 m deep) on the same day as the transplant. After the transplant the conven- tional operation of hoeing (0.05 m deep) and propping up were carried out for both treatments. 2.2. Experimental Site and General Conditions The study was conducted on a farm near Montepulciano Abbadia (Tuscany, Italy) (43˚08'37"N, 11˚49'58"E). The area is predominantly characterized by alluvial and col- luvial soils with a mild Mediterranean climate. Meteorological data concerning precipitation (P), mean (Tm) maximum (Tmax) and minimum (Tmin) air tem- peratures, maximum (U%max) and mean (U%m) relative Figure 1. Soil retention curve. air humidity, were monitored at standard weather stations situated near the experimental fields and acquired daily from the “A.R.S.I.A. Agrometeorological Information System” database. The monthly averages of each meteorological variable, potential evapotraspiration (ETp) and crop evapotra- spiration (ETc), were calculated from May to August 2008 and for a climatological base period of 12 years (from 1996 to 2007). The 2008 monthly averages were compared with the 12 years monthly averages to verify the climatic trend of the growth season and highlight any anomalies with respect to the climatological base period. ETp and ETc were calculated with the Priestley-Taylor method [32] and taking into account the FAO recom- mendations [33] for tobacco that consider a crop cycle length of 110 days and the following crop coefficients (Kc): during the initial stage 0.3 - 0.4 (20 days), 0.7 - 0.8 during the development stage (30 days), 1 - 1.2 during the mid-season stage (30 days), 0.8 during the late season stage (30 days). The ETc values were used to define the irrigation scheduling. Before the tillage, the soil of the experimental field was characterized via physical and chemical analyses according to the official methods [34,35]. Soil samples were collected using an auger: according to an X-shaped pattern, five soil sub-samples were col- lected in each plot at 0 - 0.10 m, 0.10 - 0.20 m and 0.20 - 0.30 m for physical characterization, and at 0 - 0.10 m, 0.20 - 0.30 m for chemical characterization. Soil pH was measured potentiometrically using an electronic pH meter (Intelligent pH Meter YK-2001PH, Lutron Electronic Enterprise Co., Taiwan) with a glass electrode in a 1:2.5 (mass fraction) suspension of air-dry soil (10 g, <2 mm) in deionised water (pH in H2O). Elec- trical conductivity (EC) was measured in a 1:5 air-dry soil in deionised water extracted with a conductivity probe (YK-200PCT, Lutron Electronic Enterprise Co., Taiwan). The calcium carbonate content (CaCO3) was Copyright © 2011 SciRes. AJPS  Growth and Development Responses of Tobacco (Nicotiana tabacum L.) to Changes in Physical and 336 Hydrological Soil Properties Due to Minimum Tillage determined using a Bernard calcimeter, quantifying the CO2 released when the sample was treated with hydro chloric acid under a constant pressure and temperature [36,37]. Total carbon and total nitrogen content was de- termined by dry combustion at 1000˚C and gas-chroma- tographic determination in an elementary Thermo Finni- gan Flash EA 1112 CHNS analyzer, from 5.0 ± 0.1 mg soil samples. The available phosphorus (P2O5) was ex- tracted using the NaHCO3 method [38], after which the P2O5 concentration in the extracts was determined col- orimetrically by the phospho-molybdate [39]. The ex- changeable potassium (K2O) was extracted using the NH4Ac method, and the K2O concentration was deter- mined by spectrophotometric analysis. The cation ex- change capacity (CEC) was determined using the trie- thanolamine-buffered BaC12 solution (c = 0.1 M) fol- lowed by a re-exchange with aqueous MgC12 solution (c = 0.1 M) [40,41]. The bulk density was determined by pouring the oven- dried soil (105˚C) into a 250 ml cylinder containing 100 ml of deionised water, and the texture was determined using the pipette method [42]. The soil water retention curve was derived with the Richard pressure plate extractor [43] meas- uring the gravimetric water contents (w in kg·ha–1) at –1, –20, –33, –100, –500, –1000 and –1500 kPa water potential values. The soil mass was measured after oven drying the samples (105˚C; 24 h) at all water potential values. The field capacity (FC), the wilting point (WP) and the Available Water Capacity (AWC) were determined with the Richard plate. FC is the drained upper limit and WP is the lower limit, both are equivalent to the amount of water retained by the soil respectively at a suction pressure of –33 kPa and –1500 kPa. The AWC is the difference between the water contents at WP and at FC. 2.3. Agricultural Practices The Virginia Bright tobacco was transplanted on 14 May 2008. The harvest was carried out at two different times according to maturation grade, evidenced by a yellow co- louring and curved bearing of the leaves, on the 85th and 106th days after transplant (DAT) for the basal leaves and median-apical leaves respectively. During the crop cycle, fertilization, weed control, irriga- tion and topping (removal of flower buds) were performed according to the traditional management adopted by the local farmers. Two topping operations were carried out on the 65th and 92nd DAT. The following fertilizers were dis- tributed: 200 kg·ha–1 of K2SO4 and 200 kg·ha–1 of Ca(H2PO4)2 in February, and 500 kg·ha–1 of a starter fertil- izer (5:10:15) in May. The weed control was carried out distributing 4 l ha–1 of a herbicide (a.p. glyphosate acid 36%) on 1 May and on 13 June. The plots were irrigated using a rain sprinkler irrigation system according to crop growth requirements. Irrigation was implemented when water depletion in the soil profile, owing to ETc, exceeded 40% of the AWC. This was calcu- lated for the transplanting and initial plant development at a depth of 0 - 0.15 m, and for the following plant develop- ment at a depth of 0 - 0.40 m, obtaining an irrigation water amount of 8 mm and 20 mm respectively. There were no irrigations in May and June, because the rainfall was suffi- cient for satisfying crop water requirements. During July and August five irrigations were necessary on the 58th, 66th, 75th, 85th, and 99th DAT. 2.4. Measurements of Soil Proprieties The relationships between the tillage treatments and the changes in physical and hydrological soil proprieties were monitored by measuring soil compaction and soil moisture levels. The samplings for moisture determination were carried out at a distance from rainy events or irrigations on three points per plot at three depths (0 - 0.10 m, 0.10 - 0.20 m, 0.20 - 0.30 m) using a Soil Core Sampler (cylinders with a diame- ter of 57 mm and length of 60 mm). Each sample was imme- diately sealed in hermetic plastic bags and then weighed to obtain the net fresh weight. The dry weights were taken after drying in the oven at 105˚C and the soil moisture was calcu- lated as percentage of dry weight. The soil compaction was detected using a penetrometer (range 0 - 59 N·cm–2) on two points per plot at three depths (0.10 m, 0.20 m, 0.30 m), and three measurements repetitions were performed for each one. The sampling times to detect the soil compaction and mois- ture are described in Table 1. Table 1. Timing of crop and soil surveys. Survey timeCrop surveys: plants per plot Soil surveys: points per plot (DAT) NDDP H M C 13 10 10 9 28 122 12 9 44 10 10 9 57 2 40 9 6 71 10 25 77 9 6 85 122 12 20 98 10 10 9 6 106 122 12 20 Timing of crop and soil surveys with indications respectively of sampled plants per plot and sampled points per plot. Legend: DAT = days after transplant, ND = non-destructive measurements, D = destructive measure- ments, P = phenological observations, H = measurements at harvest time, M = moisture measurements, C = compaction measurements. Copyright © 2011 SciRes. AJPS  Growth and Development Responses of Tobacco (Nicotiana tabacum L.) to Changes in Physical and Hydrological Soil Properties Due to Minimum Tillage Copyright © 2011 SciRes. AJPS 337 2.5. Measurements of Crop Growth and Development The crop growth and development were monitored on plants selected randomly from the central area of each plot. Meanwhile, the weeds, aphids or virus diffusion were monitored observing the possible differences be- tween the tillage treatments. During the crop cycle the following were carried out: non-destructive measurements for detecting stem height, leaf number and mean internode length (height/leaf nu- mber); destructive measurements for detecting area and dry weight of the leaves; phenological observations for monitoring the plants development stage. In addition, during the two harvest times, surveys were carried out to measure the number and dry weight of the mature leaves per plant. The leaf area was measured with an electronic planimeter (Delta-T, Dias II image analysis system, UK). The dry leaf weight was determined after drying in a ventilated oven at 50˚C. With the approaching flowering stage, a growing lack of phenological homogeneity was observed in the population: therefore, during the shift period from the vegetative to the reproductive stage, the phenological observations were extended to a larger number of individuals per plot. The times of all crop surveys and measurements are illustrated in Table 1. The growth stages suggested for tobacco by the CORESTA Guide (2009) [44] according to the BBCH scale [45] were grouped in several main development stages depending on the main tobacco growing periods reported by the FAO [33]. The CORESTA classification is founded on a universally-adopted extended BBCH scale for uniformly coding phenologically-similar growth stages of plants. The description of the phenological classification adopted in our research and its corre- sponding BBCH codes and FAO stages are illustrated in Table 2. Table 2. Description and coding of the phenologic al stages for tobacco. Adopted Classification FAO Classification BBCH Scale Code Stage Description Stage Length (days) Stage Value LD 1100 - 1105 E Initial I Early post-transplant stage. Less than 5 unfolded leaves, stem reaches less than 0.15 m. SE 3100 - 3101 LD 1106 - 1110 L Initial II Late post-transplant stage. 6 - 10 unfolded leaves, stem reaches less than 0.30 - 0.35 m. Initial 20 SE 3102 - 3103 LD 1111 - 1120 K Crop Development I First growth stage (“Knee high”). 11 - 20 unfolded leaves, steam reaches less than 0.55 - 0.6 m. SE 3104 - 3105 LD >1121 G Crop Development II Elongation and rapid growth stage. More than 21 unfolded leaves, steam reaches 1 m but there is no hint of reproductive organ formation. Development30 SE 3106 - 3109 BF Pre-flowering I Bud Formation. Apical bud swelling but with inflorescence not yet visible or only visible between the apical leaves. IE 50 - 51 BE Pre-flowering II Bud Emerging. Inflorescence emergence continuous till 1st co- rolla visible but still closed. IE 52 - 55 CF Pre-flowering III Close Flower. First petals visible but not yet open. Med-season30 IE 56 - 59 OF Flowering I Open Flower. From beginning of flowering, first petals open, to 50% of flowers open. FW 60 - 65 AF Flowering II Advanced Flowering. Continuous stage until more than 90% of flowers open Late season30 FW 66 - 69 Description and coding of the phenological stages observed for tobacco in the present study and compliance with the main growth stages suggested by the FAO and by BBCH classification of CORESTA. Legend: unfolded = leaves > 4 cm length, LD = leaf development, SE = stem elongation, IE = inflorescence emer- gence, FW = flowering. 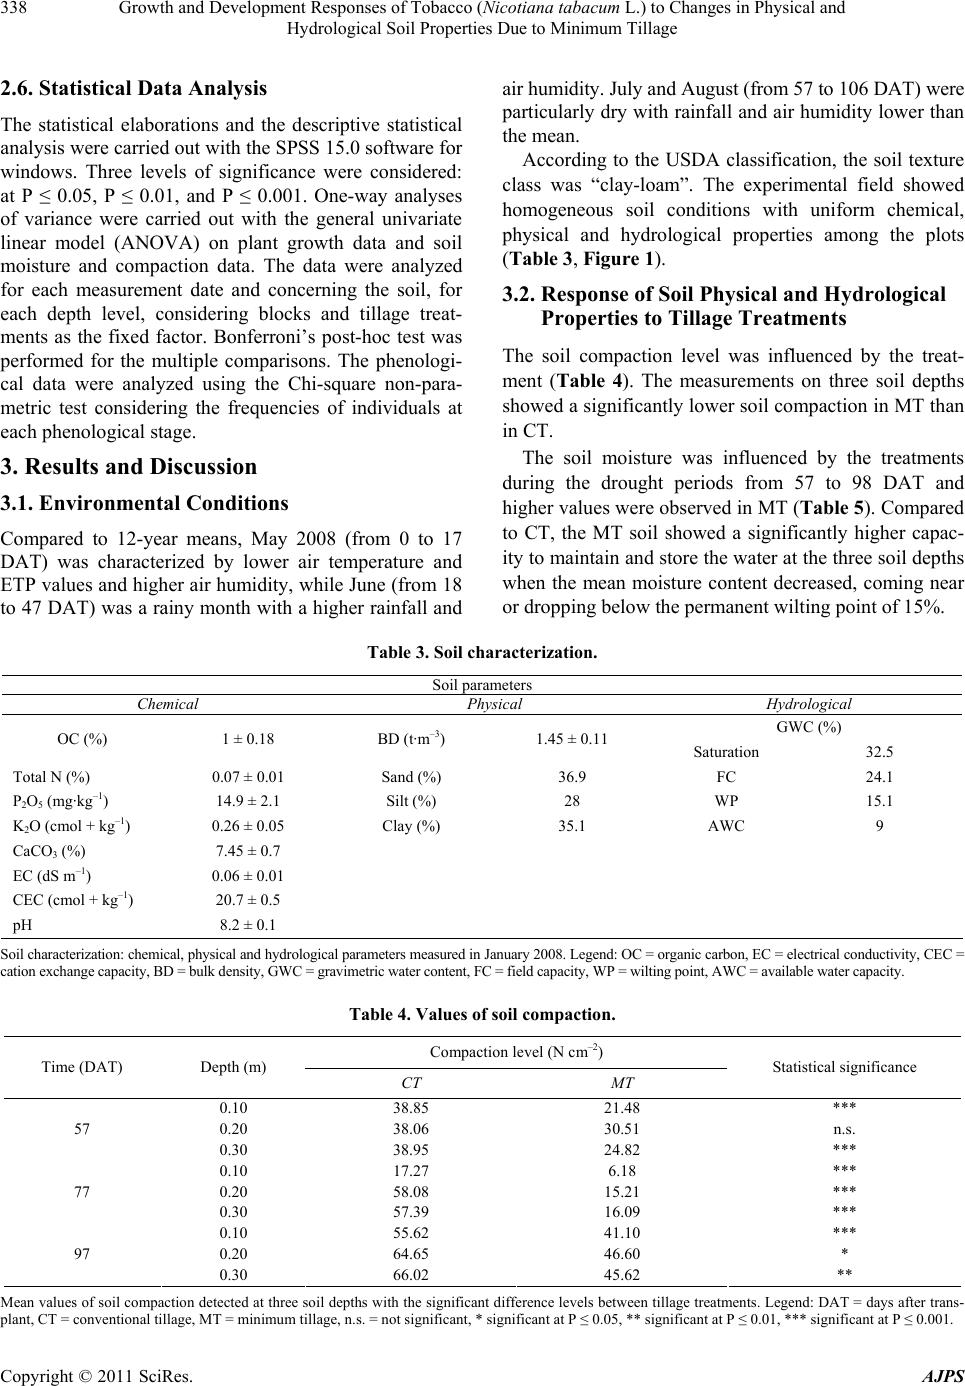 Growth and Development Responses of Tobacco (Nicotiana tabacum L.) to Changes in Physical and 338 Hydrological Soil Properties Due to Minimum Tillage 2.6. Statistical Data Analysis The statistical elaborations and the descriptive statistical analysis were carried out with the SPSS 15.0 software for windows. Three levels of significance were considered: at P ≤ 0.05, P ≤ 0.01, and P ≤ 0.001. One-way analyses of variance were carried out with the general univariate linear model (ANOVA) on plant growth data and soil moisture and compaction data. The data were analyzed for each measurement date and concerning the soil, for each depth level, considering blocks and tillage treat- ments as the fixed factor. Bonferroni’s post-hoc test was performed for the multiple comparisons. The phenologi- cal data were analyzed using the Chi-square non-para- metric test considering the frequencies of individuals at each phenological stage. 3. Results and Discussion 3.1. Environmental Conditions Compared to 12-year means, May 2008 (from 0 to 17 DAT) was characterized by lower air temperature and ETP values and higher air humidity, while June (from 18 to 47 DAT) was a rainy month with a higher rainfall and air humidity. July and August (from 57 to 106 DAT) were particularly dry with rainfall and air humidity lower than the mean. According to the USDA classification, the soil texture class was “clay-loam”. The experimental field showed homogeneous soil conditions with uniform chemical, physical and hydrological properties among the plots (Table 3, Figure 1). 3.2. Response of Soil Physical and Hydrological Properties to Tillage Treatments The soil compaction level was influenced by the treat- ment (Table 4). The measurements on three soil depths showed a significantly lower soil compaction in MT than in CT. The soil moisture was influenced by the treatments during the drought periods from 57 to 98 DAT and higher values were observed in MT (Table 5 ). Compared to CT, the MT soil showed a significantly higher capac- ity to maintain and store the water at the three soil depths when the mean moisture content decreased, coming near or dropping below the permanent wilting point of 15%. Table 3. Soil characterization. Soil parameters Chemical Physical Hydrological GWC (%) OC (%) 1 ± 0.18 BD (t·m–3) 1.45 ± 0.11 Saturation 32.5 Total N (%) 0.07 ± 0.01 Sand (%) 36.9 FC 24.1 P2O5 (mg·kg–1) 14.9 ± 2.1 Silt (%) 28 WP 15.1 K2O (cmol + kg–1) 0.26 ± 0.05 Clay (%) 35.1 AWC 9 CaCO3 (%) 7.45 ± 0.7 EC (dS m–1) 0.06 ± 0.01 CEC (cmol + kg–1) 20.7 ± 0.5 pH 8.2 ± 0.1 Soil characterization: chemical, physical and hydrological parameters measured in January 2008. Legend: OC = organic carbon, EC = electrical conductivity, CEC = cation exchange capacity, BD = bulk density, GWC = gravimetric water content, FC = field capacity, WP = wilting point, AWC = available water capacity. Table 4. Values of soil compaction. Compaction level (N cm–2) Time (DAT) Depth (m) CT MT Statistical significance 0.10 38.85 21.48 *** 0.20 38.06 30.51 n.s. 57 0.30 38.95 24.82 *** 0.10 17.27 6.18 *** 0.20 58.08 15.21 *** 77 0.30 57.39 16.09 *** 0.10 55.62 41.10 *** 0.20 64.65 46.60 * 97 0.30 66.02 45.62 ** Mean values of soil compaction detected at three soil depths with the significant difference levels between tillage treatments. Legend: DAT = days after trans- plant, CT = conventional tillage, MT = minimum tillage, n.s. = not significant, * significant at P ≤ 0.05, ** significant at P ≤ 0.01, *** significant at P ≤ 0.001. Copyright © 2011 SciRes. AJPS  Growth and Development Responses of Tobacco (Nicotiana tabacum L.) to Changes in Physical and 339 Hydrological Soil Properties Due to Minimum Tillage Table 5. Values of soil moisture. Soil moisture (%) Time (DAT) Depth (m) CT MT Statistical significance 0.10 15.85 15.76 n.s. 0.20 15.79 15.69 n.s. 13 0.30 15.61 16.13 n.s. 0.10 18.89 19.21 n.s. 0.20 18.89 20.02 n.s. 28 0.30 20.06 20.46 n.s. 0.10 17.33 18.57 n.s. 0.20 18.26 19.57 n.s. 44 0.30 18.92 19.37 n.s. 0.10 8.54 9.57 n.s. 0.20 10.48 11.73 *** 57 0.30 12.50 15.12 *** 0.10 9.38 13.71 *** 0.20 10.48 13.20 *** 77 0.30 10.54 13.28 *** 0.10 7.54 7.98 n.s. 0.20 8.29 9.22 n.s. 98 0.30 7.68 9.0 * Values of soil moisture detected at three soil depths with the significant difference levels between tillage treatments. Legend: DAT = days after transplant, CT = conventional tillage, MT = minimum tillage, n.s. = not significant, * significant at P ≤ 0.01, *** significant at P ≤ 0.001. The soil compaction results suggest that the CT was not able to create a stable structure and that its positive effects on the physical soil properties was annulled by the compression action due to wheel transit of the agri- cultural machines used to carry out the hoeing, propping up and topping during the crop growing season. Con- versely, the lower soil compaction values recorded with MT show that via the reduction of the soil disturbance level, this tillage practice could be able to improve the physical soil properties and structure stability, minimize- ing the negative consequences of the wheel transiting action. Moreover, the results pointed out that MT was able to improve the hydrological soil properties, furthering the moisture retention during the drought period. This may be due to the increased capacity to capture and store moisture compared to CT, depending on the changes in soil porosity during the second half of the crop cycle caused by agricultural traffic. 3.3. Crop Phenology During the vegetative phase, the crop showed homoge- neous phenological development and there were no sig- nificant differences between treatments. At 13 and 28 DAT all the plants were respectively in the early (E) and late (L) establishment stage. Similarly, at 44 DAT all the plants were in the first vegetative growth stage (K). In- stead, from the beginning of the reproductive phase the plantation showed a non-homogeneous phenological de- velopment with the simultaneous presence of plants at the vegetative growth, pre-flowering and flowering stages. At 57 and 71 DAT, significant differences were ob- served between the treatments (Table 6). Compared to CT, the plants in MT showed the tendency to delay the reproductive stage and prolong the vegetative growth stage with a lower frequency in the flowering stages (FC, FO) at 57 DAT, and a lower frequency in advanced flowering stage (FF) at 71 DAT. Conversely, after 99 DAT, there were no differences between the treatments and all the plants reached the reproductive phase, which led to the advanced flowering stage (FF). The shift period from vegetative to reproductive stage, between 57 and 77 DAT, coincided with the drought months characterized by a soil moisture content below or close to the permanent wilting point (Tables 3 and 5), so the flowering onset time and the duration of vegetative growth stage were probably influenced by the different soil moisture status due to the tillage treatment. In fact many studies showed how water deficit is able Copyright © 2011 SciRes. AJPS  Growth and Development Responses of Tobacco (Nicotiana tabacum L.) to Changes in Physical and 340 Hydrological Soil Properties Due to Minimum Tillage to modify the phenology, enhancing flowering and caus- ing an early switch of development from the vegetative to the reproductive stages in many horticultural, forestry and grain cultivations, including Rhododendron L. [46], Litchi chinensis Sonn. [47], Picea engelmanni Parry. [48], Pyrus communis L. [49], Citrus L. [50], Eriobotrya ja- ponica Thunb. [51], Triticum aestivum L. [52,53], Hor- deum vulgare L. [53], and Glycine max L. [54]. The results suggest that the higher soil moisture in MT, involving less water stress, was able to affect the phe- nological development of the crop, furthering vegetative growth thanks to the delay of flowering onset. The en- hancing of the vegetative growth during the drought pe- riod is a very important aspect for tobacco, a crop for which the leaves represent the main product. 3.4. Crop Growth and Production During the field surveys, no weed incidence differences were detected between the two tillage treatments. More- over, no attacks by aphids or virus were observed during the tobacco growing season. Therefore, from this point of view the plants with MT were not disadvantaged and the conventional treatments for the weed and pathogen con- trol were sufficient in both the MT and CT plots. During the non-destructive surveys, significant differ- ences were observed between the two treatments with regard to stem height, number of leaves and average in- ternode lengths (Table 7). In the first three surveys the plant growth appeared significantly improved by CT treatment: however, after 45 DAT, this tendency changed and the plant growth increased in MT. Table 6. Phenological stages frequencies. Frequency Time (DAT) Phenological Stage CT MT Statistical Significance G 88 146 *** BF 36 46 n.s. BE 135 121 n.s. FC 51 7 *** 57 FO 10 1 ** G 17 27 n.s. BF 4 12 * BE 3 11 * FC 16 11 n.s. FO 5 26 *** 71 FF 155 113 ** Frequencies of plants in the different phenological stages at 57 and 71 DAT with the significant difference levels between tillage treatments. Legend: DAT = days after transplant, CT = conventional tillage, MT = minimum tillage, G = II stage vegetative growth, BF = bud formation stage, BE = bud emerging stage, FC = closed flower stage, FO = open flower stage, FF = advanced flowering stage, n.s. = not significant, * significant at P ≤ 0.05, ** significant at P ≤ 0.01, *** significant at P ≤ 0.001. Table 7. Non-destructive surveys: growth parameters. Time (DAT) Stem height (cm) Statistical significance Leaves number Statistical significance Average internode length (cm) Statistical significance CT MT CT MT CT MT 13 8.60 7.9 ** 4.35 4.06 * 2.02 1.99 n.s. 28 23.35 20.56 *** 8.54 7.91 *** 2.76 2.62 ** 44 55.33 52.82 *** 13.21 12.45 ** 4.18 4.09 n.s. 71 109.71 130.78 *** 18.10 21.50 *** 6.10 6.12 n.s. 85 146.59 152.68 n.s. 22.35 21.56 n.s. 6.64 7.16 *** 99 109.00 122.78 *** 17.39 18.43 * 6.38 6.75 ** 106 112.23 126.69 *** 18.68 19.63 ** 6.05 6.49 *** Growth parameters measured during the non-destructive surveys with the significant difference levels between tillage treatments. Legend: DAT = days after transplant, CT = conventional tillage, MT = minimum tillage, n.s. = not significant, *, significant at P ≤ 0.05; **, significant at P ≤ 0.01; ***, significant at P ≤ 0.001. Copyright © 2011 SciRes. AJPS  Growth and Development Responses of Tobacco (Nicotiana tabacum L.) to Changes in Physical and 341 Hydrological Soil Properties Due to Minimum Tillage Table 8. Destructive surveys: growth parameters. Time (DAT) Stem height (cm) Leaf number Average internode length (cm) Leaf area (cm2) Dry leaf weight (g) CT MT CT MT CT MT CT MT CT MT 28 22.44 21.50 7.81 7.81 2.89 2.78 837.53 732.54 3.92 3.50 57 99.94 93.37 16.56 16.87 5.95 5.52 6885.75 7384.42 55.96 56.78 85 166.37 188.00 24.87 26.12 6.74 7.24 13342.78 16071.0 88.91 101.66 106 112.50 116.00 18.87 17.87 6.06 6.51 12945.17 15149.0 107.83 115.08 Mean growth parameters measured during the destructive surveys. Legend: DAT = days after transplant, CT = conventional tillage, MT = minimum tillage. Table 9. Yields. Yield (g/plant) Yield (leaf number/plant) Time (DAT) CT MT Statistical significance CT MT Statistical significance 83 19.06 20.92 * 3.85 4.26 ** 106 64.04 65.60 n.s. 10.41 11.07 n.s. Tobacco yields with the significant difference levels between tillage treatments. Legend: DAT = days after transplant; CT = conventional tillage; MT = mini- mum tillage; n.s. = not significant; *, significant at P ≤ 0.05; **, significant at P ≤ 0.01. During the destructive surveys, even though no sig- nificant differences were observed between the tillage treatments, the trend confirmed the results of the non- destructive surveys (Table 8). In fact, at the beginning (28 DAT), the CT plants showed higher values for all the growth parameters, while at 57 DAT the values of leaf area and dry weight were lower than those of MT, and after 85 DAT they showed lower values than MT for all the growth parameters. The plant yield data confirmed that plants in MT pro- duce a higher leaf number and dry weight than CT in both harvests, but the differences were only significant for the first one (Table 9). The results suggest that the impact of MT on physical and hydrological soil properties positively affected the vegetative growth and productivity of tobacco. With MT, the plants tended to have higher values for the measured growth and harvest parameters than with CT. It is also possible to suggest that by influencing the tobacco phenology with the prolongation of the growth stage, the MT improved the leaf production in the second half of life cycle. 4. Conclusions The adopting of MT on Nicotiana tobacco did not deter- mine significant differences in the crop harvests com- pared to CT, however it had a positive influence on the physical and hydrological soil properties and the phe- nological development of the plants, without any in- crease in the incidence of weeds. In fact, the results showed that MT is capable of improving the physical soil stability and soil water content, while delaying the flow- ering and prolonging the vegetative growth which bene- fits the leaf yield of tobacco, a crop that is highly suscep- tible to water stress. The tobacco production can benefit from the MT sys- tem firstly because, being a transplanted crop, it requires less tilled seedbeds than seed crops, and secondly, due to being an intensive cultivation system, conventional doses of chemical herbicides could suffice for containing the incidence of weeds without any changes to weed control management. MT may represent a valid means of reducing envi- ronmental impact and obtaining economic savings for tobacco cultivation. 5. Acknowledgements We express our gratitude to the Vessichelli Cosimo farm for its collaboration and ISMEA (Institute of Services for the Agricultural and Food Market) for its support. REFERENCES [1] G. Chisci and C. Zanchi, “The Influence of Different Tillage Systems and Different Crops on Soil Losses on Hilly Silty-Clayey Soil,” In: R. P. C. Morgan, Ed., Soil Conservation, Problems and Prospects, John Wiley & Sons, Inc., Hoboken, 1980, pp. 211-217. [2] W. Pansak, T. H. Hilger, G. Dercon, T. Kongkaew and G. Cadisch, “Changes in the Relationship between Soil Ero- sion and N Loss Pathways after Establishing Soil Con- servation System in Uplands of Northeast Thailand,” Ag- Copyright © 2011 SciRes. AJPS  Growth and Development Responses of Tobacco (Nicotiana tabacum L.) to Changes in Physical and 342 Hydrological Soil Properties Due to Minimum Tillage riculture, Ecosystems & Environment, Vol. 128, 2008, pp. 167-176. [3] J. N. Tullberg, P. J. Ziebarth and Y. Li, “Tillage and Traf- fic Effects on Runoff,” Australian Journal of Soil Re- search, Vol. 39, No. 2, 2001, pp. 249-257. doi:10.1071/SR00019 [4] N. Koga, H. Tsuruta, H. Tsuji and H. Nakano, “Fuel Consumption-Derived CO2 Emissions under Conven- tional and Reduced Tillage Cropping Systems in Northern Japan,” Agriculture, Ecosystems & Environment, Vol. 99, 2003, pp. 213-219. doi:10.1016/S0167-8809(03)00132-4 [5] M. L. Sanchez, M. I. Ozores, R. Colle, M. J. Lopez, B. De. Torre, M. A. Garcia and I. Perez, “Soil CO2 Fluxes in Cereal Land Use of the Spanish Plateau: Influence of Conventional and Reduced Tillage Practices,” Chemos- phere, Vol. 47, 2002, pp. 837-844. [6] C. H. Sijtsma, A. J. Campbell, N. B. McLaughlin and M. R. Carter, “Comparative Tillage Costs for Crop Rotations Utilizing Minimum Tillage on Farm Scale,” Soil and Tillage Research, Vol. 49, No. 3, 1998, pp. 223-231. doi:10.1016/S0167-1987(98)00175-5 [7] C. Cantero-Martinez, P. Angas and J. Lampurlanes, “Gr- owth, Yield and Water Productivity of Barley (Hordeum vulgare L.) Affected by Tillage and N Fertilization in Mediterranean Semiarid, Rainfed Conditions of Spain,” Field Crops Research, Vol. 84, No. 3, 2003, pp. 341-357. doi:10.1016/S0378-4290(03)00101-1 [8] D. Chatskikh, J. E. Olesen, E. M. Hansen, L. Elsgaard and B. M. Petersen, “Effects of Reduced Tillage on Net Greenhouse Gas Fluxes from Loamy Sand Soil under Winter Crops in Denmark,” Agriculture, Ecosystems & Environment, Vol. 128, No. 1-2, 2008, pp. 117-126. doi:10.1016/j.agee.2008.05.010 [9] S. De. Gryze, J. Six, H. Bossuyt, K. Van. Oost and R. Merckx, “The Relationship between Landform and the Distribution of Soil C, N, and P under Conventional and Minimum Tillage,” Geoderm a, Vol. 144, 2008, pp. 180-188. [10] K. P. Fabrizzi, F. O. Garcìa, J. L. Costa and L. I. Picone, “Soil Water Dynamics, Physical Properties and Corn and Wheat Responses to Minimum Tillage and No-Tillage Systems in the Southern Pampas of Argentina,” Soil and Tillage Research, Vol. 81, No. 1, 2005, pp. 57-69. doi:10.1016/j.still.2004.05.001 [11] C. Giordani., P. Sani and C. Zanchi, “Traditional Tillage versus Reduced Strip Tillage: Their Effects on Soil Moisture, Crop Production, Soil Erosion, Weeds Diffu- sion, and Economical Aspects,” Proceedings of the 3rd International Conference on Land Degradation: New Trends toward Global Sustainability, Rio De Janeiro, 17- 21 September 2001, p. 110. [12] K. Habtegebrial, B. R. Singh and M. Haile, “Impact of Tillage and Nitrogen Fertilization on Yield, Nitrogen Use Efficiency of Tef (Eragrostis Tef (Zucc.) Trotter) and Soil Properties,” Soil and Tillage Research, Vol. 94, No. 1, 2007, pp. 55-63. doi:10.1016/j.still.2006.07.002 [13] G. P. Lafond, W. E. May, F. C. Stevenson and D. A. Derksen, “Effects of Tillage Systems and Rotations on Crop Production for a Thin Black Chernozem in the Ca- nadian Prairies,” Soil and Tillage Research, Vol. 89, No. 2, 2006, pp. 232-245. doi:10.1016/j.still.2005.07.014 [14] G. A. Peterson, A. D. Halvorson, J. L. Havlin, O. R. Jones, D. J. Lyon and D. L. Tanaka, “Reduced Tillage and Increasing Cropping Intensity in the Great Plains Converses Soil C,” Soil and Tillage Research, Vol. 47, No. 3-4, 1998, pp. 207-218. doi:10.1016/S0167-1987(98)00107-X [15] K. D’Haene, J. Vermang, W. M. Cornelis, B. L. M. Leory, W. Schiettecatte, S. De. Neve, D. Gabriels and G. Hof- man, “Reduced Tillage Effects on Physical Properties of Silt Loam Soils Growing Root Crops,” Soil and Tillage Research, Vol. 99, 2008, pp. 279-290. [16] K. Areya, S. Sharma, R. M. Bajracharya and N. P. Rajbhandari, “Applications of Reduced Tillage in Hills of Central Nepal,” Soil and Tillage Research, Vol. 88, No. 1-2, 2006, pp. 16-29. doi:10.1016/j.still.2005.04.003 [17] K. Areya, S. Sharma, R. M. Bajracharya and N. P. Rajbhandari, “Developing a Sustainable Agro-System for Central Nepal Using Reduced Tillage and Straw Mulch- ing,” Journal of Environmental Management, Vol. 88, No. 3, 2008, pp. 547-555. doi:10.1016/j.jenvman.2007.03.017 [18] A. Berner, I. Hildermann, A. Fliebach, L. Pfiffner, U. Niggli and P. Mader, “Crop Yield and Soil Fertility Re- sponse to Reduced Tillage under Organic Management,” Soil and Tillage Research, Vol. 101, No. 1-2, 2008, pp. 89-96. doi:10.1016/j.still.2008.07.012 [19] X. Hao, C. Chang, R. L. Conner and P. Bergen, “Effect of Minimum Tillage and Crop Sequence on Crop Yield and Quality under Irrigation in Southern Alberta Clay Loam Soil,” Soil and Tillage Research, Vol. 59, No. 1-2, 2001, pp. 45-55. doi:10.1016/S0167-1987(00)00185-9 [20] J. L. Hernanz, V. S. Giron and C. Cerisola, “Long-Term Energy Use and Economic Evaluation of Three Tillage System for Cereal and Legume Production in Central Spain,” Soil and Tillage Research, Vol. 35, No. 4, 1995, pp. 183-198. doi:10.1016/0167-1987(95)00490-4 [21] D. B. Ishaya, P. Tunku and N. C. Kuchinda, “Evaluation of Some Weed Control Treatments for Long Season Weed Control in Maize (Zea Mays L.) under Zero and Minimum Tillage at Samaru, in Nigeria,” Crop Protec- tion, Vol. 27, 2008, pp. 1047-1051. [22] S. K. Jalota, G. S. Buttar, A. Sood, G. B. S. Chahal, S. S. Ray and S. Panigrahy, “Effects of Sowing Date, Tillage and Residue Management on Productivity of Cotton (Gossypium hirsutum L.) - Wheat (Triticum aestivum L.) System in Northwest India,” Soil and Tillage Research, Vol. 99, No. 1, 2008, pp. 76-83. doi:10.1016/j.still.2008.01.005 [23] B. Tulema, J. B. Aune, F. H. Johnsen and B. Vanlauwe, “The Prospects of Reduced Tillage in Tef (Eragrotis tef Zucca) in Gare Arera, West Shawa Zone of Oromiya, Ethiopia,” Soil and Tillage Research, Vol. 99, No. 1, 2008, pp. 58-65. doi:10.1016/j.still.2007.12.001 Copyright © 2011 SciRes. AJPS  Growth and Development Responses of Tobacco (Nicotiana tabacum L.) to Changes in Physical and 343 Hydrological Soil Properties Due to Minimum Tillage [24] R. çakir and U. çebi, “Growth and Dry Matter Accumula- tion Dynamics off Flue-Cured Tobacco under Different Soil Moisture Regimes,” Journal of Agronomy, Vol. 5, 2006, pp. 78-86. [25] B. F. Clough and F. L. Milthorpe, “Effects of Water Deficit on Leaf Development in Tobacco,” Australian Journal of Plant Physiology, Vol. 2, No. 3, 1975, pp. 291-300. doi:10.1071/PP9750291 [26] J. M. Hopkinson, “Effects of Early Drought and Trans- planting on the Subsequent Development of the Tobacco Plant,” Australian Journal of Agricultural Research, Vol. 19, No. 1, 1968, pp. 47-57. doi:10.1071/AR9680047 [27] B. L. Benham, D. H. Vaughan, M. K. Laird, B. B. Ross and D. R. Peek, “Surface Water Quality Impacts of Con- servation Tillage Practices on Burley Tobacco Production Systems in Southwest Virginia,” Water, Air & Soil Pollu- tion, Vol. 179, No. 1-4, 2007, pp. 159-166. doi:10.1007/s11270-006-9221-z [28] L. Fisher, “Potential for Reduced Tillage Tobacco Pro- duction in North Carolina,” Proceedings of the 26th Southern Conservation Tillage Conference for Sustain- able Agriculture, North Carolina, 8-9 June 2004, Technical Bulletin (TB), No. 321, pp. 161-162. [29] D. G. Shilling, A. D. Worsham and D. A. Danehower, “Influence of Mulch, Tillage and Diphenamid on Weed Control, Yield and Quality in No-Till Flue-Cured To- bacco (Nicotiana tabcum),” Weed Science, Vol. 34, 1986, pp. 738-744. [30] D. C. Yoder, T. L. Cope, J. B. Wills and H. P. Denton, “No-Till Transplanting of Vegetables and Tobacco to Reduce Erosion and Nutrient Surface Runoff,” Journal of Soil and Water Conservation, Vol. 60, No. 2, 2005, pp. 68-72. [31] B. Pearce and G. Schwab, “Field Selection, Tillage and Fertilization,” In: K. Seebold and B. Pearce, Eds., Ken- tucky Tobacco Production Guide, Publishers of Univer- sity of Kentucky, Lexington, 2008, pp. 23-25. [32] C. H. B. Priestley and R. J. Taylor, “On the Assessment of Surface Heat Flux and Evaporation Using Large-Scale Parameters,” Monthly Weather Review, Vol. 100, 1972, pp. 81-92. doi:10.1175/1520-0493(1972)100<0081:OTAOSH>2.3.C O;2 [33] J. Doorenbos and A. H. Kassam, “Yield Response to Water,” FAO Irrigation and Drainage Paper 33, Food and Agriculture Organization of the United Nations, Rome, 1986. [34] Italian Ministry of Agricultural, Food and Forestry- Policies (MIPAAF), “Metodi Ufficiali Di Analisi Fisica Del Suolo, Ministerial Decree of 01/08/97,” Official Ga- zette―Ordinary Supplement, No. 204, 2 September 1997. [35] Italian Ministry of Agricultural, Food and Forestry Poli- cies (MIPAAF), “MetodiUfficiali Di AnalisiChimica Del Suolo, Ministerial Decree of 13/09/99,” Official Ga- zette―Ordinary Supplement, No. 248, 21 October 1999. [36] J. D. Milliman, “Marine Carbonates. Recent Sedimentary Carbonates Part 1,” 14th Edition, Springer-Verlag, New York, 1974. [37] G. Muller and M. Gatsner, “Chemical Analysis,” Neues Jahrbuch fur Mineralogie-Monatshefte, Vol. 10, 1971, pp. 466-469. [38] S. R. Olsen, C. V. Cole, F. S. Watanabe and L. A. Dean, “Methods of Soil Analysis: Physical Properties, Part 1,” In: A. Klute, Ed., Agronomy Monograph No. 9, ASA and SSSA, Madison, 1954, pp. 403-430. [39] J. Murphy and J. P. Riley, “A Modified Single Solution Method for the Determination of Phosphate in Natural Waters,” Analytica Chimica Acta, Vol. 27, 1962, pp. 31-36. doi:10.1016/S0003-2670(00)88444-5 [40] C. L. Bascomb, “Rapid Method for the Determination of the Cation Exchange Capacity of Calcareous and Non-Calcareous Soils,” Journal of the Science of Food and Agriculture, Vol. 15, No. 12, 1964, pp. 821-823. doi:10.1002/jsfa.2740151201 [41] A. Mehlich, “Determination of Cation and Anion Exchange Properties of Soils,” Soil Science, Vol. 66, No. 6, 1948, pp. 429-445. doi:10.1097/00010694-194812000-00004 [42] G. W. Gee and J. W. Bauder, “Particle-Size Analysis,” In: A. Klute, Ed., Methods of Soil Analysis: Part 1. Agron- omy Monograph No. 9, ASA, Madison, 1986. [43] L. A. Richards and M. Fireman, “Pressure-Plate Apparatus for Measuring Moisture Sorption and Transmission by Soils,” Soil Science, Vol. 56, No. 6, 1943, pp. 395-404. doi:10.1097/00010694-194312000-00001 [44] Cooperation Centre for Scientific Research Relative to Tobacco (CORESTA), “A Scale for Coding Growth Stages in Tobacco Crops,” CORESTA Guide N˚7, Feb- ruary 2009. [45] U. Meier, “Growth Stage of Mono- and Dicotyledonous plants,” 2nd Edition, Federal Biological Research Centre for Agriculture and Forestry, Braunschweig, 2001. [46] R. G. Sharp, M. A. Else, R. W. Cameron and W. J. Da- vies, “Water Deficits Promote Flowering in Rhododen- dron via Regulation of Pre and Post Initiation Develop- ment,” Scientia Horticulturae, Vol. 120, No. 4, 2009, pp. 511-517. doi:10.1016/j.scienta.2008.12.008 [47] R. A. Stern, I. Adato, M. Goren, D. Eisenstein and S. Gazit, “Effects of Autumnal Water Stress on Litchi Flowering and Yield in Israel,” Scientia Horticulturae, Vol. 54, No. 4, 1993, pp. 295-302. doi:10.1016/0304-4238(93)90108-3 [48] S. D. Ross, “Promotion of Flowering in Potted Picea Engelmanni Grafts Effects of Heat Drought Gibberellin A 4-7 and Their Timing,” Canadian Journal of Forest Re- search, Vol. 15, No. 4, 1986, pp. 618-624. doi:10.1139/x85-101 [49] P. D. Mitchell, D. J. Chalmers, P. H. Jerie and G. Burge, “The Use of Initial Withholding of Irrigation and Tree Spacing to Enhance the Effect of Regulated Deficit Irri- gation on Pear Trees,” Journal of the American Society for Horticultural Science, Vol. 111, 1986, pp. 858-861. Copyright © 2011 SciRes. AJPS  Growth and Development Responses of Tobacco (Nicotiana tabacum L.) to Changes in Physical and Hydrological Soil Properties Due to Minimum Tillage Copyright © 2011 SciRes. AJPS 344 [50] A. J. Krajewski and E. Rabe, “Citrus Flowering: A Criti- cal Evaluation,” Journal of Horticultural Science, Vol. 70, 1995, pp. 357-374. [51] J. Cuevas, V. Pinillos, M. L. Caete, M. Gonzlez, F. Alonso, M. D. Fernandez and J. J. Hueso, “Optimal Lev- els of Postharvest Deficit Irrigation for Promoting Early Flowering and Harvest Dates in Loquat (Eriobotrya Ja- ponica Lindl.),” Agricultural Water Management, Vol. 96, No. 5, 2009, pp. 831-838. doi:10.1016/j.agwat.2008.11.002 [52] F. Ewert, D. Rodriguez, P. Jamieson, M. A. Semenov, R. A. C. Mitchell, J. Goudriaan, J. R. Porter, B. A. Kimball, P. J. Pinter Jr., R. Manderscheid, H. J. Weigel, A. Fang- meier, E. Fereres and F. Villalobos, “Effects of Elevated CO2 and Drought on Wheat: Testing Crop Simulation Models for Different Experimental and Climatic Condi- tions,” Agriculture, Ecosystems & Environment, Vol. 93, No. 1-3, 2002, pp. 249-266. doi:10.1016/S0167-8809(01)00352-8 [53] G. S. Mc Master and W. W. Wilhem, “Phenological Re- sponses of Wheat and Barley to Water and Temperature: Improving Simulation Models,” The Journal of Agricul- tural Science, Vol. 141, No. 2, 2003, pp.129-147. doi:10.1017/S0021859603003460 [54] D. Desclaux and P. Roumet, “Impact of Drought Stress on the Phenology of Two Soybean (Glycine Max L. Merr) Cultivars,” Field Crops Research, Vol. 46, No. 1-3, 1996, pp. 61-70. doi:10.1016/0378-4290(95)00086-0
|