 American Journal of Plant Sciences, 2011, 2, 287-296 doi:10.4236/ajps.2011.23032 Published Online September 2011 (http://www.SciRP.org/journal/ajps) Copyright © 2011 SciRes. AJPS 287 Gross Chemical Profile and Calculation of Nitrogen-to-Protein Conversion Factors for Five Tropical Seaweeds Graciela S. Diniz1,3, Elisabete Barbarino1, João Oiano-Neto2, Sidney Pacheco2, Sergio O. Lourenço1* 1Departamento de Biologia Marinha, Universidade Federal Fluminense, Niterói, Brazil; 2Laboratório de Cromatografia Líquida, Embrapa Agroindústria de Alimentos, Rio de Janeiro, Brazil; 3Instituto Virtual Internacional de Mudanças Globais, Universidade Federal do Rio de Janeiro—UFRJ/IVIG, Rio de Janeiro, Brazil. Email: *sergio.lourenco@pq.cnpq.br Received March 6th, 2011; revised April 22nd, 2011; accepted June 28th, 2011. ABSTRACT Despite decades of research on marine algae, there are still significant gaps in basic knowledge about chemical com- position of these organisms, especially in tropical environments. In this study, the amino acid composition and contents of total nitrogen, phosphorus, lipid, carbohydrate and protein were determined in Asparagopsis taxiformis, Centro- ceras clavulatum, Chaetomorpha aerea, Sargassum filipendula and Spyridia hypnoides. The seaweeds showed low lipid contents (lower than 5.5% d.w. in all species) and were rich in carbohydrates (more than 16% d.w. in all sea- weeds). The percentage of nitrogen, phosphorus and protein varied widely among species, which red algae showed the highest concentrations. The amino acid composition was similar among the seaweeds, which glutamic acid, aspartic acid and leucine as the most abundant. All species are poor in histidine. An average of 24.2% of the total nitrogen is non-proteinaceous. From data of total amino acid and total nitrogen, specific nitrogen-to-protein conversion factors were calculated for each species. The nitrogen-to-protein conversion factors calculated ranged from 4.51 to 5.21, with an overall average of 4.86. These findings show that the traditional conversion factor of 6.25 should be avoided for seaweeds, since it overestimates the actual protein content. Keywords: Nitrogen-to-Protein Conversion Factors, Protein, Amino Acid, Seaweeds, Element Composition, Tropical Environment 1. Introduction Utilization of algae has increased considerably over the past years as a consequence of growth of research in various fields [1]. Because seaweed species are rich in beneficial nutrients, in countries such as China, Japan and Korea, they have been commonly utilized in human nutrition for centuries [2]. They have been found to be good sources of vitamins, carbohydrates, minerals and proteins [3], but show wide variations among species. Seaweeds have been increasingly viewed as potential sources of bioactive compounds with immense pharma- ceutical, biomedical and nutraceutical importance [4]. Moreover, they have been used in agricultural and indus- trial research due to their high content of carbohydrates, proteins, vitamins, and minerals [5], but show wide vari- ations among species. However, data on the bioavailabil- ity of these components are limited. Protein data of marine algae presents many applica- tions, involving both basic and applied research. How- ever, comparisons of protein content among species are difficult because of methodological differences [6,7]. Extraction is one of the main problems in algal protein analysis, which is performed with variable efficiency by different methods [8]. Differences in algae cell wall composition and in procedures used for protein extrac- tion establish remarkable influence on final results [9]. The most common methods used for protein determi- nation in algae, Lowry’s method [10] and Bradford method [11] assays, are subject to interferences from many factors [12], which are independent of the prob- lems related to the protein extraction. The interferences are a consequence of the effects of some substances on specific amino acids, since that the chemical reactions which produce the protein quantification depends on the reactivity of the amino acid side groups [13].  Gross Chemical Profile and Calculation of Nitrogen-to-Protein Conversion Factors for Five Tropical Seaweeds 288 By contrast, total nitrogen analysis is relatively simple and easy to perform, and nitrogen-to-protein conversion factors (N-Prot factors) can be used to estimate crude protein content. The use of N-Prot factors to determine protein content has some important advantages if com- pared to other methodologies. Total nitrogen analysis, carried out by Kjeldhal’s method [14], Hach techniques [15] or CHN analysis, eliminates the necessity of ex- tracting the protein content of the sample to be analyzed, the major problem in protein analysis of algae [8]. Bar- barino and Lourenço (2005) [7] showed that algal pro- teins associated with cell membranes are hardly extracted, confirming the difficulty of reproducing extraction figures and increasing differences in values found with different methods. Thus, the use of N-Prot factors also allows bet- ter comparisons of results among researchers, since pro- tein is estimated without a tricky previous extraction. The use of specific N-Prot factors is widely recom- mended in order to get more accurate estimates of protein content [16]. The nitrogen:protein ratio does vary ac- cording to the source considered [17]. The use of N-Prot factors is particularly wide in food science. Except for a list of specific N-Prot factors available for certain cereals (e.g. 5.26 for rise, 5.47 for wheat; [18]), legumes (e.g. 4.75 - 5.87 for cassava root; [19]), mushroom (4.70; [20]), Cheddar cheese (6.38; [21]) and milk (5.94, [22]) among other products, the factor 6.25 calculated by reference [23] is still used for most plant and animal sources. The use of the traditional factor 6.25 is based on the assump- tion that samples contain protein with 16% nitrogen and an insignificant amount of non-protein nitrogen (NPN) [24]. However, the amino acid composition varies from one protein source to another, existing different N con- tent in each amino acid. Moreover, this assumption is invalid for organisms that contain high concentrations of other nitrogenous compounds, such as nucleic acids, amines, urea, inorganic intracellular nitrogen (ammo- nium, nitrate and nitrite), vitamins and alkaloids [25]. Plant materials, fungi and algae commonly show sig- nificant amounts of NPN [7,20,26]. In addition, it is common to find plant materials showing total protein with less than 16% nitrogen in total amino acid [27]. The same trends may be applied to the nitrogen distribution in seaweeds, and the use of the factor 6.25 tends to overes- timate the protein data [28,29]. Despite this, several au- thors continue to use the factor 6.25 to estimate seaweed protein content (e.g. [30-33]). To compensate the influence of NPN, specific N-Prot factors must be calculated. Specific N-Prot factors have already been proposed for 12 marine microalgae [34], with an overall average N-Prot factor of 4.78. Studies in this field are needed for seaweeds, since very limited information is available (e.g. [28,29]). In a broader sense, data on chemical composition of seaweeds are predominantly obtained with species from temperate (e.g. [28,35,36]), warm temperate (e.g. [37,38]) and subtropical coastal environments (e.g. [39-41]). By comparison, information on chemical composition of algae from tropical environments is relatively scarce [42-44] and more data are needed from those regions. Compared with land plants, the chemical composition of seaweeds has been poorly investigated and most of the available information only deals with traditional edible seaweeds [32,45,46]. The purpose of our study was to determine specific N- Prot factors for five tropical marine seaweeds, based on the ratio of amino acid composition to total nitrogen (TN) content. In addition, we also characterized and compared the seaweed species regarding hydrosoluble protein, car- bohydrate, lipid, nitrogen and phosphorus contents. 2. Materials and Methods 2.1. Algae In this study five macroalgae species were analyzed. The identification of the species was carried out following the checklist of reference [47] and with experts’ supervision. Chlorophyta: Chaetomorpha aerea (Dillwyn) Kützing; Rhodophyta: Asparagopsis taxiformis (Delile) Trevisan de Saint-Léon; Spyridia hypnoides (Bory de Saint-Vincent) Papenfuss; and Centroceras clavulatum (C. Agardh) Mon- tagne; Ochrophyta: Sargassum filipendula (Agardh). 2.2. Sampling C. aerea, C. clavulatum and S. filipendula were collected in June 2007 and S. hypnoides was collected in September 2007 at Arraial do Cabo (22˚57'S 42˚01'W). A. taxiformis was sampled in June 2007 at Angra dos Reis (23˚00'S 44˚19'W). Both sites are located in Rio de Janeiro State, southeastern Brazil (Figure 1) and show oligotrophic characteristics and minor anthropic influence. Whole thalli of adult plants were collected and washed in the field with local seawater in order to remove epiphytes, sediment and organic matter. Plants were packed in plas- tic bags and kept on ice until returned to the laboratory (ca. 150 km, Figure 1). In the laboratory samples were gently brushed under running seawater, rinsed with dis- tilled water, dried with paper tissue and frozen at –18˚C. Subsequently, the samples were freeze dried in a Terroni Fauvel, model LB1500TT device. The dried material was powdered manually using a mortar and pestle, and it was kept in desiccators containing silica-gel, under vacuum at room temperature, until the chemical analyses were car- ried out. 2.3. Tissue Analysis The Lowry’s method [10] was used to analyze hydro- Copyright © 2011 SciRes. AJPS 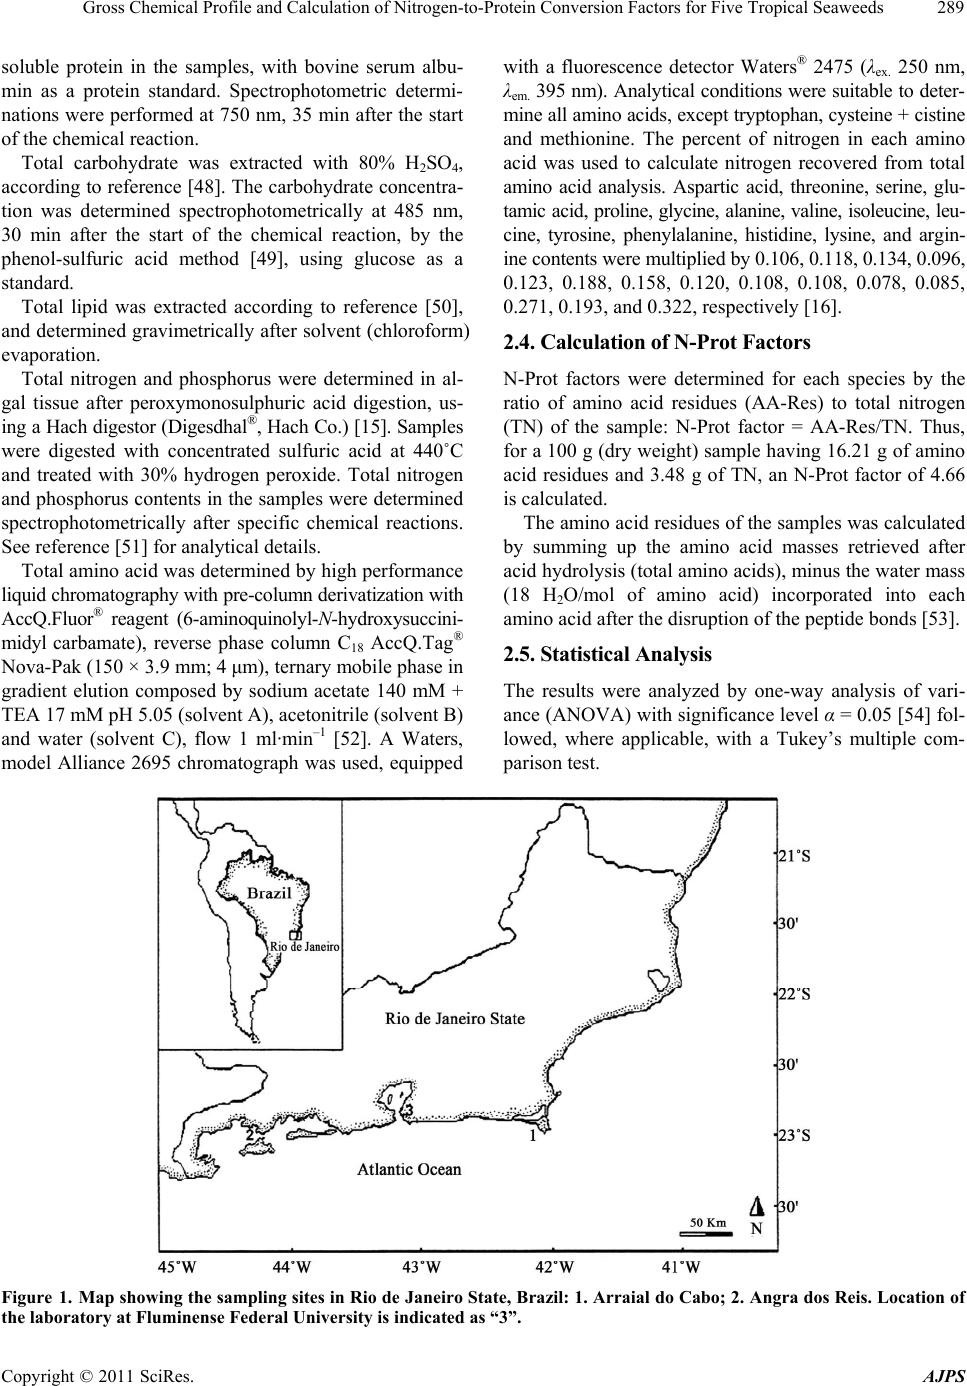 Gross Chemical Profile and Calculation of Nitrogen-to-Protein Conversion Factors for Five Tropical Seaweeds Copyright © 2011 SciRes. AJPS 289 soluble protein in the samples, with bovine serum albu- min as a protein standard. Spectrophotometric determi- nations were performed at 750 nm, 35 min after the start of the chemical reaction. Total carbohydrate was extracted with 80% H2SO4, according to reference [48]. The carbohydrate concentra- tion was determined spectrophotometrically at 485 nm, 30 min after the start of the chemical reaction, by the phenol-sulfuric acid method [49], using glucose as a standard. Total lipid was extracted according to reference [50], and determined gravimetrically after solvent (chloroform) evaporation. Total nitrogen and phosphorus were determined in al- gal tissue after peroxymonosulphuric acid digestion, us- ing a Hach digestor (Digesdhal®, Hach Co.) [15]. Samples were digested with concentrated sulfuric acid at 440˚C and treated with 30% hydrogen peroxide. Total nitrogen and phosphorus contents in the samples were determined spectrophotometrically after specific chemical reactions. See reference [51] for analytical details. Total amino acid was determined by high performance liquid chromatography with pre-column derivatization with AccQ.Fluor® reagent (6-aminoquinolyl-N-hydroxysuccini- midyl carbamate), reverse phase column C18 AccQ.Tag® Nova-Pak (150 × 3.9 mm; 4 μm), ternary mobile phase in gradient elution composed by sodium acetate 140 mM + TEA 17 mM pH 5.05 (solvent A), acetonitrile (solvent B) and water (solvent C), flow 1 ml·min–1 [52]. A Waters, model Alliance 2695 chromatograph was used, equipped with a fluorescence detector Waters® 2475 (λex. 250 nm, λem. 395 nm). Analytical conditions were suitable to deter- mine all amino acids, except tryptophan, cysteine + cistine and methionine. The percent of nitrogen in each amino acid was used to calculate nitrogen recovered from total amino acid analysis. Aspartic acid, threonine, serine, glu- tamic acid, proline, glycine, alanine, valine, isoleucine, leu- cine, tyrosine, phenylalanine, histidine, lysine, and argin- ine contents were multiplied by 0.106, 0.118, 0.134, 0.096, 0.123, 0.188, 0.158, 0.120, 0.108, 0.108, 0.078, 0.085, 0.271, 0.193, and 0.322, respectively [16]. 2.4. Calculation of N-Prot Factors N-Prot factors were determined for each species by the ratio of amino acid residues (AA-Res) to total nitrogen (TN) of the sample: N-Prot factor = AA-Res/TN. Thus, for a 100 g (dry weight) sample having 16.21 g of amino acid residues and 3.48 g of TN, an N-Prot factor of 4.66 is calculated. The amino acid residues of the samples was calculated by summing up the amino acid masses retrieved after acid hydrolysis (total amino acids), minus the water mass (18 H2O/mol of amino acid) incorporated into each amino acid after the disruption of the peptide bonds [53]. 2.5. Statistical Analysis The results were analyzed by one-way analysis of vari- ance (ANOVA) with significance level α = 0.05 [54] fol- lowed, where applicable, with a Tukey’s multiple com- parison test. Figure 1. Map showing the sampling sites in Rio de Janeiro State, Brazil: 1. Arraial do Cabo; 2. Angra dos Reis. Location of the laboratory at Fluminense Federal University is indicated as “3”.  Gross Chemical Profile and Calculation of Nitrogen-to-Protein Conversion Factors for Five Tropical Seaweeds 290 3. Results The hydrosoluble protein contents ranged from 8.7% (S. filipendula, brown alga) to 16.1% (C. aerea, green alga) of the dry weight with intermediate and similar concen- trations (p > 0.05) in red algae (Table 1). Carbohydrates were the most abundant substances measured in all spe- cies, ranged from 16.8% (S. filipendula) to 29.4% (C. aerea) of the d.w. The values tended to be higher and similar in green and red algae, except for the rhodophyte A. taxi- formis, which was significantly lower than the other three species (p < 0.001). All species studied contained low concentration of total lipid. The highest value was re- corded in C. aerea (5.5%, d.w.) and the lowest concen- tration was found in C. clavulatum (2.8%). The red algae S. hypnoides and A. taxiformis showed significantly higher lipid concentration than C. clavulatum (p < 0.001) (Ta- ble 1). The percentage of nitrogen showed wide variations among species, ranging from 1.75% (S. filipendula) to 5.56% (A. taxiformis) of the dry weight. Red algae showed higher total nitrogen concentrations in the thalli, with significant differences (p < 0.001) to others groups (Ta- ble 1). The green alga C. aerea showed an intermediate concentration of N in comparison to red and brown algae. The concentrations of phosphorus also varied widely among species. C. clavulatum showed the highest value (0.54%, p < 0.001) and S. filipendula and A. taxiformis showed the lowest concentrations (0.27% and 0.30%, respectively) (p > 0.05). The green C. aerea and red al- gae S. hypnoides showed intermediate and similar values (Table 1). The tissue N:P ratios were low for all species (N:P < 11:1), except for A. taxiformis, which showed the highest N:P ratio (18.9:1, p < 0.001), significantly higher than the other red algae. The lowest N:P ratios were re- corded in the green and brown algae analyzed (5.83:1 and 6.56:1, respectively). The amino acid profiles of seaweeds samples are pre- sented in Table 2. Glutamic acid was the most abundant amino acid in all species studied. The highest concentra- tion of glutamic acid (16.3% of total amino acids) was found in S. filipendula, while A. taxiformis had the low- est (10.3%) concentrations. Aspartic acid was the second most abundant amino acid in seaweeds. These values varied from 9.59% (A. taxiformis) to 12.7% (C. aerea). The percentage of histidine was the lowest in all species, and only the brown algae S. filipendula achieved values close to 2%. The red alga A. taxiformis showed higher concentrations of valine, phenylalanine and arginine than the others species studied. The highest concentrations of tyrosine were observed in the red algae S. hypnoides and C. clavulatum with values close to 5%. Percentages of leucine and threonine were similar among all species and the lowest concentrations of glycine were observed in red algae S. hypnoides. The total protein content of the samples is showed in Table 3 as total amino acid residues. The seaweeds showed a wide range of total protein concentration, varying from 8.62% (S. filipendula) to 25.1% (A. taxiformis) of the d.w. The red algae recorded the highest values of total protein. Nitrogen mass within total amino acid ranged from 1.36% (S. filipendula) to 4.14% (A. taxiformis). The rela- tive percentage of protein nitrogen was estimated as the ratio of nitrogen recovered from amino acid to total ni- trogen (Table 1). Protein nitrogen ranged from 69.5% (C. clavulatum) to 81% (S. hypnoides) and the red algae tended to show higher percentages of NPN, except S. hypnoides. From the ratio of the mass of amino acid residues to total nitrogen we calculated specific N-Prot factors for the seaweeds. The N-Prot factors ranged between 4.51 (A. taxiformis) to 5.21 (S. hypnoides). The others three spe- cies recorded intermediate values of N-Prot factors. An overall average N-Prot factor = 4.86 was calculated from the data for all species. Table 1. Gross chemical composition of five species of seaweeds sampled in a tropical site of Brazil. Values are expressed as percentage of the dry mass and represent the mean of four replicates ± standard deviation (n = 4)#. Species Hydrosoluble protein Total carbohydrate Total lipid Total nitrogen Total phosphorus N:P ration (by atoms) *** *** *** *** *** *** Asparagopsis taxiformis 11.7 ± 0.58b 22.9 ± 1.35b 4.80 ± 0.24b 5.56 ± 0.29a 0.30 ± 0.04c 18.9 ± 1.66a Centroceras clavulatum 11.3 ± 0.64b 27.1 ± 1.73ª 2.78 ± 0.23d 4.63 ± 0.15b 0.54 ± 0.03a 8.55 ± 0.22b Chaetomorpha aerea 16.1 ± 0.25a 29.4 ± 0.78ª 5.49 ± 0.09ª 2.56 ± 0.13d 0.43 ± 0.04b 5.83 ± 0.16c Sargassum filipendula 8.72 ± 0.54c 16.8 ± 0.97c 2.92 ± 0.13d 1.75 ± 0.03e 0.27 ± 0.02c 6.56 ± 0.41c Spyridia hypnoides 10.7 ± 0.92b 27.7 ± 1.47ª 4.20 ± 0.36c 3.98 ± 0.14c 0.39 ± 0.02b 10.3 ± 0.85b #Mean values significantly different: ***p < 0.001, a > b > c > d > e. Identical superscript letters (a, a; b, b) or absence of letters indicate that mean values are not significantly different. Copyright © 2011 SciRes. AJPS 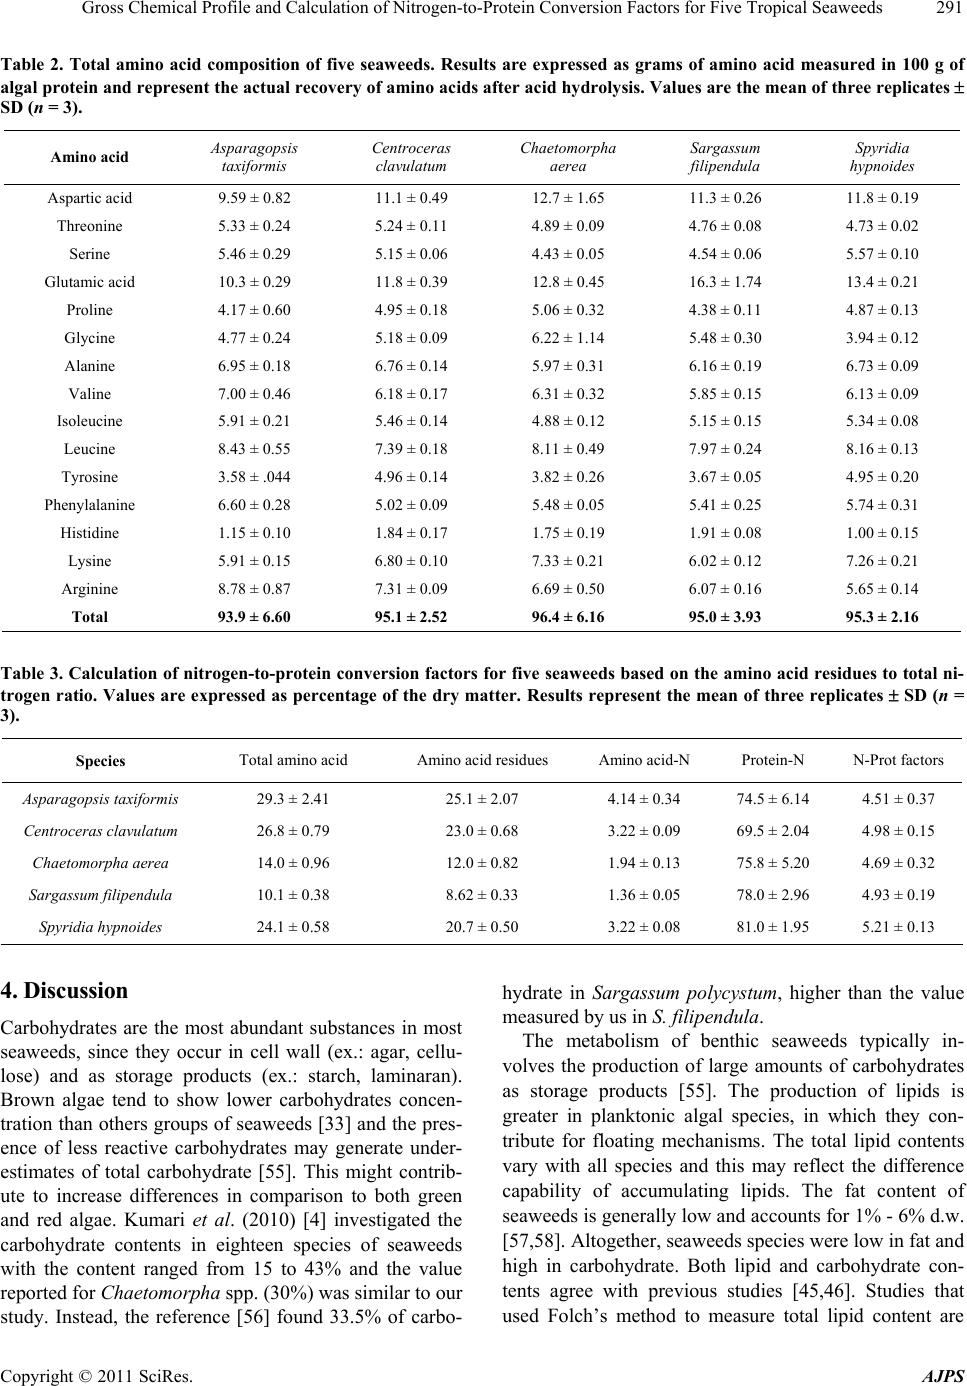 Gross Chemical Profile and Calculation of Nitrogen-to-Protein Conversion Factors for Five Tropical Seaweeds291 Table 2. Total amino acid composition of five seaweeds. Results are expressed as grams of amino acid measured in 100 g of algal protein and represent the actual recovery of amino acids after acid hydrolysis. Values are the mean of three replicates SD (n = 3). Amino acid Asparagopsis taxiformis Centroceras clavulatum Chaetomorpha aerea Sargassum filipendula Spyridia hypnoides Aspartic acid 9.59 ± 0.82 11.1 ± 0.49 12.7 ± 1.65 11.3 ± 0.26 11.8 ± 0.19 Threonine 5.33 ± 0.24 5.24 ± 0.11 4.89 ± 0.09 4.76 ± 0.08 4.73 ± 0.02 Serine 5.46 ± 0.29 5.15 ± 0.06 4.43 ± 0.05 4.54 ± 0.06 5.57 ± 0.10 Glutamic acid 10.3 ± 0.29 11.8 ± 0.39 12.8 ± 0.45 16.3 ± 1.74 13.4 ± 0.21 Proline 4.17 ± 0.60 4.95 ± 0.18 5.06 ± 0.32 4.38 ± 0.11 4.87 ± 0.13 Glycine 4.77 ± 0.24 5.18 ± 0.09 6.22 ± 1.14 5.48 ± 0.30 3.94 ± 0.12 Alanine 6.95 ± 0.18 6.76 ± 0.14 5.97 ± 0.31 6.16 ± 0.19 6.73 ± 0.09 Valine 7.00 ± 0.46 6.18 ± 0.17 6.31 ± 0.32 5.85 ± 0.15 6.13 ± 0.09 Isoleucine 5.91 ± 0.21 5.46 ± 0.14 4.88 ± 0.12 5.15 ± 0.15 5.34 ± 0.08 Leucine 8.43 ± 0.55 7.39 ± 0.18 8.11 ± 0.49 7.97 ± 0.24 8.16 ± 0.13 Tyrosine 3.58 ± .044 4.96 ± 0.14 3.82 ± 0.26 3.67 ± 0.05 4.95 ± 0.20 Phenylalanine 6.60 ± 0.28 5.02 ± 0.09 5.48 ± 0.05 5.41 ± 0.25 5.74 ± 0.31 Histidine 1.15 ± 0.10 1.84 ± 0.17 1.75 ± 0.19 1.91 ± 0.08 1.00 ± 0.15 Lysine 5.91 ± 0.15 6.80 ± 0.10 7.33 ± 0.21 6.02 ± 0.12 7.26 ± 0.21 Arginine 8.78 ± 0.87 7.31 ± 0.09 6.69 ± 0.50 6.07 ± 0.16 5.65 ± 0.14 Total 93.9 ± 6.60 95.1 ± 2.52 96.4 ± 6.16 95.0 ± 3.93 95.3 ± 2.16 Table 3. Calculation of nitrogen-to-protein conversion factors for five seaweeds based on the amino acid residues to total ni- trogen ratio. Values are expressed as percentage of the dry matter. Results represent the mean of three replicates SD (n = 3). Species Total amino acid Amino acid residues Amino acid-N Protein-N N-Prot factors Asparagopsis taxiformis 29.3 ± 2.41 25.1 ± 2.07 4.14 ± 0.34 74.5 ± 6.14 4.51 ± 0.37 Centroceras clavulatum 26.8 ± 0.79 23.0 ± 0.68 3.22 ± 0.09 69.5 ± 2.04 4.98 ± 0.15 Chaetomorpha aerea 14.0 ± 0.96 12.0 ± 0.82 1.94 ± 0.13 75.8 ± 5.20 4.69 ± 0.32 Sargassum filipendula 10.1 ± 0.38 8.62 ± 0.33 1.36 ± 0.05 78.0 ± 2.96 4.93 ± 0.19 Spyridia hypnoides 24.1 ± 0.58 20.7 ± 0.50 3.22 ± 0.08 81.0 ± 1.95 5.21 ± 0.13 4. Discussion Carbohydrates are the most abundant substances in most seaweeds, since they occur in cell wall (ex.: agar, cellu- lose) and as storage products (ex.: starch, laminaran). Brown algae tend to show lower carbohydrates concen- tration than others groups of seaweeds [33] and the pres- ence of less reactive carbohydrates may generate under- estimates of total carbohydrate [55]. This might contrib- ute to increase differences in comparison to both green and red algae. Kumari et al. (2010) [4] investigated the carbohydrate contents in eighteen species of seaweeds with the content ranged from 15 to 43% and the value reported for Chaetomorpha spp. (30%) was similar to our study. Instead, the reference [56] found 33.5% of carbo- hydrate in Sargassum polycystum, higher than the value measured by us in S. filipendula. The metabolism of benthic seaweeds typically in- volves the production of large amounts of carbohydrates as storage products [55]. The production of lipids is greater in planktonic algal species, in which they con- tribute for floating mechanisms. The total lipid contents vary with all species and this may reflect the difference capability of accumulating lipids. The fat content of seaweeds is generally low and accounts for 1% - 6% d.w. [57,58]. Altogether, seaweeds species were low in fat and high in carbohydrate. Both lipid and carbohydrate con- tents agree with previous studies [45,46]. Studies that used Folch’s method to measure total lipid content are Copyright © 2011 SciRes. AJPS 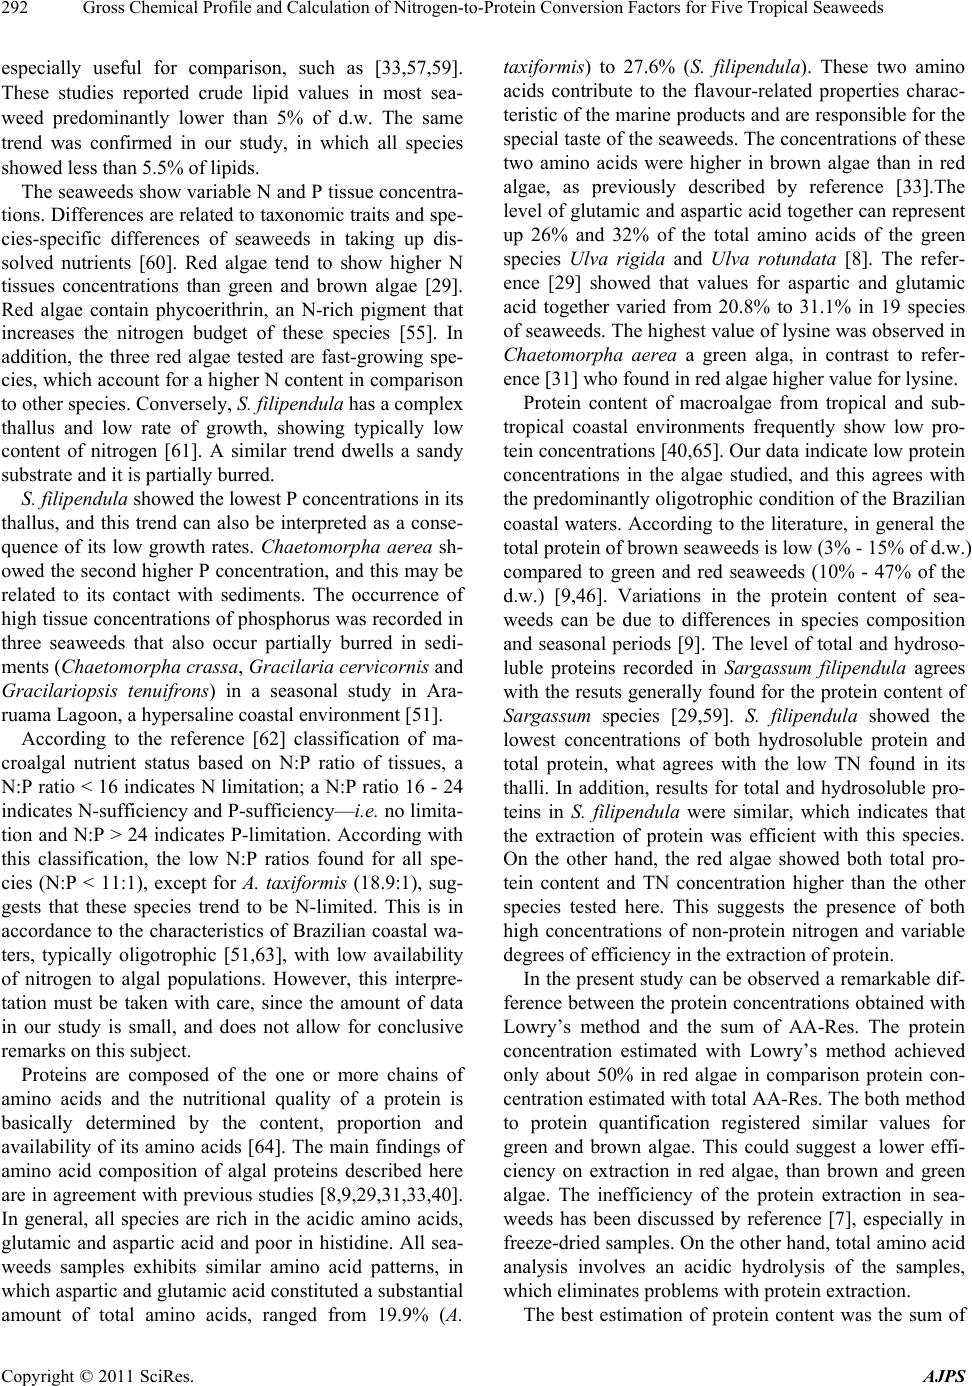 Gross Chemical Profile and Calculation of Nitrogen-to-Protein Conversion Factors for Five Tropical Seaweeds 292 especially useful for comparison, such as [33,57,59]. These studies reported crude lipid values in most sea- weed predominantly lower than 5% of d.w. The same trend was confirmed in our study, in which all species showed less than 5.5% of lipids. The seaweeds show variable N and P tissue concentra- tions. Differences are related to taxonomic traits and spe- cies-specific differences of seaweeds in taking up dis- solved nutrients [60]. Red algae tend to show higher N tissues concentrations than green and brown algae [29]. Red algae contain phycoerithrin, an N-rich pigment that increases the nitrogen budget of these species [55]. In addition, the three red algae tested are fast-growing spe- cies, which account for a higher N content in comparison to other species. Conversely, S. filipendula has a complex thallus and low rate of growth, showing typically low content of nitrogen [61]. A similar trend dwells a sandy substrate and it is partially burred. S. filipendula showed the lowest P concentrations in its thallus, and this trend can also be interpreted as a conse- quence of its low growth rates. Chaetomorpha aerea sh- owed the second higher P concentration, and this may be related to its contact with sediments. The occurrence of high tissue concentrations of phosphorus was recorded in three seaweeds that also occur partially burred in sedi- ments (Chaetomorpha crassa, Gracilaria cervicornis and Gracilariopsis tenuifrons) in a seasonal study in Ara- ruama Lagoon, a hypersaline coastal environment [51]. According to the reference [62] classification of ma- croalgal nutrient status based on N:P ratio of tissues, a N:P ratio < 16 indicates N limitation; a N:P ratio 16 - 24 indicates N-sufficiency and P-sufficiency—i.e. no limita- tion and N:P > 24 indicates P-limitation. According with this classification, the low N:P ratios found for all spe- cies (N:P < 11:1), except for A. taxiformis (18.9:1), sug- gests that these species trend to be N-limited. This is in accordance to the characteristics of Brazilian coastal wa- ters, typically oligotrophic [51,63], with low availability of nitrogen to algal populations. However, this interpre- tation must be taken with care, since the amount of data in our study is small, and does not allow for conclusive remarks on this subject. Proteins are composed of the one or more chains of amino acids and the nutritional quality of a protein is basically determined by the content, proportion and availability of its amino acids [64]. The main findings of amino acid composition of algal proteins described here are in agreement with previous studies [8,9,29,31,33,40]. In general, all species are rich in the acidic amino acids, glutamic and aspartic acid and poor in histidine. All sea- weeds samples exhibits similar amino acid patterns, in which aspartic and glutamic acid constituted a substantial amount of total amino acids, ranged from 19.9% (A. taxiformis) to 27.6% (S. filipendula). These two amino acids contribute to the flavour-related properties charac- teristic of the marine products and are responsible for the special taste of the seaweeds. The concentrations of these two amino acids were higher in brown algae than in red algae, as previously described by reference [33].The level of glutamic and aspartic acid together can represent up 26% and 32% of the total amino acids of the green species Ulva rigida and Ulva rotundata [8]. The refer- ence [29] showed that values for aspartic and glutamic acid together varied from 20.8% to 31.1% in 19 species of seaweeds. The highest value of lysine was observed in Chaetomorpha aerea a green alga, in contrast to refer- ence [31] who found in red algae higher value for lysine. Protein content of macroalgae from tropical and sub- tropical coastal environments frequently show low pro- tein concentrations [40,65]. Our data indicate low protein concentrations in the algae studied, and this agrees with the predominantly oligotrophic condition of the Brazilian coastal waters. According to the literature, in general the total protein of brown seaweeds is low (3% - 15% of d.w.) compared to green and red seaweeds (10% - 47% of the d.w.) [9,46]. Variations in the protein content of sea- weeds can be due to differences in species composition and seasonal periods [9]. The level of total and hydroso- luble proteins recorded in Sargassum filipendula agrees with the resuts generally found for the protein content of Sargassum species [29,59]. S. filipendula showed the lowest concentrations of both hydrosoluble protein and total protein, what agrees with the low TN found in its thalli. In addition, results for total and hydrosoluble pro- teins in S. filipendula were similar, which indicates that the extraction of protein was efficient with this species. On the other hand, the red algae showed both total pro- tein content and TN concentration higher than the other species tested here. This suggests the presence of both high concentrations of non-protein nitrogen and variable degrees of efficiency in the extraction of protein. In the present study can be observed a remarkable dif- ference between the protein concentrations obtained with Lowry’s method and the sum of AA-Res. The protein concentration estimated with Lowry’s method achieved only about 50% in red algae in comparison protein con- centration estimated with total AA-Res. The both method to protein quantification registered similar values for green and brown algae. This could suggest a lower effi- ciency on extraction in red algae, than brown and green algae. The inefficiency of the protein extraction in sea- weeds has been discussed by reference [7], especially in freeze-dried samples. On the other hand, total amino acid analysis involves an acidic hydrolysis of the samples, which eliminates problems with protein extraction. The best estimation of protein content was the sum of Copyright © 2011 SciRes. AJPS  Gross Chemical Profile and Calculation of Nitrogen-to-Protein Conversion Factors for Five Tropical Seaweeds293 AA-Res, which represents the true protein in each sample. The reference [28] analyzed the protein content from two species of Porphyra by different methods and found that the most accurate estimation of protein would be ob- tained with the knowledge of the molecular weights of the sequence of the amino acids. These authors affirm that the sum of amino acids appeared to be the most ac- curate method of determination of protein. Otherwise, the protein contents obtained by N-Prot factors were in good agreement with those of their AA-Res. A usual way to determine N-Prot conversion factors is based in the sum of amino acid residues and determina- tion of the amount of the total protein nitrogen, consid- ering the individual contribution of each amino acid [16, 22]. Therefore, organisms that have proteins rich in highly nitrogenous amino acids (e.g. arginine) tend to have lower N-Prot conversion factors. In contrast, if the total protein contains large amounts of amino acids with a low proportion of nitrogen (e.g. tyrosine), the corresponding factors is likely to be higher. Thus, variation of the total amino acid concentrations may markedly influence the calculation of N-Prot factors [16]. The reference [25] indicated that the N-Prot factors calculated for many Japanese vegetables by total nitrogen could give a more accurate protein value than N-Prot value calculated by total amino acid nitrogen. This trend results from the presence of significant amounts on NPN in vegetables. The use of the ratio of amino acids residues to total ni- trogen to calculate N-Prot factors was described by ref- erence [29]. The total amino acid content of seaweeds represents not only amino acids derived from proteins but also those in the free form. Thus the presence of free amino acids contributes to an overestimation of the total protein. However, according to reference [53], the use of data of total amino acid, without determination of free amino acids, is a widely accepted procedure to estimate protein, since in acid hydrolysis some amino acids are partially or totally destroyed (e.g. tryptophan, cystine, methionine and serine). The loss during acid hydrolysis might compensate for the influence of free amino acids in the quantification of protein by the sum of the total amino acid residues. The overall mean N-Prot factors calculated in this re- port was 4.86. In general a remarkable similarity was observed with the current overall N-Prot factor proposed by reference [29]. These authors reported an average N-Prot factor of 4.92 for 19 seaweeds studied, with av- erage specific factors for groups: 5.13 for green algae; 5.38 for brown algae and 4.59 for red algae. Reference [28] proposed mean N-Prot factor of 5.0 obtained for two species of Porphyra, the seaweed used to make Japanese sushi. The average N-Prot factors calculated for red algae in this study was 4.9, with highest value of 5.21, calcu- lated for S. hypnoides. Red algae tend to show larger amounts of NPN (30.5% in C. clavulatum and 25.5% in A. taxiformis), with ex- ception of S. hypnoides (19%), than brown and green algae (22% and 24.2%, respectively). As a consequence of a high NPN in red algae, the reference [29] found that the N-Prot factors calculated for these algae tended to be lower than for the other algal groups. This could not be assessed in the present study because of the small num- ber of seaweeds studied. 5. Conclusions The seaweeds assessed here are poor in lipid and rich in carbohydrate. Results for hydrosoluble protein indicated that the extraction and reaction of protein occurred in variable degrees, with lower efficiency with A. taxiformis and maximum with S. filipendula. The present results showed that seaweeds have relatively high non-protein nitrogen concentrations and reinforce that the calculation of total protein content by the use of the traditional factor 6.25 overestimates the protein data. From the current data set it is clear that the factor 6.25 is unsuitable for estimating seaweeds protein contents. The present study establishes lower N-Prot factor than the traditional factor for all species. We recommend that the specific N-Prot factors calculated in this work are used in researches in- volving the species assessed here. We currently are as- sessing the effects of temporal variations on N-Prot fac- tors calculated for seven seaweeds throughout two years of sampling. These new results will be published soon. 6. Acknowledgements Authors are indebted to Brazil’s National Council for Scientific and Technological Development (CNPq) and Research Support Foundation of Rio de Janeiro State (FAPERJ) for the financial support of this study. GDS thanks Coordination of Improvement of Higher Education Personnel (CAPES) for her scholarship. Authors thank Dr. Renato Crespo Pereira (UFF) for the use of labora- tory facilities and to Dr. Joel C. De-Paula (UNIRIO) for confirming the identification of the seaweeds. REFERENCES [1] A. Jiménes-Escrig and F. J. Sánchez-Muniz, “Dietary Fiber from Edible Seaweeds, Chemical Structure, Phys- icochemical Properties and Effects on Cholesterol Me- tabolism,” Nutrition Research, Vol. 20, No. 4, 2000, pp. 585-598. doi:10.1016/S0271-5317(00)00149-4 [2] P. Prabhasankar, P. Ganesan, N. Bhaskar, A. Hirose, N. Stephen, L. R. Gowda, M. Hosokawa and K. Miyashita, “Edible Japanese Seaweed, Wakame (Undaria pinnatifida) as an Ingredient in Pasta: Chemical, Functional and Structural Evaluation,” Food Chemistry, Vol. 115, No. 2, Copyright © 2011 SciRes. AJPS  Gross Chemical Profile and Calculation of Nitrogen-to-Protein Conversion Factors for Five Tropical Seaweeds 294 2009, pp. 501-508. doi:10.1016/j.foodchem.2008.12.047 [3] S. B. Lee, J. Y. Lee, D.-G. Song, C.-H. Pan, C. W. Nho and M. C. Kim, “Cancer Chemopreventive Effects of Korean Seaweed Extracts,” Food Science Biotechnology, Vol. 17 No. 3, 2008, pp. 613-622. [4] P. Kumari, M. Kumar, V. Gupta, C. R. K. Reddy and B. Jha, “Tropical Marine Macroalgae as Potential Sources of Nutritionally Important PUFAs,” Food Chemistry, Vol. 120, No. 3, 2010, pp. 749-757. doi:10.1016/j.foodchem.2009.11.006 [5] C. Havrilla, M. Mitra, A. Chaudhuri, G. Mandouma, Y. Waguespack, J. Schwarz and S. Wu, “Solid-State CP- MAS 13C NMR Analysis of Seaweeds from the Chinco- teague Bay, Virginia,” Journal of Undergraduate Chemi- cal Research, Vol. 4, No. 4, 2006, pp. 175-179. [6] J. A. Berges, A. E. Fisher and P. J. Harrison, “ A Com- parison of Lowry, Bradford and Smith Protein Assay Us- ing Different Protein Standards and Protein Isolated from the Marine Diatom Thalassiosira pseudonana,” Marine Biology, Vol. 115, No. 2, 1993, pp. 187-193. doi:10.1007/BF00346334 [7] E. Barbarino and S. O. Lourenço, “An Evaluation of Me- thods for Extraction and Quantification of Protein from Macro- and Microalgae,” Journal of Applied Phycology, Vol. 17, No. 5, 2005, pp. 447-460. doi:10.1007/s10811-005-1641-4 [8] J. Fleurence, C. Le Couer, S. Mabeau, M. Maurice and A. Landrein, “Comparison of Different Extractive Proce- dures for Proteins from the Edible Seaweeds Ulva rigida and Ulva rotundata,” Journal of Applied Phycology, Vol. 7, No. 6, 1995, pp. 577-582. doi:10.1007/BF00003945 [9] J. Fleurence, “Seaweeds Proteins: Biochemical, Nutri- tional Aspects and Potential Uses,” Trends Food Science & Technology, Vol. 10, No. 1, 1999, pp. 25-28. doi:10.1016/S0924-2244(99)00015-1 [10] O. H. Lowry, N. J. Rosebrough, A. L. Farr and R. L. Randall, “Protein Measurement with the Folin Phenol Reagent,” Journal of Biological Chemistry, Vol. 193, No. 1, 1951, pp. 265-275. [11] M. Bradford, “A Rapid and Sensitive Method for the Quantitation of Microgram Quantities of Protein Utilizing the Principle of Protein Dye-Binding,” Analytical Bio- chemistry, Vol. 72, No. 1-2, 1976, pp. 248-254. doi:10.1016/0003-2697(76)90527-3 [12] C. M. Stoscheck, “Quantification of Protein,” Methods in Enzymology, Vol. 182, No. 1, 1990, pp. 50-68. doi:10.1016/0076-6879(90)82008-P [13] G. Legler, C. M. Müller-Platz, M. Mentges-Hettkamp, G. Pflieger and E. Jülich, “On the Chemical Basis of the Lowry Protein Determination,” Analytical Biochemistry, Vol. 150, No. 2, 1985, pp. 278-287. doi:10.1016/0003-2697(85)90511-1 [14] Association of Official Analytical Chemists (AOAC), “Official Methods of Analysis,” 15th Edition, Washing- ton DC, 1990, p. 1200. [15] C. C. Hach, B. K. Bowden, A. B. Kopelove and S. T. Brayton, “More Powerful Peroxide Kjeldhal Digestion Method,” Journal Association of Official Analytical Che- mists, Vol. 70, No. 5, 1987, pp. 783-787. [16] F. W. Sosulski and G. I. Imafidon, “Amino Acid Compo- sition and Nitrogen-to-Protein Conversion Factors for Animal and Plant Foods,” Journal of Agricultural and Food Chemistry, Vol. 38, No. 6, 1990, pp. 1351-1356. doi:10.1021/jf00096a011 [17] F. Mariotti, D. Tomé and P. P. Mirand, “Converting Ni- trogen into Protein—Beyond 6.25 and Jones’ Factors,” Critical Reviews in Food Science and Nutrition, Vol. 48, No. 2, 2008, pp. 177-184. doi:10.1080/10408390701279749 [18] S. Fujihara, H. Sasaki,Y. Aoyagi and T. Sugahara, “Ni- trogen-to-Protein Conversion Factors for Some Cereal Products in Japan,” Journal of Food Science, Vol. 73, No. 3, 2008, pp. C204-C209. doi:10.1111/j.1750-3841.2008.00665.x [19] H. H. Yeoh and V. D. Truong, “Protein Contents, Amino Acid Compositions and Nitrogen-to-Protein Conversion Factors for Cassava Roots,” Journal of the Science of Food and Agriculture, Vol. 70, No. 1, 1999, pp. 51-54. [20] P. Mattila, P. Salo-Väänänen, K. Konko, H. Aro and T. Jalava, “Basic Compositon and Amino Acid Contents of Mushrooms Cultived in Finland,” Journal of Agricultural and Food Chemistry, Vol. 50, No. 22, 2002, pp. 6419- 6422. doi:10.1021/jf020608m [21] D. A. Rouch, H. Roginski, M. L. Britz and P. Roupas, “Determination of a Nitrogen Conversion Factor for Pro- tein Content in Cheddar Cheese,” International Dairy Journal, Vol. 18, No 2, 2008, pp. 216-220. doi:10.1016/j.idairyj.2007.07.004 [22] P. P. Salo-Väänänen and P. E. Koivistoinen, “Determina- tion of Protein in Foods: Comparison of Net Protein and Crude Protein (N × 6.25) Values,” Food Chemistry, Vol. 57, No. 1, 1996, pp. 27-31 [23] D. B. Jones, “Factors for Converting Percentages of Ni- trogen in Foods and Feeds into Percentages of Protein,” USDA (US Department of Agriculture) Circular Series, No. 183, 1931, pp. 1-21. [24] N. L. Conklin-Brittain, E. S. Dierenfeld, R. W. Wranghan, M. Norconk and S. C. Silver, “Chemical Protein Analysis: A Comparison of Kjeldhal Crude Protein and Total Nin- hydrin Protein from Wild, Tropical Vegetation,” Journal of Chemical Ecology, Vol. 25, No. 12, 1999, pp. 2601- 2622. doi:10.1023/A:1020835120701 [25] S. Fujihara, A. Kasuga and Y. Aoyagi, “Nitrogen-to-Pro- tein Conversion Factors for Common Vegetables in Ja- pan,” Journal of Food Science, Vol. 66, No. 3, 2001, pp. 412-415. doi:10.1111/j.1365-2621.2001.tb16119.x [26] I. E. Ezeagu, J. K. Petzke, C. C. Metges, A. O. Akinsoy- inu and A. D. Ologhobo. “Seed Protein Contents and Ni- trogen-to-Protein Conversion Factors for Some Unculti- vated Tropical Plant Seeds,” Food Chemistry, Vol. 78, No. 1, 2002, pp. 105-109. doi:10.1016/S0308-8146(02)00105-X [27] H. H. Yeoh and Y. C. Wee, “Leaf Protein Contents and Nitrogen-to-Protein Conversion Factors for 90 Plant Spe- Copyright © 2011 SciRes. AJPS  Gross Chemical Profile and Calculation of Nitrogen-to-Protein Conversion Factors for Five Tropical Seaweeds295 cies,” Food Chemistry, Vol. 49, No. 3, 1994, pp. 245-250. doi:10.1016/0308-8146(94)90167-8 [28] K. A. Aitken, L. D. Melton and M. T. Brown, “Seasonal Protein Variation in the New Zealand Seaweeds Porphyra columbina Mont. and Porphyra subtumens J. Ag. (Rho- dophyceae),” Japanese Journal of Phycology, Vol. 39, No. 4, 1991, pp. 307-317. [29] S. O. Lourenço, E. Barbarino, J. C. De-Paula, L. O. da S. Pereira and U. M. Lanfer Marquez, “Amino Acid Compo- sition, Protein Content and Calculation of Nitrogen-to- Protein Conversion Factors for 19 Tropical Seaweeds,” Phycology Research, Vol. 50, No. 3, 2002, pp. 233-241. [30] P. N. M. Perfeto, “Relation between Chemical Composi- tion of Grateloupia doryphora (Montagne) Howe, Gym- nogongrus griffithsiae (Turner) Martius, and Abiotic Pa- rameters,” Acta Botanica Brasilica, Vol. 12, No. 1, 1998, pp. 77-88. [31] M. V. Ramos, A. C. O. Monteiro, R. A. Moreira and A. F. F. U. Carvalho, “Amino Acid Composition of Some Bra- zilian Seaweed Species,” Journal of Food Biochemistry, Vol. 24, No. 1, 2000, pp. 33-39. [32] J. Ortiz, N. Romero, P. Robert, J. Araya, J. Lopez- Her- nández, C. Bozzo, E. Navarrete, A. Osorio and A. Rios, “Dietary Fiber, Amino Acid, Fatty Acid and Tocopherol Contents of the Edible Seaweeds Ulva lactuca and Dur- villaea Antarctica,” Food Chemistry, Vol. 99, No. 1, 2006, pp. 98-104. [33] C. Dawczynski, R. Schubert and G. Jahreis, “Amino Ac- ids, Fatty Acids, and Dietary Fiber in Edible Seaweed Products,” Food Chemistry, Vol. 103, No. 3, 2007, pp. 891-899. doi:10.1016/j.foodchem.2006.09.041 [34] S. O. Lourenço, E. Barbarino, P. L. Lavín, U. M. Lanfer Márquez and E. Aidar, “Distribution of Intracellular Ni- trogen in Marine Microalgae: Calculation of New Nitro- gen-to-Protein Conversion Factors,” European Journal of Phycology, Vol. 39, No. 1, 2004, pp. 17-32. doi:10.1080/0967026032000157156 [35] P. A. Wheeler and B. R. Björnsäter, “Seasonal Fluctuations in Tissue Nitrogen, Phosphorus, and N:P for Five Macro- algal Species Common to the Pacific Northwest Coast,” Journal of Phycology, Vol. 28, No. 1, 1992, pp. 1-6. [36] P. Peckol, B. DeMeo-Andersen, J. Rivers, I. Valiela, M. Maldonado and J. Yates, “ Growth, Nutrient Uptake Ca- pacities and Tissue Constituents of the Macroalgae Cla- dophora vagabunda and Gracilaria tikvahiae Related to Site-Specific Nitrogen Loading Rates,” Marine Biology, Vol. 121, No. 1, 1994, pp. 175-185. [37] P. Fong, J. B. Zedler and R. M. Donohoe, “Nitrogen vs Phosphorus Limitation of Algal Biomass in Shallow Coastal Lagoons,” Limnology and Oceanography, Vol. 38, No. 5, 1993, pp. 906-923. [38] S. Dere, N. Dalkiran, D. Karacaoglu, G. Yildiz and E. Dere, “The Determination of Total Protein, Total Soluble Carbohydrate and Pigment Contents of Some Macroalgae Collected from Gemlik-Karacaali (Bursa) and Erdek- Ormanli (Balikesir) in the Sea of Marmara, Turkey,” Oceanologia, Vol. 45, No. 3, 2003, pp. 453-471. [39] M. D. Hanisak, “Nitrogen Release from Decomposing Seaweeds, Species and Temperature Effects,” Journal of Applied Phycology, Vol. 5, No. 2, 1993, pp. 175-181. [40] K. H. Wong and C. K. Cheung, “Nutritional Evaluation of Some Subtropical Red and Green Seaweeds Part I: Proximate Composition, Amino Acid Profiles and Some Physico-Chemical Properties,” Food Chemistry, Vol. 71, No. 4, 2000, pp. 475-482. doi:10.1016/S0308-8146(00)00175-8 [41] K. H. Wong and C. K. Cheung, “Nutritional Evaluation of Some Subtropical Red and Green Seaweeds Part II. In Vitro Protein Digestibility and Amino Acid Profiles of Protein Concentrates,” Food Chemistry, Vol. 72, No. 1, 2001, pp. 11-17. doi:10.1016/S0308-8146(00)00176-X [42] B. Schaffelke, “Short-Term Nutrient Pulses as Tools to Assess Responses of Coral Reef Macroalgae to Enhanced Nutrient Availability,” Marine Ecology Progress Series, Vol. 182, No. 1, 1999, pp. 305-310. [43] P. Fong, K. Kamer, K. E. Boyer and K. A. Boyle, “Nu- trient Content of Macroalgae with Different Morpholo- gies May Indicate Sources of Nutrients for Tropical Ma- rine Systems,” Marine Ecology Progress Series, Vol. 220, No. 12, 2001, pp. 137-152. doi:10.3354/meps220137 [44] S. O. Lourenço, E. Barbarino, A. Nascimento, J. N. P. Freitas and G. S. Diniz, “Tissue Nitrogen and Phosphorus of Seaweeds in a Tropical Eutrophic Environment: What a Long-Term Study Tells us,” Journal of Applied Phy- cology, Vol. 18, No. 3-5, 2006, pp. 389-398. doi:10.1007/978-1-4020-5670-3_21 [45] T. Fujiwara-Arasaki, N. Mino and M. Kuroda, “The Pro- tein Value in Human Nutrition of Edible Marine Algae in Japan,” Hydrobiologia, Vol. 116-117, No. 1, 1984, pp. 513-516. [46] P. Rúperez and F. Saura-Calixto, “Dietary Fibre and Phy- sicochemical Properties of Edible Spanish Seaweeds,” European Food Research and Technology, Vol. 212, No. 3, 2001 pp. 349-354. [47] M. J. Wynne, “A Checklist of Benthic Marine Algae of the Tropical and Subtropical Western Atlantic: First Revision,” Nova Hedwigia, Vol. 116, No. 1, 1998, pp. 1-155. [48] S. Myklestad and A. Haug, “Production of Carbohydrates by the Marine Diatom Chaetoceros affinis var. Willei (Gran) Hustedt. I. Effect of the Concentration of Nutrients in the Culture Medium,” Journal of Experimental Marine Biology and Ecology, Vol. 9, No. 2, 1972, pp. 125-136. [49] M. Dubois, K. A. Gilles, J. K. Hamilton, P. A. Reberts and F. Smith, “Colorimetric Method for Determination of Sugars and Related Substances,” Analytical Chemistry, Vol. 28, No. 3, 1956, pp. 350-356. [50] J. Folch, M. Lees and G. H. Sloanne-Stanley, “A Simple Method for the Isolation and Purification of Total Lipid from Animal Tissue,” The Journal of Biological Chemis- try, Vol. 226, No. 1, 1957, pp. 497-509. [51] S. O. Lourenço, E. Barbarino, A. Nascimento and R. Paranhos, “Seasonal Variations in Tissue Nitrogen and Phosphorus of Eight Macroalgae from a Tropical Hyper- Copyright © 2011 SciRes. AJPS  Gross Chemical Profile and Calculation of Nitrogen-to-Protein Conversion Factors for Five Tropical Seaweeds Copyright © 2011 SciRes. AJPS 296 saline Coastal Environment,” Cryptogamie Algologie, Vol. 26, No. 4, 2005, pp. 355-371. [52] S. A. Cohen and K. M. De Antonis, “Applications of Amino Acid Derivatization with 6-Aminoquinolyl-N- hydroxysuccinimidyl Carbamate. Analysis of Feed Grains, Intravenous Solutions and Glycoproteins,” Journal of Chromatography A, Vol. 661, No. 1-2, 1994, pp. 25-34. [53] J. Mossé, “Nitrogen to Protein Conversion Factor for Ten Cereals and Six Legumes or Oilseeds. A Reappraisal of Its Definition and Determination. Variation According to Species and to Seed Protein-Content,” Journal of Agri- cultural and Food Chemistry, Vol. 38, No. 1, 1990, pp. 18-24. [54] J. H. Zar, “Biostatistical Analysis,” 3rd Edition, Prentice Hall, Inc., Upper Saddle River, 1996, p. 920. [55] C. S. Lobban and P. H. Harrison, “Seaweed Ecology and Physiology,” Cambridge University Press, New York, 1994. [56] P. Matanjun, S. Mohamed, N. Mustapha and K. Muham- mad, “Nutrient Content of Tropical Edible Seaweeds, Eucheuma cottoni, Caulerpa lentillifera and Sargassum polycystum,” Journal of Applied Phycology, Vol. 21, No. 1, 2009, pp. 75-80. doi:10.1007/s10811-008-9326-4 [57] J. Fleurence, G. Gutbier, S. Mabeu and C. Leray, “Fatty Acids from 11 Marine Macroalgae of the French Brittany Coast,” Journal of Applied Phycology, Vol. 6, No. 5-6, 1994, pp. 527-532. [58] V. Gressler, N. S. Yokoya, M. T. Fujii, P. Colepicolo, J. Mancini Filho, R. P. Torres and E. Pinto, “Lipid, fatty Acid, Protein, Amino Acid and Ash Contents in Four Brazilian Red Algae Species,” Food Chemistry, Vol. 120, No. 2, 2010, pp. 585-590. doi:10.1016/j.foodchem.2009.10.028 [59] K. J. McDermid and B.Stuercke, “Nutritional Composi- tion of Edible Hawaiian Seaweeds,” Journal of Applied Phycology, Vol. 15, No. 6, 2003, pp. 513-524. [60] J. F. Martínez-Aragón, I. Hernández, J. L. Pérez-Looréns, R. Vázquez and J. J. Vergara, “Biofiltering Efficiency in Removal of Dissolved Nutrients by Three Species of Es- tuarine Macroalgae Cultivated with Sea Bass (Dicen- trarchus labrax) Waste Waters 1. Phosphate,” Journal of Applied Phycology, Vol. 14, No. 5, 2002, pp. 365-374. doi:10.1023/A:1022178417203 [61] R.-L. Hwang, C.-C. Tsai and T.-M. Lee, “Assessment of Temperature and Nutrient Limitation on Seasonal Dy- namics among Species of Sargassum from a Coral Reef in Southern Taiwan,” Journal of Phycology, Vol. 40, No. 3, 2004, pp. 463-473. doi:10.1111/j.1529-8817.2004.03086.x [62] B. R. Björnsäter and P. A. Wheeler, “Effect of Nitrogen and Phosphorus Supply on Growth and Tissue Composi- tion of Ulva fenestrata and Enteromorpha intestinalis (Ulvales, Chlorophyta),” Journal of Phycology, Vol. 26, No. 4, 1990, pp. 603-611. [63] B. Castro Filho, F. P. Brandini, A. M. S. Pires Vanin and L. B. Miranda, “Multidisciplinary Oceanographic Proc- esses on the Western Atlantic Continental Shelf between 4˚N and 34˚S,” In: A. R. Robinson and K. Brink, Orgs., The Global Coastal Ocean: Interdisciplinary Regional Studies and Syntheses: The Sea, Vol. 14A, Harvard Uni- versity Press, Harvard, 2006, pp. 259-293. [64] C. Taboada, R. Millán and I. Míguez, “Composition, Nu- tritional Aspects and Effect on Serum Parameters of Ma- rine Algae Ulva rigida,” Journal of the Science of Food and Agriculture, Vol. 90, No. 3, 2010, 445-449. doi:10.1002/jsfa.3836 [65] S. Kaehler and R. Kennish, “Summer and Winter Com- parisons in the Nutritional Value of Marine Macroalgae from Hong Kong,” Botanica Marina, Vol. 39, No. 1, 1996, pp. 11-17.
|