Open Access Library Journal
Vol.04 No.04(2017), Article ID:75617,14 pages
10.4236/oalib.1103402
A Study of the Intervening Effect of Political Stability on the Relationship between Performance Contracting and Measurement, and Public Service Delivery in Kenya
Richard E. Ndubai1, Isaac M. Mbeche2, Ganesh P. Pokhariyal2
1School of Business, University of Nairobi, Nairobi, Kenya
2School of Mathematics, University of Nairobi, Nairobi, Kenya

Copyright © 2017 by authors and Open Access Library Inc.
This work is licensed under the Creative Commons Attribution International License (CC BY 4.0).
http://creativecommons.org/licenses/by/4.0/


Received: January 24, 2017; Accepted: April 22, 2017; Published: April 25, 2017
ABSTRACT
The performance of public agencies is influenced and affected by many factors, both internal and external. The internal factors are in many cases controllable, while external factors tend to fall outside the control of public sector managers. Moreover, the effect may serve to ameliorate performance or intervene to weaken performance and thereby adversely affect delivery of services. This paper explored the intervening effect of political stability, an external factor, on the relationship between performance contracting and measurement, and public service delivery (expressed as customer satisfaction) in Kenya. The study was based on the results of measurement and evaluation of the performance of 470 public agencies that operated under performance contracts between 2004 and 2011. Using regression analysis, it was found initially that on its own, political stability had no significant relationship with or influence on customer satisfaction. It however had an effect on the relationship between performance contracting, measurement and public service delivery, where a unit change in poli- tical stability contributed negatively to customer satisfaction by a factor of 0.257, though not statistically significant. Correlation analysis established further that social chaos and turmoil, which result in political instability, negatively impact the attractiveness of a country in the global arena.
Subject Areas:
Sociology
Keywords:
Performance Contracting, Performance Measurement, Performance Improvement, Political Stability, Service Delivery, Customer Satisfaction

1. Introduction
Many governments have made attempts at improving the delivery of public services by striving to influence directly, the performance of their public sector institutions. It has been argued that there is a distinct linkage between organizational performance and excellence in service delivery, the latter being a deliverable of the former. In exploring deliverables as a concept, Langdon, (2000) [1] , described outputs as synonymous with deliverables of performance and contended that outputs are the reason for the existence of business organizations. He stated further that all output has a consequence, the result of the output being that which is delivered. He explained that to produce output and consequence there is need for reason and resources, called inputs such as materials, ideas, knowledge and equipment. Both reason (and triggers) and resources are inputs because they are used to produce the output and achieve the consequence. First, a reason is needed for doing the performance, which comes in the form of a request of some kind. For example, the business unit identifies a customer need; an order initiates a core process to deliver what the customer wants or a work group receives its assignment to meet this need. A manager asks individuals to do their part to produce the output. These are all (internal or external) client requests or triggers to start the performance. A service delivered is an outcome resulting from actions directed at making available tangible products for disposal purposes. The manner in which work groups and individuals execute their part in delivering the output in turn determines the quality of service delivery.
Improvement in organizational performance and the consequent improvement in service delivery can be affected, positively or adversely, by both internal and external factors. Internal factors include principally motivation of employees driven by such factors as better communication between managers and workers, greater manager involvement in employee lives, Mayo, (1880-1949) [2] , satisfying psychological and physiological needs of employees, Maslow, (1908-1970) [3] , applying scientific management principles to work planning, Taylor, (1911) [4] and implementing appropriate reward systems. These factors are to a large extent within the control of an organization. External factors on the other hand, are largely outside the span of control of the organization and may result from events that take place within and outside the jurisdiction of organizations or countries. Common among these are the market dynamics of supply and demand, fluctuations in global commodity prices, whether these are caused by market forces or deliberate manipulation, terrorism, global competitiveness of a country’s goods and services, diplomatic relations with other countries and political stability. The variables conventionally associated with political stability include economic and democratic freedom, the predictability of the electoral environment (political certainty), ideological homogeneity of political parties and establishments, ethnic homogeneity and general absence of violence and terrorism. Alesina, et al., 1992: 2) [5] , define political stability as the propensity of a government collapse, either because of conflicts or rampant competition between various political parties, and proceed to state that political stability is beneficial for much of the economic progress that a country may achieve. Yi and Chen (1996) [6] state that riots, political repressions, deaths from political violence and unsuccessful attempts to change the government all signal the imminence of political crisis and increase the probability of irregular government change and major regular government change. Party competition decreases the probability of irregular government change, whereas it increases the probability of regular government change. The fractionalization of the legislature (as indexed by the number of all seats in the legislature divided by those of the largest party) increases the probability of all three kinds of government change. Political stability then relates essentially to the quality of governance. Improvement in the quality of governance impacts positively on service delivery and combines with performance contracting and measurement to improve customer satisfaction. Performance contracting in this context makes reference to a management regimen characterized by defined results that are ultimately measured to establish the extent of achievement. Decline in political stability (political instability) precipitates the converse, principally because it affects performance adversely. This stark reality began to show its glare in the performance of the tourism industry in the Kingdom of Lesotho in 2014. The tiny mountain kingdom had been experiencing serious political turmoil since the formation of a loose coalition government after the May, 2012 general elections. The situation deteriorated in June 2014, leading to the collapse of the coalition, an unscheduled prorogation of parliament, and ultimate Southern African Development Community (SADC) mediated agreement to hold early elections in February 2015. According to a statement issued by the public relations manager of the Lesotho Tourist Development Corporation (LTDC) to the local media, (Motsoeneng, 2014) [7] “The tourism industry is feeling the pinch of a drastic decline in the inflow of tourists as well as decreased spending by both corporate and individual consumers, owing to the political and security instability rocking the mountain kingdom. Despite the LTDC efforts in marketing Lesotho as a tourist and investment destination, political turmoil had left the sector reeling. Businesses have reported a downturn in revenue for lodging, food, events and other hospitality services”.
In Kenya, instability following the 2007/2008 post-election skirmishes resulted in a sharp decline in economic growth from a high of 7.1% in 2007 to a measly 1.7% in 2008, and a proportionally sharp decline in aggregate performance of the public service (Figure 1 and Figure 2).
The country has continued to wade through insecurity challenges perpetrated by terrorist insurgents from a neighboring country.
2. Literature Review
As observed above, Alesina et al. (1992:2) [5] , political stability is beneficial for much of the economic progress that a country may achieve. Further, investment

Figure 1. Economic Growth (percent 2002-2010). Source: Performance Evaluation results, Office of the Prime Minister, Government of the Republic of Kenya.

Figure 2. Public Service Aggregate Performance. Source: Performance Evaluation results, Office of the Prime Minister, Government of the Republic of Kenya (year) 2012.
and growth highly depend on it, recovery is faster under a stable political environment, and issues of employment, human capital development and business development can be dealt with much faster and effectively in an environment that does not suffer from risks of change, or even worse, risk of conflict, because of political instability. This position is corroborated by Busse and Hefeker, (2005) [8] , who argued that government stability, absence of internal conflict and ethnic tensions, basic democratic rights and law and order are frequently found as significant determinants of foreign investment inflows. They proceed to state that countries with a lower political risk and better institutions related to these indicators received―ceteris paribus―more foreign direct investment per capita. Thus, political stability not only allows for higher levels of growth, but also attracts more foreign direct investment. Political risk, whether in the form of conflict or a peaceful, election-based overthrow of a government would not be seen as beneficial for attracting investment. In a publication by the Centre for Public Policy Studies (CPPS) in February 2012, it is argued that political stability gives a peaceful, stable environment that is necessary for any progress in other areas of life―science, economy, developmental and philanthropic progress and in general, sees more progress than a period that a country is under an unstable political situation, for the simple reason that in a stable, peaceful environment, people have the time and luxury of being able to deal with issues other than basic survival needs. Writing in an IMF working paper, Aisen and Veiga (2011:1) [9] , concluded that “…higher degrees of political instability are associated with lower growth rates of gross domestic product (GDP) per capita. Political instability usually leads to sub-optimal macroeconomic policies and a frequent switch between policies, creating volatility and thus high levels of uncertainty”. The IMF working paper reaffirmed the findings of an older similar attempt, reported by Alesina et al., (1992) [5] which found that in countries with high levels of political instability, economic growth is reported at very low levels. They added that, the two phenomena are in fact, interconnected and affect each other. High volatility in the government establishment may lead to lower growth, but also a poor indicator of growth may lead to higher political instability.
Yi, (1997) [10] , argued that democracy is likely to have a significant indirect effect on growth through its impact on political stability. In 1997, they conducted a study to investigate the long term interrelationship between democracy, political stability and economic growth. The study utilized aggregate data covering 96 countries in Europe, North America, South America, Africa and Asia from 1960 to 1980 and employed the simultaneous approach of combining the study of economic growth and political stability with that of economic growth and democracy. The inclusion of democracy as an endogenous variable in the study strengthened the feedback between growth and political stability. The findings of the study were that instability involving drastic political changes is harmful to economic growth. Irregular government change, which is a consequence of political instability, has a negative and significant effect on growth. Alesina et al. (1992:2) [5] argue that despite its positive impact on economic growth, political stability may lead to oppression of democracy, and a government that is ageing, growing its roots further into the ground and showing no signs of letting in new blood. Such a picture of political stability may indeed be detrimental for some aspects of society, perhaps not for the economy, but for aspects related to innovation, culture, democratic representation, and violation of human rights. The paper by the CPPS (1992) [11] , explored also the shortcomings of political stability, observing that many see political stability as a condition that not only does not allow any form of change and thus undermines progress, but more importantly, as a condition that demoralizes the public leaving all in a pessimistic state that does not encourage innovation and ingenuity. It suppresses people and all their creativity and optimism, and blinds them with materialism, trapping them in a pursuit for material happiness rather than virtuous living, morality and ideals.
3. Research Methodology
This study had positivistic orientation and employed a cross-sectional design whereby the research problem was identified, previous published literature reviewed and synthesized, and the hypotheses relating to the research questions specified. The study sought to explore the effect of political stability on the relationship between performance contracting and measurement, and public service delivery. The hypothesis that formed the basis of the study was that there is no significant intervening effect of political stability on the relationship between performance contracting and measurement, and public service delivery in Kenya. Ultimately therefore, the study focused on the effect of political stability on customer satisfaction with the services provided by the public sector. The new constitution was promulgated in August 2010 and this has significantly altered the landscape of structure and profile of government agencies. Requirements in the constitution precipitated wide ranging restructuring of the mainstream civil service resulting in the merger of ministerial functions, there by reducing the ministries and accounting departments from 46 to 18 and virtual abolition of local authorities. The data available for the study therefore was in regard only to agencies in the old, pre-constitution structure. The political stability indices were extracted from the World Bank report on Worldwide Governance Indicators on political stability and absence of violence/terrorism.
The study relied on secondary data emanating from the results of measurement and evaluation of the performance of public agencies on performance contract for the period 2007 to 2011, which was already available. In 2010/11, which was the terminal year for data collection and analysis, the number of public agencies on performance contract was 470, made up of 46 ministries and accounting departments, 178 state corporations, 175 local authorities and 71 tertiary institutions. The focus of the study was the entire population of 470 public agencies. Further, the various categories of public agencies had, by 2010/11, been on performance contract for differing periods; these are 6 years for both ministries and state corporations, 5 years for local authorities and 4 years for tertiary institutions. The analysis was carried out using SPSS version 21 for descriptive and inferential statistics.
4. Data Analysis and Results
The study focused on the five years of 2006/07, 2007/08, 2008/09, 2009/10 and 2010/11, during which period customer satisfaction in the majority of the categories of public agencies was measured. The distribution of the various categories of institutions is shown in Table 1.
The performance measurement and evaluation methodology in Kenya graded excellence on a composite-scoring scale ranging from 1 to 5 with 1 denoting the upper limit of “excellent” achievement and 5 representing the lowest limit of “poor” achievement. The composite scores were inverted, in order to give a rising visual effect to positive achievement and a declining visual effect to poor achievement. Further, the composite scores in each of the four categories of public agencies were averaged for each year to contain the data within manageable parameters.
The data from the agencies was organized, summarized and collated in a

Table 1. Distribution of public agencies on performance contract in 2011.
Source: Organization of Government; Office of the President (2006-2011).
manner that linked with the research question and subsequently analyzed using both descriptive statistics and inferential statistics. The analysis was carried out using the Statistical Package for Social Sciences (SPSS), version 21. Descriptive statistical analysis was carried out to summarize the data and to bring out variability, using the mean, the standard deviation and then computing the coefficient of variation. Correlation coefficients were computed to establish the relationship between the study variables. The extent to which the dependent variable could be predicted from the independent variable, is seen by deriving the regression equation. Coefficient of determination was computed to reflect the goodness of fit of the model. Linear regression analysis was further used to examine the model’s overall and individual statistical significance by using F-value and t- value, respectively. A model equation was derived for the hypothesis using variables that were significant. Table 2 shows the descriptive and inferential statistics of the study’s variables.
As indicated in the table, the public sector in Kenya had an average customer satisfaction index of 0.27779, implying that nearly 73 percent of customers were dissatisfied with the public sector service delivery. Among other variables pitted against customer satisfaction, political stability was found to be the weakest with a mean of −1.31533 on a scale of −2.5 (very weak) and 2.5 (very strong) and had the lowest variability (CV= −8.13%) across the public sector made up of ministries, state corporations, local authorities and tertiary institutions. The coefficient of variation was computed to show the variability in the data of the study parameters. Customer satisfaction shows the greatest variability, followed by performance measurement. The global competitiveness shows the least variability and political stability has fairly negative variability.
In order to establish the intervening effect of political stability on the relationship between performance contracting and measurement and service by public agencies, regression and correlation analysis were used to establish the influence on the relationship.
A correlation analysis of the study variables (Table 3 ) established that customer satisfaction and global competitiveness were negatively related with political stability (R = −0.134 and R = −0.468) although the relationship was not significant. This relationship shows that social chaos and turmoil, which result in political instability, will negatively impact the attractiveness of a country in the
Table 2. Descriptive/Inferential statistics of the study’s variables.
Table 3. Correlation analysis of the study variables.
**Correlation is significant at the 0.01 level (2-tailed).
global arena.
The regression analysis further provided an estimate equation to predict the magnitude of the dependent variable (customer satisfaction) and give values for the predictor variables.
In addition, t-test and p-values were used to determine individual significance of the results of the analysis. Assessment of the overall robustness and significance of the regression models was done using the F-test and p-values. Pearson correlation coefficient, R2, beta coefficients, and p values were computed.
5. The Intervening Effect of Political Stability
The study began with analysis to establish the effect of political stability on customer satisfaction in Kenya’s public sector. The results of the analysis are shown in Table 4.
The results in Table 4 show that political stability had a weak positive relationship with customer satisfaction. This finding is supported by the fact that the mean political stability index was very low at −1.31533. Political stability explained 1.8 percent (R2 = 0.018) of customer satisfaction levels with the remaining 98.2 percent accounted for by other factors implemented in the public sector.
Table 4. Relationship between Political Stability and Customer Satisfaction.
aPredictors: (Constant), Political Stability.
aDependent Variable: Customer Satisfaction. b. Predictors: (Constant), Political Stability.
aDependent Variable: Customer Satisfaction.
The F-value for the model was 0.239 and the derived p-value was 0.633. Since the derived p-value was greater than 0.05, the indication was that political stability had no significant relationship with customer satisfaction.
The results of the analysis conducted to establish the intervening effect of political stability on the relationship between performance measurement and customer satisfaction are shown in Table 5. The results show that political stability explained 4.9 percent (ΔR2 = 0.049) on the direct effect of performance measurement on customer satisfaction. The change in the F-value caused by the intervening effect was 2.712 and was not significant since the derived p-value of 0.126 was greater than 0.05. The F-value for the intervening model was 21.825 and the derived p-value was 0.000. Since the derived p-value was less than 0.05, with table value of 2.145 as compared to a calculated value of 6.530, the hypothesis was rejected suggesting that political stability has a significant intervening effect on the relationship between performance measurement and customer satisfaction. The performance measurement variable had a t-value of 6.530 and was statistically significant while the effect of political stability had a t-value of −1.647 although not statistically significant.
A model equation of the intervening effect of political stability on the relationship between performance measurement and customer satisfaction is described in the following equation.
Customer satisfaction = −1.119 + 0.399 Performance Improvement −0.257 Political Stability.
Table 5. Intervening Effect of Political Stability.
aPredictors: (Constant), Performance Measurement. bPredictors: (Constant), Performance Measurement, Political Stability.
aDependent Variable: Customer Satisfaction. bPredictors: (Constant), Performance Measurement. cPredictors: (Constant), Performance Measurement, Political Stability.
The equation demonstrates that a unit change in performance improvement, impelled by performance measurement, will result in customer satisfaction changing by a factor of 0.399. The unit change in Political Stability contributes negatively to customer satisfaction by a factor of 0.257 though not statistically significant. In the absence of performance measurement and political stability a constant customer satisfaction of negative 1.119 would be realized.
6. Discussion
Malaysia is an empirical example of the positive impact of political stability on economic growth. The CPPS report referred to earlier observes that despite perceptions that political stability in Malaysia has been predicated on corruption and manipulation of the electoral system, the country has continued to prosper steadily. According to Heufers, (2002) [12] , Malaysia’s system is flawed in many ways―there are no checks and balances in place, with the executive branch overshadowing and controlling the legislature and judiciary, and the democratic institutions and electoral systems are evidently weak. The government avers however that political stability is the advantage that Malaysia rides on, and that foreign direct investment comes to the country precisely because of this stability. This is backed by many theories and empirical studies, as mentioned in the first section of this paper, as well as by companies stating explicitly that political stability is the main reason that attracted them to Malaysia (The Star/Asia News Network, 2010) [13] .
The report contends however, that in Asia in particular, the so-called tiger economies either have political stability that is not as democratic as the ideal is, or, they are plagued by political instability leading to much volatility in the development of their country. FIDH, (2008) [14] picks out freedom as an important aspect compromised by stability and gives as an example, Vietnam, a country that has a one-party political system and is controlled entirely by that ruling party, observing that the political stability has proved to be detrimental for the country. The economy is one of the most volatile in Asia, and what was once thought of as being a promising economy has recently proved to be in much distress and dangers. The country suffers from much inflation and is plagued by low wages, leaving workers unable to support themselves and their families. On top of that, the “politically stable” system enforces stringent barriers to personal freedoms, by not allowing workers to strike and penalizing them dramatically (FIDH, 2008) [14] . These draconian measures curtail the personal freedoms of the citizens, leaving both citizens and observers in doubt about the “democratic” nature of the country’s government. Similarly, other freedoms are also curtailed, such as freedom of the press, freedom of religion, access to the internet, and political dissent.
Back to Kenya, following positive political reforms subsequent to the post election skirmishes of 2007/08, the country has attained a stable political equilibrium that has seen growth in real GDP rise from the measly 1.7% in 2008 to the 5.6 predicted for 2016!
7. Conclusions
The preconditions for political instabilities discussed in this paper are evident in a number of countries in Africa, the Middle East and Asia. These include such countries as Somalia, Zimbabwe, Central African Republic, Mali and Chad, Libya, Myanmar, Pakistan, Afghanistan, and a number of the gulf economies including Iran and Iraq. The consequences in terms of instability in real GDP growth are demonstrated in the table and graph below:

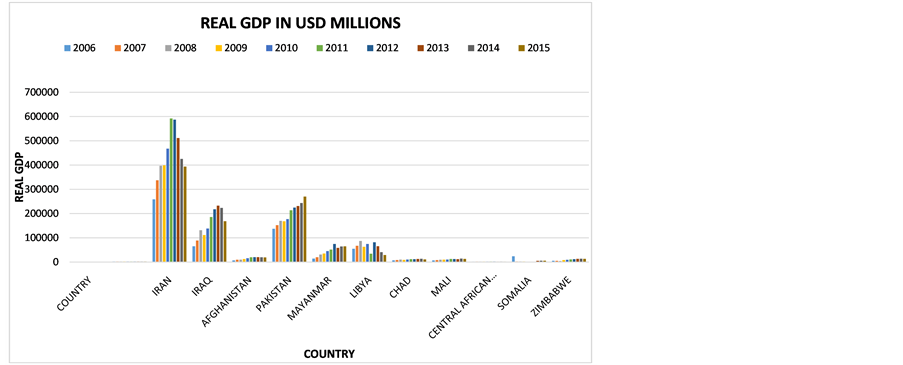
Source: World Bank.
It has however been argued that state legitimacy, the widespread public belief that the society’s governing institutions and political authorities are worthy of support should be a precondition for political stability in advanced capitalist democracies; that a regime’s legitimacy may even be a more important determinant of political stability than how well the regime actually performs (Useem and Useem, 1979: 840 [15] ). It is thus more crucial for the government to gain the general public’s trust and approval for ensuring political stability, rather than having the same ruling party over a long period of time. This study suggests that leaders of countries should pay attention to political stability, as this influences the performance of public enterprises. This in turn would motivate the private sector to enhance its performance, so that it could bring peace and prosperity to the people.
Cite this paper
Ndubai, R.E., Mbeche, I.M. and Pokhariyal, G.P. (2017) A Study of the Intervening Effect of Po- litical Stability on the Relationship between Performance Contracting and Measurement, and Public Service Delivery in Kenya. Open Access Library Journal, 4: e3402. https://doi.org/10.4236/oalib.1103402
References
- 1. Langdon, D.G. (2000) Aligning Performance: Improving People, Systems, and Organisations. Jossey-Bass Pfeifer, San Francisco.
- 2. Mayo, E. (1880-1949) Hawthorne Experiments into Employee Motivation.
- 3. Maslow, A.H. (1943) A Theory of Human Motivation. Psychological Review, 50, 370-396.
http://psychclassics.yorku.ca/Maslow/motivation.htm
https://doi.org/10.1037/h0054346 - 4. Taylor, F.W. (1856-1915) The Principles of Scientific Management. (Published in 1911)
- 5. Alesina, A., Ozler, S., Roubini, N. and Swagel, P. (1992) Political Instability and Economic Growth. National Bureau of Economic Research. September 1992, WP#4173.
- 6. Yi, F. and Chen, B. (1996) Government Capacity and Private Investment: A Study Economic Behavior. Chap. 5, Westview Press, Boulder, Colo.
- 7. Motsoeneng Manchafalo, Public Relations Manager, Lesotho Tourism Development. Corporation. Lesotho Times. “Tourism Sector Still Reeling from Instability”. 23 October 2014, p. 17.
- 8. Busse, M. and Hefeker, C. (2005) Political Risk, Institutions and Foreign Direct Investment.
- 9. Aisen, A. and Veiga, F.J. (2011) IMF Working Paper: How Does Political Instability Affect Economic Growth? International Monetary Fund Working Paper, WP/11/12.
- 10. Feng, Y. (1997) Democracy, Political Stability and Economic Growth. British Journal of Political Science, 27, 391-418.
http://www.jstor.org/stable/194123 - 11. Centre for Public Policy Studies (1992) Political Stability—An Advantage or a Curse?
- 12. Heufers, R. (2002) The Politics of Democracy in Malaysia. ASIEN, 85, 39-60.
- 13. The Star/Asia News Network (2010) French Investors See Malaysian Political Stability a Key Attraction. AsiaOne, 8 April 2010.
http://www.asiaone.com/Business/News/Story/A1Story20100408-209090.html - 14. FIDH (2008) Political Stability v. Democratic Freedom? Economic Crisis and Political Repression in Vietnam. Hearing on Cambodia, Laos and Vietnam. Sub-Commission on Human Rights, European Parliament. Brussels, 25 August 2008.
- 15. Useem, B. and Useem, M. (1979) Government Legitimacy and Political Stability. Social Forces, 57, 840-852. https://doi.org/10.2307/2577357