Surgical Science, 2011, 2, 397-401
doi:10.4236/ss.2011.27087 Published Online September 2011 (http://www.SciRP.org/journal/ss)
Copyright © 2011 SciRes. SS
Surgical Resident Attrition and the Menninger
Morale Curve
Jack Contessa1, Tassos Kyriakides2
1Department of Surgery, Hospital of Saint Raphael, New Haven, USA
2Department of Internal Medicine, Yale University School of Medicine, New Haven, USA
E-mail: jcontessa@srhs.org, tassos.kyriakides@yale.edu
Received June 23, 2011; revised July 20, 2011; accepted August 11, 2011
Abstract
BACKGROUND: Attrition in surgical residency programs continues to be a significant challenge. Ap-
proximately 20% of residents who begin a categorical surgery residency fail to complete it. A number of
studies speculated reasons for this including work hours, life style, family pressures, and resident feelings of
inadequacy including fear of termination. To date no research has been conducted investigating the relation-
ship between resident morale and attrition. This study sought to determine if this linkage exists in surgery
residents. METHODS: The Morale Assessment in General Practice Index (MAGPI) was a dministered to 21
PGY 1, 2, 3, and 5 surgical residents to assess level of morale. Non-parametric methods were carried out to
assess if there were differences in morale among the four PGY groups. Additionally, analyses of the four
factors comprising the MAGPI were also conducted. RESULTS: Although differences did not reach statis-
tical significance, analysis of the data reveals that residents demonstrate different trends in their levels of
morale based on the amount of time they spend in a residency and in a way that approximates the morale
curve described by W. Walter Menninger, M.D. Additionally, two of the four factors comprising the MAGPI
also indicate trends similar to that described by the Menninger morale curve. CONCLUSIONS: Although
no statistically significant results were achieved, the data reveal trends that approximate shifts in morale
similar to those described by the Menninger morale curve, with residents at the PGY 2 and 3 levels presen t-
ing lower morale levels than at the PGY 1 and 5 levels. This may be due in part to the size of the population
studied. Future research should be continued in this area with a larger sample size.
Keywords: Morale Assessment in General Practice Index (MAGPI), Menninger Morale Curve, Surgery
Resident Attrition
1. Introduction
The attrition rate for general surgery residents continues
to be a significant challenge for programs. Studies done
at the American Board of Surgery suggest that nationally
20 percent or more of residents who begin a categorical
surgery residency fail to complete it [1]. Similar out-
comes were reported in a single institution study of 795
medical graduates, 43 of which entered general surgery
residency programs with 7 discontinuing their training
(16% attrition rate) [2]. In their study of why residents
leave general surgery, Dodson and Webb reported that
although research in this area is limited, there have been
a number of studies that documented a fairly consistent
attrition rate between 14% to 23% [3]. In a research
study investigatin g attrition rates in residents entering US
obstetrics and gynecology residencies, McAlister et al.
quoted an ACGME census data report for the 2004 -
2005 academic year which identified general surgery
attrition rate at 5.8%—higher than obstetrics and gyne-
cology (5.1%), family medicine (4.7%), and internal
medicine (2.1%) [4]. Additionally, Longo et al. reported
an overall annual attrition rate of 6.7% in their residency
program over a 20 year period [5].
Surgery continues to have one of the highest attrition
rates of all graduate medical education programs, which
is of particular concern since it is predicted that there
will be a substantial shortage of general surgeons. Data
reported through 2005 show the population of general
surgeons across the country has already decreased from
398 J. CONTESSA ET AL.
7.68 per 100,000 population in 1981 to 5.69 per 100,000
population in 2005—a decline of almost 26% [6]. Fur-
thermore, it appears implementation of work hour re-
strictions has paradoxically exacerbated the attrition
problem. One national study of general surgery residency
programs reported that the percentage of residents lost
through attrition increased from 29% to 44% since insti-
tution of the 80-hour workweek [7].
A number of studies have speculated reasons for resi-
dent attrition including work hours, lifestyle, pressures
from family, resident feelings of inadequacy along with
the belief that they will be terminated, economic consid-
erations, and possible disconnect by medical students
about the reality of a general surgery work experience.
Additionally, it appears that the highest attrition rate oc-
curs during the first two years of training with 70% or
more taking place during this timeframe [5,7]. This is
confirmed in at least two other studies; one reported resi-
dents who left their program voluntarily often left during
or after the PGY 1 or PGY 2 year [3] and the second
study which indicated that 75% of all attrition occurred
at these levels [8]. In her survey of nearly 4500 general
surgery residents regarding attitudes, training experi-
ences, and professional expectations, Yeo reported over-
all satisfaction varied significantly across training years
with the lowest reported lev el in th e PGY 2 year (82.8%)
and the highest level in the PGY 5 year (89.7%). Also,
reports of having considered leaving training differed
significantly with th e highest in the PGY 2 year (19.2%)
and the lowest in the PGY 5 year (7.2%). Furthermore,
PGY 2 residents reported the lowest level of feeling that
they could turn to faculty when having difficulties in
their program (68.3%) while PGY 5 residents demon-
strated the highest levels (76.1 % ) [9].
Is there anything to explain the predictably high rate of
resident dissatisfaction in the early years, particularly in
the PGY 2 year? One possible explanation can be found
in the work of Dr. Walter Menninger with Peace Corps
volunteers. In order to facilitate volunteers’ readj ustment
to coming home, he held a series of “completion of ser-
vice” conferences just prior to the end of their two year
assignment. From reviewing nearly 1000 questionnaires
and reports of conference discussions, a consistent pat-
tern of psychological adjustment emerged, a pattern sub-
sequently labeled the “morale curve.” See Figure 1. Four
“crisis periods” were identified representing major peri-
ods of psychological difficulty facing the volunteer. The
outcome of the crisis could be positive or negative de-
pending upon the severity of the stress, the individual’s
coping mechanism, and the support received during the
period.
The first crisis period occurs at the beginning of the
experience and is characterized as the Crisis of Arrival.
Individuals demonstrate high levels of morale, but also
apprehension and concern about their ability to meet the
challenges. The second critical period is labeled the Cri-
sis of Engagement; at this point the individual is truly
engaged in the realities of the situation. Morale com-
Figure 1. Menninger morale curve.
Copyright © 2011 SciRes. SS
J. CONTESSA ET AL.
399
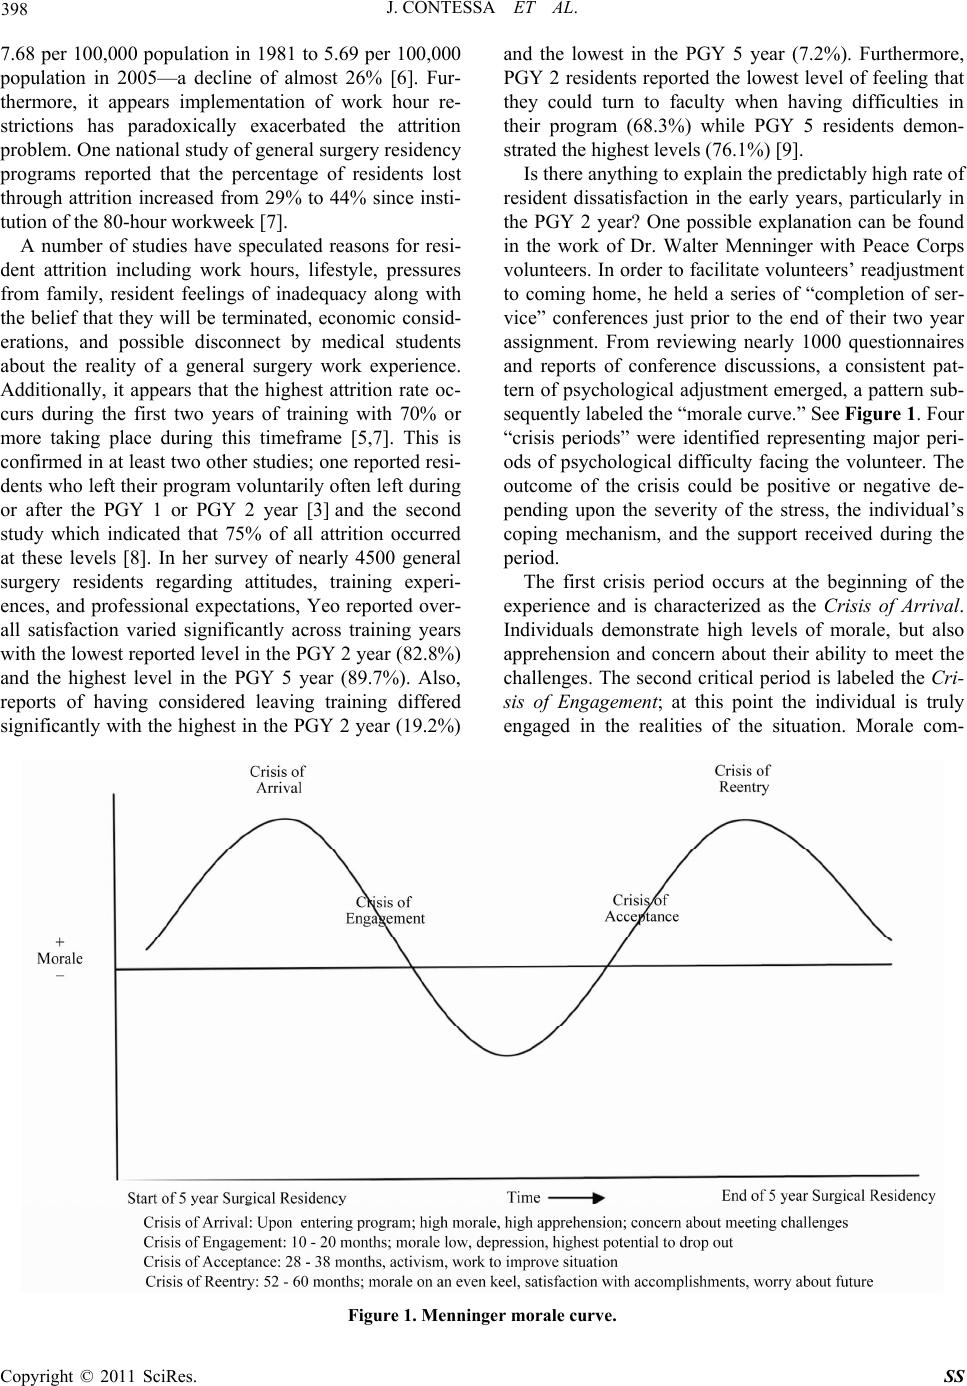
monly is low at this point due to frustrations and limited
support in the new situation. The central feature of this
stage is marked by depression. Individuals take stock of
what they left behind, of unrealized expectations of ac-
complishment, of freedom to express their frustrations.
In the Peace Corps study dropouts peaked during this
stage. The third phase wa s noted approximately half-w ay
through the experience and identified as the Crisis of
Acceptance. This stage is described as one where morale
has been restored as a result of increased knowledge and
mastery of the situation. However, emotionally the tone
is frequently one of anger and activism. Individuals
spoke out more freely and pursued changes to improve
the situation. The final crisis is labeled the Crisis of Re-
entry; morale was generally on an even keel, some satis-
faction associated with what they accomplished and with
completing their commitment, but so me depression asso-
ciated with giving up their identity and ending relation-
ships, and apprehension about an uncertain future.
Menninger indicated that the morale curve is not
unique to the Peace Corps experience, but represents a
process that all individuals undergo as they enter new life
situations. Morale follows a predictable cycle; how an
individual responds is determined by one’s position
within that cycle. He provides support that shows the
model is both universal and scalable (e.g., Stafford-
Clark’s description of the changes in the morale of flight
crew during their 30-sortie tours in World War II) [10].
To date, there has been no research investigating level
of morale of general surgery residents. This study sought
to assess level of resident morale in a general surgery
residency program at the four crisis points to determine if
a cycle similar to the Menninger morale curve is dis-
played and what the implications might be for resident
attrition.
2. Design, Methodology, and
Instrumentation
The instrument used to measure resident morale was the
Morale Assessment in General Practice Index (MAGPI).
This is a 14 question self-scoring instrument designed to
help physicians think about the sources of stress in their
lives and to give them an idea of how they compare with
their colleagues. Respondents are asked to select one of
three statements that “best reflect how you feel about
yourself.” The instrument is scored on the basis of three
points for the most stressed answer, two for intermediate,
and one for least.
MAGPI developers compared their instrument to the
General Health Questionnaire 28 (GHQ 28), which is a
well-validated measure of distress. Both instruments
were sent to 875 physicians in southeast Scotland. Total
scores for the MAGPI were well correlated with total
GHQ 28 scores (r2 = 0.68 p < 0.001). In addition, high
and intermediate scores in all MAGPI parameters (with
one exception) were significantly correlated with GHQ
28 “caseness”—a term used to describe those at risk of
psychological stress. Performing a principal component
analysis revealed four factors comprising the MAGPI:
factor 1—components of control, health, happiness, and
support from friends and worries about family; factor
2—components of being up-to-date, perceptions of value
of patients and colleagues, and career satisfaction; factor
3—components of getting along with colleagues; factor
4—concern over alcohol use. When these factors were
correlated with GHQ 28, all four factors were correlated
highly or moderately, but all demonstrated a p value of
<0.01. In summary, the MAGPI seems to stand up par-
ticularly well when validated against GHQ 28. Also, the
MAGPI was given to 50 General Practitioner trainers.
They found it easy to complete and score, felt the ques-
tions were relevant, and believed that no important pa-
rameters had been missed indicating the MAGPI also has
strong face validity and high acceptability [11].
In this study, the MAGPI was administered to a total
of 21 residents in their PGY 1, 2, 3, and 5 years. Resi-
dents completed th e instru ment in a timeframe during th e
5 year residency cycle congruent with the four crises
identified in the Menninger morale curve—PGY 1 resi-
dents in August, PGY 2 residents in October, PGY 3
residents in March and PGY 5 residents in May.
Setting
The Hospital of Saint Raphael, General Surgery Resi-
dency Program, New Haven, Connecticut. Testing dates
were announced approximately one week prior and resi-
dents reported to a conference room to complete the in-
strument.
Participants
Surgical residents of the Hospital of Saint Raphael
General Surgery Residency Program at the PGY 1, 2, 3,
and 5 levels.
3. Results and Statistical Procedures
Non-parametric methods (Kruskal-Wallis comparisons)
were carried out to assess if there were differences in
MAGPI responses among the four PGY groups. Even
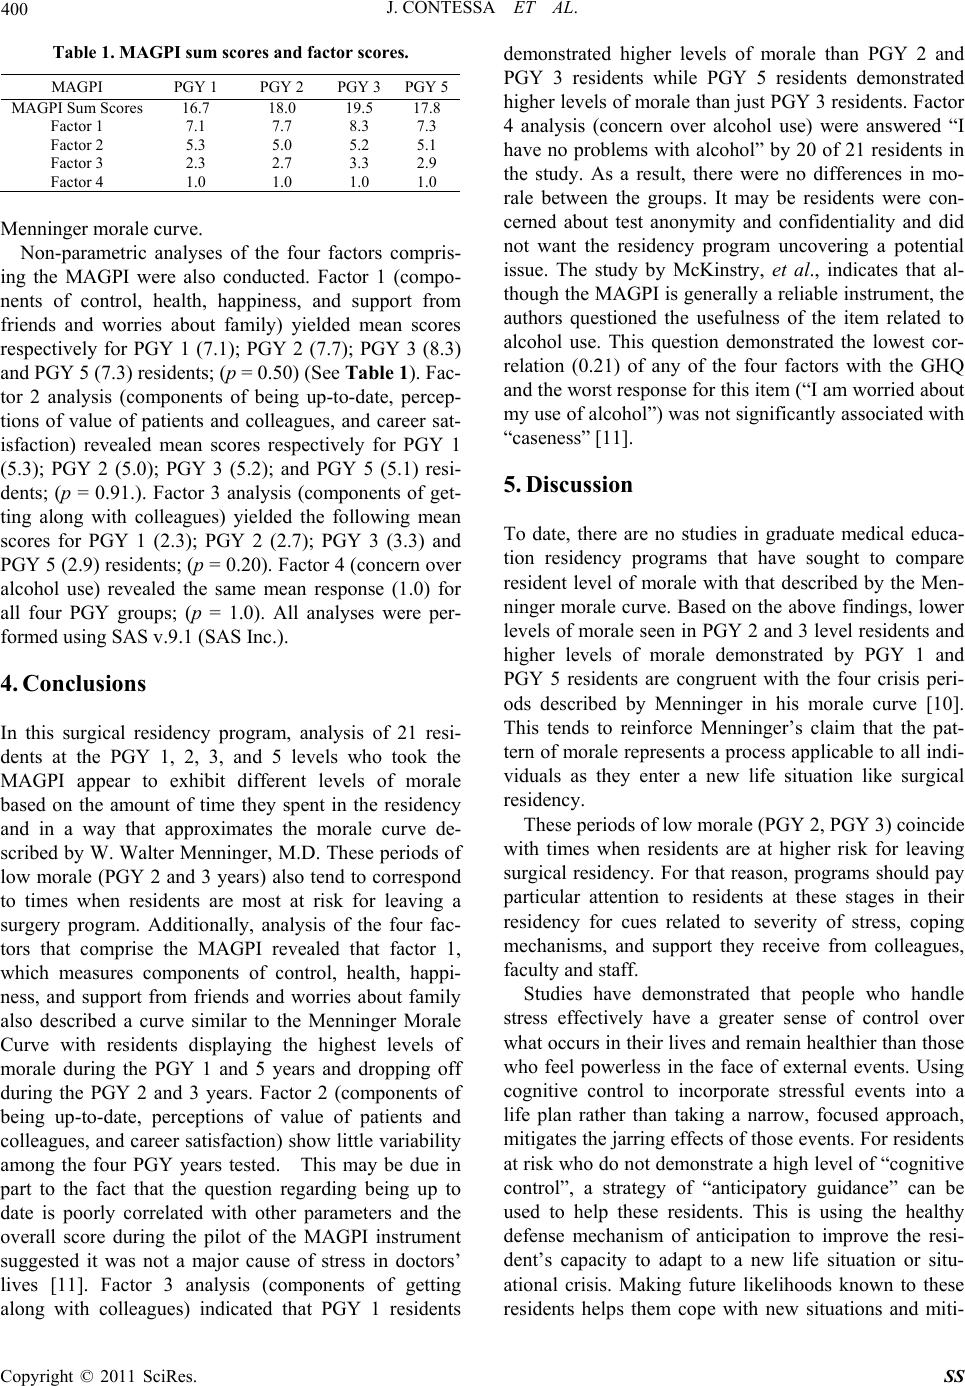
though difference in the MAGPI total means scores did
not achieve statistical significance (p = 0.3229), the
scores for PGY 1 (16.7) and PGY 5 (17.8) residents were
trending lower than PGY 2 (18.0) and PGY 3 (19.5)
scores, indicating an overall higher level of morale for
the PGY 1 and PGY 5 groups (See Table 1). These
findings describe a curve that is similar in shape to the
Copyright © 2011 SciRes. SS
400 J. CONTESSA ET AL.
Table 1. MAGPI sum scores and factor scores.
MAGPI PGY 1 PGY 2 PGY 3PGY 5
MAGPI Sum Scores 16.7 18.0 19.5 17.8
Factor 1 7.1 7.7 8.3 7.3
Factor 2 5.3 5.0 5.2 5.1
Factor 3 2.3 2.7 3.3 2.9
Factor 4 1.0 1.0 1.0 1.0
Menninger morale curve.
Non-parametric analyses of the four factors compris-
ing the MAGPI were also conducted. Factor 1 (compo-
nents of control, health, happiness, and support from
friends and worries about family) yielded mean scores
respectively for PGY 1 (7.1); PGY 2 (7.7); PGY 3 (8.3)
and PGY 5 (7. 3) r es i dents; (p = 0.50) (See Table 1). Fac-
tor 2 analysis (components of being up-to-date, percep-
tions of value of patients and colleagues, and career sat-
isfaction) revealed mean scores respectively for PGY 1
(5.3); PGY 2 (5.0); PGY 3 (5.2); and PGY 5 (5.1) resi-
dents; (p = 0.91.). Factor 3 analysis (components of get-
ting along with colleagues) yielded the following mean
scores for PGY 1 (2.3); PGY 2 (2.7); PGY 3 (3.3) and
PGY 5 (2.9) residents; (p = 0.20). Factor 4 (concern over
alcohol use) revealed the same mean response (1.0) for
all four PGY groups; (p = 1.0). All analyses were per-
formed usi n g SAS v.9. 1 ( SAS Inc.).
4. Conclusions
In this surgical residency program, analysis of 21 resi-
dents at the PGY 1, 2, 3, and 5 levels who took the
MAGPI appear to exhibit different levels of morale
based on the amount of time they spent in the residency
and in a way that approximates the morale curve de-
scribed by W. Walter Menninger, M.D. These periods of
low morale (PGY 2 and 3 years) also tend to correspond
to times when residents are most at risk for leaving a
surgery program. Additionally, analysis of the four fac-
tors that comprise the MAGPI revealed that factor 1,
which measures components of control, health, happi-
ness, and support from friends and worries about family
also described a curve similar to the Menninger Morale
Curve with residents displaying the highest levels of
morale during the PGY 1 and 5 years and dropping off
during the PGY 2 and 3 years. Factor 2 (components of
being up-to-date, perceptions of value of patients and
colleagues, and career satisfaction ) show little variability
among the four PGY years tested. This may be due in
part to the fact that the question regarding being up to
date is poorly correlated with other parameters and the
overall score during the pilot of the MAGPI instrument
suggested it was not a major cause of stress in doctors’
lives [11]. Factor 3 analysis (components of getting
along with colleagues) indicated that PGY 1 residents
demonstrated higher levels of morale than PGY 2 and
PGY 3 residents while PGY 5 residents demonstrated
higher levels of morale than just PGY 3 residents. Factor
4 analysis (concern over alcohol use) were answered “I
have no problems with alcohol” by 20 of 21 residents in
the study. As a result, there were no differences in mo-
rale between the groups. It may be residents were con-
cerned about test anonymity and confidentiality and did
not want the residency program uncovering a potential
issue. The study by McKinstry, et al., indicates that al-
though the MAGPI is generally a reliable instru ment, the
authors questioned the usefulness of the item related to
alcohol use. This question demonstrated the lowest cor-
relation (0.21) of any of the four factors with the GHQ
and the worst response for this item (“I am worried about
my use of alcohol”) was not significantly associated with
“caseness” [11].
5. Discussion
To date, there are no studies in graduate medical educa-
tion residency programs that have sought to compare
resident level of morale with that described by the Men-
ninger morale curve. Based on the ab ove findings, lower
levels of morale seen in PGY 2 and 3 level residents and
higher levels of morale demonstrated by PGY 1 and
PGY 5 residents are congruent with the four crisis peri-
ods described by Menninger in his morale curve [10].
This tends to reinforce Menninger’s claim that the pat-
tern of morale represents a process applicable to all indi-
viduals as they enter a new life situation like surgical
residency.
These periods of low morale (PGY 2, PGY 3) coincide
with times when residents are at higher risk for leaving
surgical residency. For that reason, programs should pay
particular attention to residents at these stages in their
residency for cues related to severity of stress, coping
mechanisms, and support they receive from colleagues,
faculty and staff.
Studies have demonstrated that people who handle
stress effectively have a greater sense of control over
what occurs in their lives and remain healthier th an those
who feel powerless in the face of external events. Using
cognitive control to incorporate stressful events into a
life plan rather than taking a narrow, focused approach,
mitigates the jarring effects of those events. For residents
at risk who do not demonstrate a h igh level of “cogn itive
control”, a strategy of “anticipatory guidance” can be
used to help these residents. This is using the healthy
defense mechanism of anticipation to improve the resi-
dent’s capacity to adapt to a new life situation or situ-
ational crisis. Making future likelihoods known to these
residents helps them cope with new situations and miti-
Copyright © 2011 SciRes. SS
J. CONTESSA ET AL.
Copyright © 2011 SciRes. SS
401
gates the fear and anxiety of upcoming events that are
expected to be stressful. It helps individuals put the
situation in proper perspective and reduce the sense of
isolation and helplessness that they may experience.
Residents who have gone through a similar experience
are helpful. Successful support programs should foster
opportunities for individuals to be in control of their lives,
to be committed to some activity, and to address the
challenge in ways that permit sublimation of the con-
flicted feelings generated by the life change—through
work, play, and personal relations hi p s [10].
6. Recommendations for Further Study
After having completed the research and having corre-
lated findings, conclusions, and implications, the fol-
lowing recommenda tions are made:
1) Continued research should be directed toward de-
termining linkages between resident morale and their
positions in the residency program experience.
2) Attempts should be made to duplicate this study
with larger sample sizes and in programs of different
duration.
3) Longitudinal research should be conducted tracking
the same residents as they progress through a residency
program.
7. References
[1] R. Bell, M. Banker, R. Rhodes, T. Biester and F. Lewis,
“Graduate Medical Education in Surgery in the United
States,” Surgical Clinics of North America, Vol. 87, No.
4, 2007, pp. 811-823. doi:10.1016/j.suc.2007.06.005
[2] D. A. Andriole, et al., “Attrition during Graduate Medical
Education,” Archives of Surgery, Vol. 143, No. 12, 2008,
pp. 1172-1177. doi:10.1001/archsurg.143.12.1172
[3] T. F. Dodson and A. L. Webb, “Why do Residents Leave
General Surgery? The Hidden Problem in Today’s Pro-
grams,” Current Surgery, Vol. 62, No. 1, 2005, pp.
128-131. doi:10.1016/j.cursur.2004.07.009
[4] R. P. McAlister, D. A. Andriole, S. E. Brotherton and D.
B. Jeffe, “Attrition in Residents Entering U.S. Obstetrics
and Gynecology Residencies: Analysis of GME Census
Data,” American Journal of Obstetrics and Gynecology,
Vol. 199, No. 5, 2008, pp. 574e1-574e6.
[5] W. Longo, J. Seashore, A. Duffy and R. Udelsman, “At-
trition of Categoric General Surgery Residents: Results of
a 20-Year Audit,” The American Journal of Surgery, Vol.
197, No. 6, 2009, pp. 774-778.
doi:10.1016/j.amjsurg.2008.06.038
[6] D. C. Lynge, E. H. Larson, M. J. Thompson, R. A.
Rosenblatt and L. G. Hart, “A Longitudinal Analysis of
the General Surgery Workforce in the United States
1981-2005,” Archives of Surgery, Vol. 143, No. 4, 2008,
pp. 345-350. doi:10.1001/archsurg.143.4.345
[7] C. B. Everett, S. D. Helmer, J. S. Osland and R. S. Smith,
“General Surgery Resident Attrition and the 80-Hour
Workweek,” The American Journal of Surgery, Vol. 194,
No. 6, 2007, pp. 751-757.
doi:10.1016/j.amjsurg.2007.08.033
[8] T. J. Leibrandt, C. M. Pezzi, S. A. Fassler, E. F. Reilly
and J. B. Morris, “Has the 80-Hour Work Week Had an
Impact on Voluntary Attrition in General Surgery Resi-
dency Programs?” Journal of The American College of
Surgeons, Vol. 202, No. 2, 2006, pp. 340-344.
doi:10.1016/j.jamcollsurg.2005.09.018
[9] H. Yeo, et al., “Attitudes, Training Experiences, and
Professional Expectations of US General Surgery Resi-
dents,” Jou rnal of the American Medical Association, Vol.
302, No. 12, 2009, pp. 1301-1308.
doi:10.1001/jama.2009.1386
[10] W. W. Menninger, “Adaptation and Morale, Predictable
Responses to Life Changes,” Bulletin of the Menninger
Clinic, Vol. 52, No. 3, 1988, pp. 198-210.
[11] B. McKinstry, M. Porter, R. Wrate, R. Elton and J. Shaw,
“The MAGPI (Morale Assessment in General Practice
Index): A New Way for Doctors to Self-Assess Their
Morale,” Education for Primary Care, Vol. 15, No. 2,
2004, pp. 231-241.