Energy and Power Engineering
Vol.09 No.04(2017), Article ID:75339,12 pages
10.4236/epe.2017.94B077
Predicting of Power Quality Steady State Index Based on Chaotic Theory Using Least Squares Support Vector Machine
Aiqiang Pan1, Jian Zhou1, Peng Zhang1, Shunfu Lin2, Jikai Tang2
1Electric Power Research Institute State Grid Shanghai Municipal Electric Power Company, Shanghai, China
2College of Electrical Engineering, Shanghai University of Electric Power, Shanghai, China


Received: March 6, 2017; Accepted: March 30, 2017; Published: April 6, 2017
ABSTRACT
An effective power quality prediction for regional power grid can provide valuable references and contribute to the discovering and solving of power quality problems. So a predicting model for power quality steady state index based on chaotic theory and least squares support vector machine (LSSVM) is proposed in this paper. At first, the phase space reconstruction of original power quality data is performed to form a new data space containing the attractor. The new data space is used as training samples for the LSSVM. Then in order to predict power quality steady state index accurately, the particle swarm algorithm is adopted to optimize parameters of the LSSVM model. According to the simulation results based on power quality data measured in a certain distribution network, the model applies to several indexes with higher forecasting accuracy and strong practicability.
Keywords:
Chaotic Theory, Least Squares Support Vector Machine (LSSVM), Power Quality Steady State Index, Phase Space Reconstruction, Particle Swarm Optimization

1. Introduction
The current power quality online monitoring technology is increasingly perfect. The power quality monitoring networks with hundreds of monitoring terminals have been set up in many places [1]. Huge amounts of power quality data are formed by long-term, real-time and continuous monitoring [2]. Digging Power quality monitoring data deeply and predicting power quality index of the particular region, people can be fully informed of the power quality situation, which is benefit to know regional power quality trend. For this, we can discover potential problems of electric power quality and provide forward-looking guidance for power quality early warning. Thus, it provides the reliable basis and guarantee to make the right decisions for the management of electric power quality problems [3] [4] [5].
Power quality index is divided into steady state index and transient state index. Steady state index includes voltage deviation, frequency deviation, three-phase unbalance, harmonic, voltage fluctuation and flicker. Current studies on power quality index for steady-state prediction are not many. One prediction method based on Monte Carlo sampling is proposed according to reference [6] to predict harmonic and negative sequence using real-time monitoring data. And it is effective to solve the disturbing problems of random fluctuation in traction load. In [7], the active power is predicted with ARIMA time series algorithm firstly, and then using the relationship between active power and power quality steady state index combining with neural network algorithm, we can predict the steady state index. References [1] proposed an optimal combination predicting model applying to distribution to predict future power quality conditions based on power quality monitoring data, which has a smaller error and higher forecast accuracy than a single forecast model.
Chaotic time series prediction method explores the internal relations and development change rules in data, which avoiding the subjectivity and randomness in the process of prediction [8]. On the basis of analyzing chaotic dynamics of power quality steady state index, this paper establishes a power quality steady state index prediction model based on chaotic theory and least squares support vector machine according to the characteristic objectivity. This paper also optimizes parameters of least squares support vector machine by using particle swarm algorithm to improve the prediction accuracy. At last, according to the power quality monitoring data of a regional distribution network, the feasibility of the method is validated.
2. Phase Space Reconstruction of Chaotic Time Series
After a certain period of change, the trajectory of a chaotic system will eventually make a regular motion, resulting in a regular, visible trajectory (chaotic attractor). The trajectory is then transformed into a time-dependent sequence with the chaotic and complex features after stretching and folding. Because the triggering factors of the chaotic system are interrelated, the data points that are generated successively in system are also related. Packard et al. proposed to reconstruct phase space by using the delay coordinates of a variable in the original system. The Takens theorem further proves that the regular trajectories (attractors) can be recovered in a suitable embedding dimension space, where the delay coordinate dimension m is greater than or equal 2d + 1 and d is the embedding dimension of the dynamic system.
Considering the chaotic time series x = {xi|i = 1, 2, ..., N}, m is the embedded dimension, τ is the time delay, the phase space reconstruction is then carried out to obtain a new data space.
 (1)
(1)
where M = N − (m − 1) * τ is the number of phase space.
There are mainly two kinds of views about gaining of time delay τ and embedding dimension m at present. One view is that the two parameters are not related, such as seeking the time delay of autocorrelation function method, mutual information method, the average displacement method [9], seeking the embedding dimension of the G-P algorithm, Cao method, singular value decomposition method [10]. Another view is that the two parameters are related. A large number of experiments show that the time window τω for reconstructing phase space has a close relationship with τ and m. It results in some algorithms about solving τ and m, such as embedded window method, C-C method [11]. In this paper, an improved C-C method based on [12] is adopted to reconstruct the phase space of the power quality steady state index sequence.
According to the principle of phase space reconstruction, the power quality steady state index sequence x = {xi | i = 1, 2, ..., N}, is transformed into a new data space where the dimension is m and time delay is τ.
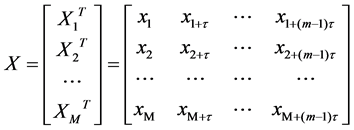 (2)
(2)
According to Takens theorem, if there are suitable embedding dimension m and time delay τ, the trajectory in the embedding space after phase space reconstruction is equivalent with the original system in the sense of differential homeomorphism [13]. So if there is a smooth mapping f,the expression of phase space trajectory is given.
 (3)
(3)
The mapping f can be expressed as a time series.
 (4)
(4)
So we can predict if the mapping relation f is figured out. Formula (4) is the mathematical model for the predicting of power quality steady state index.
3. Least Squares Support Vector Machine and Its Parameter Optimization
The least squares support vector machine (LSSVM) is an improved algorithm based on support vector machine. The optimization problem is transformed into solving the linear equation, and the quadratic programming problem is avoided by introducing the method of the equality constraint and the least squares loss function. Then the complexity of the algorithm is reduced [14].
Assuming that the training data sample is (xi, yi), I = 1, 2, … , l, where yi is the target value, xi is the input vector. And they are usually nonlinear. The least squares support vector machine maps the training sample set to a high dimensional space by a certain nonlinear mapping to transform the nonlinear function estimation problem into a linear function estimation problem in a high dimensional feature space. Assuming that the regression function is:
 (5)
(5)
where y is a nonlinear mapping function, w is the normal vector and b is the offset. The solution to the above problem can be described as follows:
 (6)
(6)
where C is the regularization parameter and ξi is a slack variable. The Lagrange function is introduced to solve the optimization problem.
 (7)
(7)
where αi is the Lagrange multiplier, the following relations can be obtained from the KKT condition.
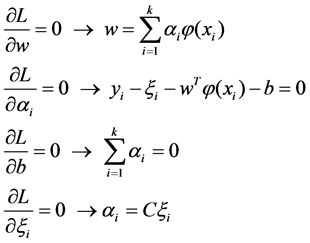 (8)
(8)
The solution of expression (8) can be changed into:
 (9)
(9)
where Q is the (k * k) order kernel matrix of element Kij, Kij = K(xi, yi) =(φ(xi), φ(xj)), I is a unit matrix, vector e = [1, … , 1]T,vector α = [α1, … , αk]T , and vector y = [y1, … , yk]T.
The equation Qn = Q + I/C is defined to obtain the expressions of α and b.
 (10)
(10)
The chaotic time series regression model of least squares support vector machine can be obtained by formula (9) and (10):
 (11)
(11)
The corresponding predicting input sample is Xp, The predicting value is:
 (12)
(12)
In this paper, radial basis function (RBF) is used as kernel function.
 (13)
(13)
And δ2 is the variance of kernel function.
Particle swarm algorithm is a swarm intelligent optimization algorithm based on predation behavior of birds. It initializes a group of random particles, and then finds the optimal solution through the iterative operation [15]. During the iterative process, the particle updates itself by tracking two extremes: the optimal solution of the particle itself pbest, the optimal solution of the whole group gbest. The update equation of particle’s velocity and position is:
 (14)
(14)
 (15)
(15)
where t is the number of iterations, Vt is the particle flight speed at the t time iteration, w is the inertia weight, xt is the current particle position at the t time iteration, r1 and r2 are the evenly distributed random number over the interval [0, 1], c1 and c2 are the learning factor for adjusting the maximum step size to the global and individual optimal particle direction respectively.
The inertia weight w reflects the ability of the particle to inherit the previous speed. A larger inertia weight favors global search while a smaller inertia weight is more conducive to local search. In order to balance global search ability and local search ability, we can introduce a linear progressive decrease inertia weight.
 (16)
(16)
where w1 is the initial inertia weight, w2 is the inertia weight while the number of iteration reaches to the maximum, k is the current iteration algebra, and Tmax is the maximum evolutionary algebra. In general, when the inertia weight w1 = 0.9, w2 = 0.4, the algorithm performance is the best. Thus during the iteration process, the inertia weight decreases linearly from 0.9 to 0.4. The larger inertia weight at the beginning of the iteration makes the algorithm maintain a strong global searching ability. And the smaller inertia weight of the iteration is beneficial to the algorithm for performing more accurate local search.
In the regression model of least squares support vector machine, the regularization parameter C and the kernel parameter δ have a great influence on the prediction accuracy and complexity of the model. The way to find the best regularization parameter and kernel function belongs to the best model problem. In this paper, particle swarm optimization is adopted to optimize least squares support vector machine parameters. The specific steps are as follows:
1) Initialize the parameters of particle swarm optimization, including population size, learning factors, the number of iterations, the initial position and speed of particles.
2) The learning samples were predicted by LSSVM corresponding to each particle vector, and the predicting error of current position value of each particle was obtained and then used as the fitness value of each particle.
3) The current fitness value of each particle is compared with optimal fitness value of the particle itself, and if it is better, the current position of the particle is taken as the optimal position of the particle.
4) The optimal position fitness value of each particle is compared with the groups’, and if it is better, the current position of the particle is taken as the optimal position of the group.
5) The inertia weights are calculated according to (16), and the velocity and position of particles are updated by using (14) and (15).
6) Check if the termination condition is met, if not, return to step 2). Or else, end the calculation and show outputs.
4. Predicting Model of Power Quality Steady State Index Based on Chaotic Theory and Lssvm
The change of power quality steady state index is affected by many factors. For example, voltage deviation is related to flow of the system, power distance, wire diameter, reactive power capacity et al. Three-phase voltage unbalance is related to system planning, load distribution structure, load characteristics et al. Flicker is related to load starting characteristics, power grid structure parameters, reactive power compensation et al. According to the monitoring data of power quality, the changing trend of power quality steady state index has certain regularity, showing quasi-periodic, aperiodic and chaotic characteristics. So a predicting model for power quality steady state index based on chaotic theory and least squares support vector machine (LSSVM) is proposed in this paper. The forecasting process is as shown in Figure 1. The specific steps are as follows:
1) Normalize the monitoring data of power quality steady-state index. Identify and correct the abnormal data.
2) According to the theory of phase space reconstruction for chaotic system, the improved C-C method [12] is adopted to seek the optimal embedding dimension m and the time delay τ. So we can then reconstruct the phase space of power quality steady-state index. The calculation of the maximum Laypunov index is worked out by means of the small-data method in order to further examine the chaotic property of power quality steady state index sequence.
3) The original sequence under phase space reconstruction is then trained using least squares support vector machine. The regularization parameter C and kernel parameter δ is optimized basing on particle swarm algorithm in chapter B.
4) Predict power quality steady state index and analyze the error using the well trained least squares support vector machine model.

Figure 1. Flowchart of power quality steady indicators prediction.
5. Case Study
This paper chooses power quality data collected from the power quality monitoring system of a city power grid to be the basic sample. Taking the voltage deviation for example, the predicting process of the power quality steady state index is introduced. Figure 2 is the voltage deviation time sequence obtained in a 220 kV substation monitoring point from January 1st, 2014 to December 31st, 2015. Basing on above-mentioned experimental samples, we will predict the voltage deviation for the next 15 days.
The phase space reconstruction parameters of voltage deviation time series are calculated by the improved C-C method [12], and the results are shown in Figure 3. The improved C-C method is adopted to determine time delay τ and embedding dimension m. The first local minimum of  can be as the optimal time delay τd and the periodic point of
  can be as the optimal embedding window τw. According to the formula τw = (m − 1) τd, the optimal embedding dimension m is got. From the Figure 3, we can know τd = 12, τw = 96 and m = 9.
In order to test the chaotic characteristic of the sequence, the maximum Lyapunoy index of voltage deviation time series is calculated by the small-data method according to the obtained optimal time delay τ and embedding dimension m. The results are shown in Figure 4.
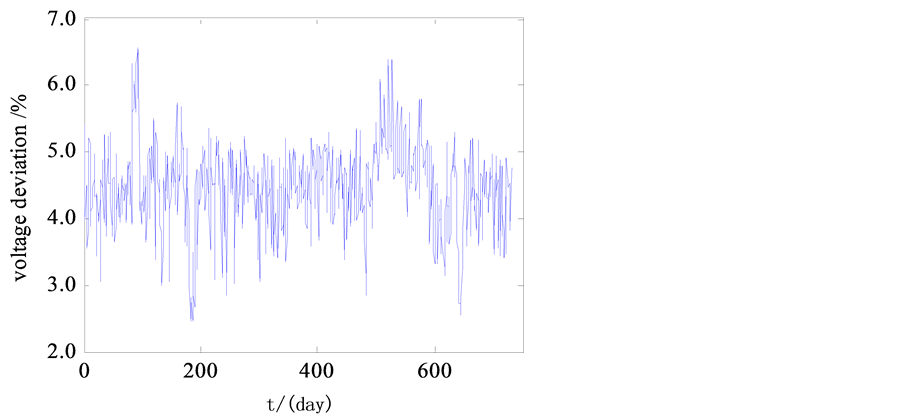
Figure 2. Time series of original voltage deviation.
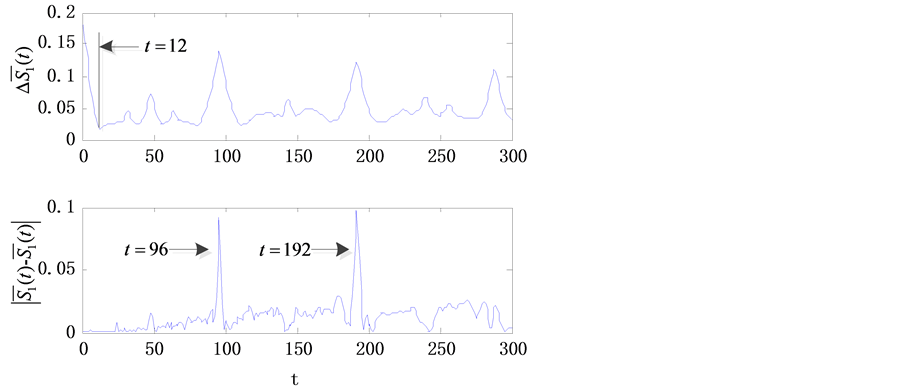
Figure 3. Improved C-C method of reconstruction parameters.
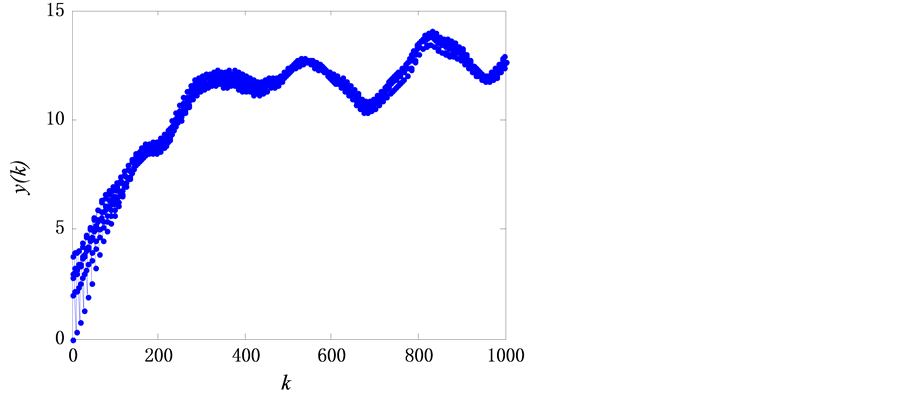
Figure 4. Maximal Lyapunov exponent curve of voltage deviation time series.
In Figure 4, k is the evolution step of discrete time, y(k) is the distance logarithmic mean. Figure 4 shows that the long curve before k = 200 is nearly linear, whose slope is the largest Lyapunov index of voltage deviation time series. Furthermore, the slope of the line is 0.045 > 0, which verifies the selected voltage deviation time series is chaotic time series with chaos characteristic.
According to the theory of phase space reconstruction, make time delay τ = 12 and embedding dimension m = 9 to restructure the original 730 data, consequently get 634 points which are used to be the training sample of least squares support vector machine. The prediction effect of least squares support vector machine model has a great relationship with the choice of its own parameters. So this paper optimizes the parameters of least squares support vector machine model based on particle swarm optimization introduced in chapter B. In particle swarm optimization model, make the population number N = 30, learning factor c1 = c2 =1.5, maximum generation Tmax = 300, inertia weight w1 =0.9, w2 = 0.4, and set the regularization parameter C Î [0, 500] and the kernel parameter δ Î [0, 100]. By updating the current optimal position of the particle continuously, the optimal parameter C = 73.157 and δ = 0.732 are obtained.
The optimal regularization parameter C and kernel parameter δ are used in least squares support vector machine model to predict the voltage deviation for the next 15 days from January 1st to 15th, 2016. In order to verify the feasibility of the proposed method, the BP neural network algorithm is compared with the method in this paper. The results are shown in Figure 5.
Table 1 is the prediction results of the voltage deviation based on the BP neural network method and the method of this paper. In order to quantify the accuracy of the analysis, the average relative error is introduced and its expression is as follows:
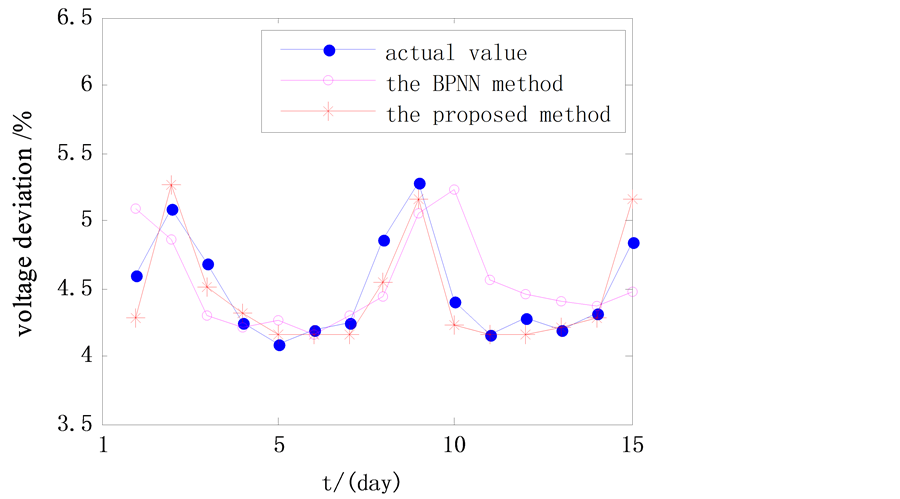
Figure 5. Predicting results of voltage deviation.

Table 1. Predicting results of voltage deviation.
 (17)
(17)
It can be seen from Figure 5, the prediction results of proposed method based on chaotic theory and least squares support vector machine model are closer to the true value, and better reflect the changing trend of the voltage deviation. At the same time, from the Table 1, the average relative error of prediction results based on the proposed method is 2.97%, which is reduced by 2.92% compared with the BP neural network method. Therefore, the prediction accuracy has been improved obviously.
According to the prediction process of voltage deviation time series, select power quality steady state index: total harmonic voltage distortion rate (THD), three-phase voltage unbalance (εu), flicker (Plt) and use the proposed method to predict. The predicting results are shown in Table 2.
As it can be seen from Table 2, the predicting results of both total voltage harmonic distortion and three-phase voltage unbalance are close to the real value based on the proposed prediction model and their average relative error was about 5%. The average relative error of flicker is 9.18%. The prediction accuracy of each index is different, but the average relative error is controlled within 10%, which can meet the engineering requirements.
Table 2. Result of power quality steady state indicators prediction.
6. Conclusion
On the basis of analyzing chaotic dynamics of power quality steady state index, this paper establishes a power quality steady state index prediction model based on chaotic theory and least squares support vector machine according to the characteristic objectivity. This paper also optimizes parameters of least squares support vector machine by using particle swarm algorithm to improve the prediction accuracy. This method does not consider many factors which influence the change of power quality steady state index directly and analysis the historical data of each index instead to reduce the prediction complexity and cost.
Based on the power quality data measured in real time from the monitoring system of a distribution network, the model is verified. The results show that the proposed method can effectively predict the change trend of power quality steady state index series. The average relative error of index prediction was controlled within 10%, which can provide valuable references for mastering the trend of power quality and promoting solution of power quality problems.
Support
Support by National Natural Science Foundation of China (51207088) and State Grid Corporation of China project (520940150010).
Cite this paper
Pan, A.Q., Zhou, J., Zhang, P., Lin, S.F. and Tang, J.K. (2017) Predicting of Power Quality Steady State In- dex Based on Chaotic Theory Using Least Squares Support Vector Machine. Energy and Power Engineering, 9, 713-724. https://doi.org/10.4236/epe.2017.94B077
References
- 1. Ding, Z.J., Liu, P., Ou-Yang, S., et al. (2015) Mechanism of Power Quality Forecast and Early Warning and Their Application. Pro-ceedings of the CSU-EPSA, 27, 87-92.
- 2. Liu, Y., Zhou, L.W. and Feng, H. (2010) Method for Compressing Recorded Data from Power Quality Monitoring Network. Power System Technology, 34, 199-203.
- 3. Pei, L., Zheng, J.H., Sun, Y. (2008) Study on Power Quality Comprehensive Monitoring and Management System. Power System Protection and Control, 36, 49-53.
- 4. Wang, L., Kang, J., Zou, H.L., et al. (2011) Construction and Application of Real-Time Power Quality Monitoring System. Power System Protection and Control, 39, 108-111.
- 5. Wang, F., Gu, W., Yuan, X.D., et al. (2012) Power Quality Management Platform for Smart Grid. Electric Power Automation Equipment, 32, 134-139.
- 6. Qin, H.T., Li, Q.Z., Liu, Y., et al. (2011) Prediction of the Power Quality Caused by Electrified Railways Based on Monte Carlo. Power System Protection and Control, 39, 64-70.
- 7. Su, W.W., Ma, S.X. and Qi, L.H. (2014) Predicting of Power Quality Steady Indicators Based on ARIMA and Neural Network. Computer Technology and Development, 24, 163-16.
- 8. Jiang, Y.C., Zhang, B.J., Xing, F.F., et al. (2015) Super-short-term multi-step Predic-tion of Wind Power Based on GA-VNN model of Chaotic Time Series. Power System Technology, 39, 2160-2166.
- 9. Du, J., Lu, J.G. and Cao, Y.J. (2006) Determination of Forecasted Values of Short-Term Load Forecasting Model Based on Largest Lyapunov Exponent. Power System Technology, 30, 20-24.
- 10. Yang, Z.L., Tian, Y. and Lin, K.Y. (2004)Application of Multi-Step Regression Considering Climate Factors in Method Synthesizing Double Periods and Chaotic Components to Short Term Load Forecasting. Power System Technology, 28, 20-24.
- 11. Tao, J., Zhang, H., Zhu, G.R., et al. (2011) Wind Power Prediction Based on Technology of Advanced Phase Space Reconstruction. Proceedings of the CSEE, 31, 9-14.
- 12. Lu, Z.B., Cai, Z.M. and Jiang, K.Y. (2007) Determination of Embedding Parameters for Phase Space Reconstruction Based on Improved C-C Method. Journal of System Simulation, 11, 2527-2529.
- 13. Wang, D.Y., Yang, Z., Yang, G.Q. (2008) Short-term Load Forecasting Basedon Chaotic Characteristic of Loads and Least Squares Support Vector Machines. Power System Technology, 32, 66-71.
- 14. Huang, Y.H., Wang, L.J. and Yang, X.M. (2015) Research on Short Term Wind Speed Prediction Model Based on Chaotic Time Series Using Support Vector Machine. Electrical Measurement & Instrumentation, 52, 32-37.
- 15. Sun, B., Yao and H.T. (2012) The Short-Term Wind Speed Forecast Analysis Based on the Pso-Lssvm Predict Model. Power System Protection and Control, 40, 85-89.