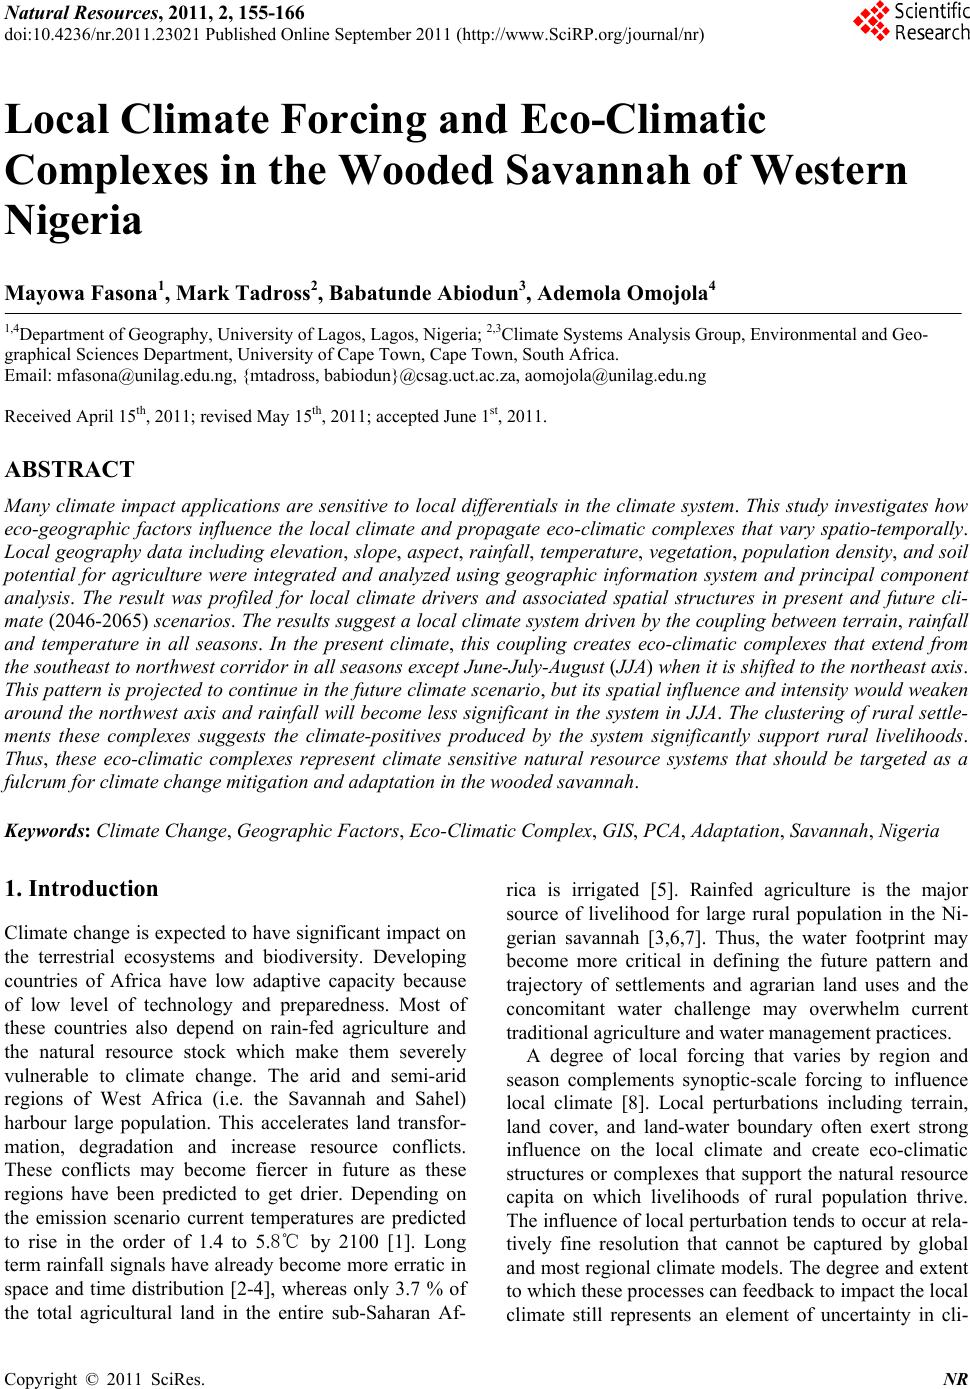
 Natural Resources, 2011, 2, 155-166 doi:10.4236/nr.2011.23021 Published Online September 2011 (http://www.SciRP.org/journal/nr) Copyright © 2011 SciRes. NR 155 Local Climate Forcing and Eco-Climatic Complexes in the Wooded Savannah of Western Nigeria Mayowa Fasona1, Mark Tadross2, Babatunde Abiodun3, Ademola Omojola4 1,4Department of Geography, University of Lagos, Lagos, Nigeria; 2,3Climate Systems Analysis Group, Environmental and Geo- graphical Sciences Department, University of Cape Town, Cape Town, South Africa. Email: mfasona@unilag.edu.ng, {mtadross, babiodun}@csag.uct.ac.za, aomojola@unilag.edu.ng Received April 15th, 2011; revised May 15th, 2011; accepted June 1st, 2011. ABSTRACT Many climate impact applications are sensitive to local differentials in the climate system. This study investigates how eco-geographic factors influence the local climate and propagate eco-climatic complexes that vary spatio-temporally. Local geography data including elevation, slope, aspect, rainfall, temperature, vegetation, population dens ity, and soil potential for agriculture were integrated and analyzed using geographic information system and principal component analysis. The result was profiled for local climate drivers and associated spatial structures in present and future cli- mate (2046-2065) scenarios. The results sugg est a local climate system driven by the couplin g between terrain, rainfa ll and temperature in all seasons. In the present climate, this coupling creates eco-climatic complexes that extend from the southeast to northwest corridor in all seasons except June-July-August (JJA) when it is shifted to the northeast axis. This pattern is projected to continue in the future clima te scenario, but its spa tial influence and intens ity would weaken around the northwest axis and rainfall will become less significant in the system in JJA. The clustering of rural settle- ments these complexes suggests the climate-positives produced by the system significantly support rural livelihoods. Thus, these eco-climatic complexes represent climate sensitive natural resource systems that should be targeted as a fulcrum for climate change mitigation and adaptation in the wooded savannah . Keywords: Climate Change, Geographic Factors, Eco-Climatic Complex, GIS, PCA, Adaptation, Savannah, Nigeria 1. Introduction Climate change is expected to have significant impact on the terrestrial ecosystems and biodiversity. Developing countries of Africa have low adaptive capacity because of low level of technology and preparedness. Most of these countries also depend on rain-fed agriculture and the natural resource stock which make them severely vulnerable to climate change. The arid and semi-arid regions of West Africa (i.e. the Savannah and Sahel) harbour large population. This accelerates land transfor- mation, degradation and increase resource conflicts. These conflicts may become fiercer in future as these regions have been predicted to get drier. Depending on the emission scenario current temperatures are predicted to rise in the order of 1.4 to 5.8℃ by 2100 [1]. Long term rainfall signals have already become more erratic in space and time distribution [2-4], whereas only 3.7 % of the total agricultural land in the entire sub-Saharan Af- rica is irrigated [5]. Rainfed agriculture is the major source of livelihood for large rural population in the Ni- gerian savannah [3,6,7]. Thus, the water footprint may become more critical in defining the future pattern and trajectory of settlements and agrarian land uses and the concomitant water challenge may overwhelm current traditional agriculture and water management practices. A degree of local forcing that varies by region and season complements synoptic-scale forcing to influence local climate [8]. Local perturbations including terrain, land cover, and land-water boundary often exert strong influence on the local climate and create eco-climatic structures or complexes that support the natural resource capita on which livelihoods of rural population thrive. The influence of local perturbation tends to occur at rela- tively fine resolution that cannot be captured by global and most regional climate models. The degree and extent to which these processes can feedback to impact the local climate still represents an element of uncertainty in cli- 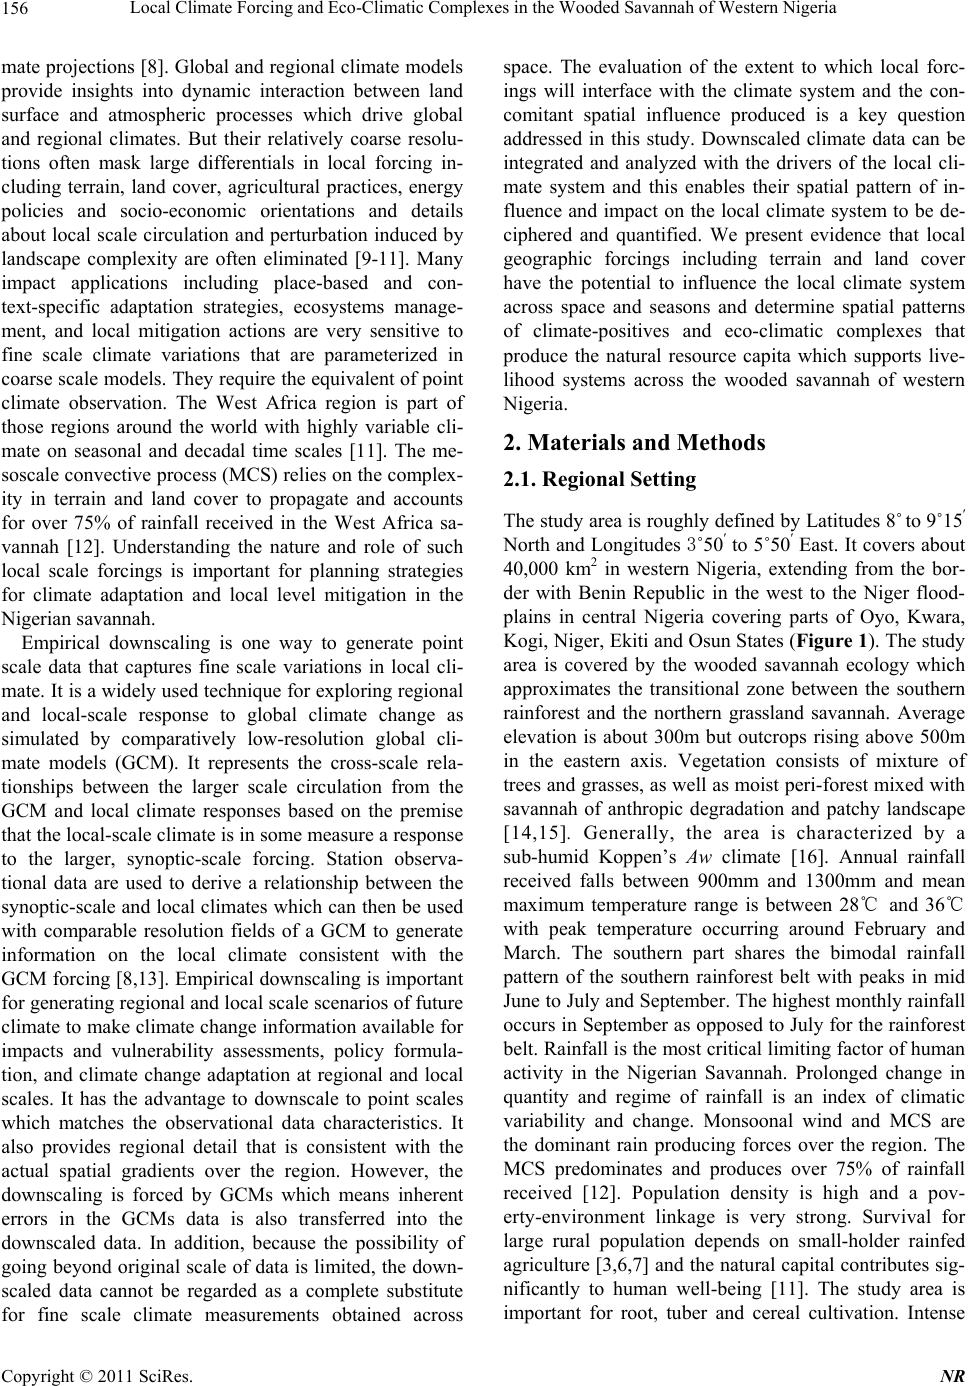 Local Climate Forcing and Eco-Climatic Complexes in the Wooded Savannah of Western Nigeria 156 mate projections [8]. Global and regional climate models provide insights into dynamic interaction between land surface and atmospheric processes which drive global and regional climates. But their relatively coarse resolu- tions often mask large differentials in local forcing in- cluding terrain, land cover, agricultural practices, energy policies and socio-economic orientations and details about local scale circulation and perturbation induced by landscape complexity are often eliminated [9-11]. Many impact applications including place-based and con- text-specific adaptation strategies, ecosystems manage- ment, and local mitigation actions are very sensitive to fine scale climate variations that are parameterized in coarse scale models. They require the equivalent of point climate observation. The West Africa region is part of those regions around the world with highly variable cli- mate on seasonal and decadal time scales [11]. The me- soscale convective process (MCS) relies on the complex- ity in terrain and land cover to propagate and accounts for over 75% of rainfall received in the West Africa sa- vannah [12]. Understanding the nature and role of such local scale forcings is important for planning strategies for climate adaptation and local level mitigation in the Nigerian savannah. Empirical downscaling is one way to generate point scale data that captures fine scale variations in local cli- mate. It is a widely used technique for exploring regional and local-scale response to global climate change as simulated by comparatively low-resolution global cli- mate models (GCM). It represents the cross-scale rela- tionships between the larger scale circulation from the GCM and local climate responses based on the premise that the local-scale climate is in some measure a response to the larger, synoptic-scale forcing. Station observa- tional data are used to derive a relationship between the synoptic-scale and local climates which can then be used with comparable resolution fields of a GCM to generate information on the local climate consistent with the GCM forcing [8,13]. Empirical downscaling is important for generating regional and local scale scenarios of future climate to make climate change information available for impacts and vulnerability assessments, policy formula- tion, and climate change adaptation at regional and local scales. It has the advantage to downscale to point scales which matches the observational data characteristics. It also provides regional detail that is consistent with the actual spatial gradients over the region. However, the downscaling is forced by GCMs which means inherent errors in the GCMs data is also transferred into the downscaled data. In addition, because the possibility of going beyond original scale of data is limited, the down- scaled data cannot be regarded as a complete substitute for fine scale climate measurements obtained across space. The evaluation of the extent to which local forc- ings will interface with the climate system and the con- comitant spatial influence produced is a key question addressed in this study. Downscaled climate data can be integrated and analyzed with the drivers of the local cli- mate system and this enables their spatial pattern of in- fluence and impact on the local climate system to be de- ciphered and quantified. We present evidence that local geographic forcings including terrain and land cover have the potential to influence the local climate system across space and seasons and determine spatial patterns of climate-positives and eco-climatic complexes that produce the natural resource capita which supports live- lihood systems across the wooded savannah of western Nigeria. 2. Materials and Methods 2.1. Regional Setting The study area is roughly defined by Latitudes 8˚ to 9˚15′ North and Longitudes 3˚50′ to 5˚50′ East. It covers about 40,000 km2 in western Nigeria, extending from the bor- der with Benin Republic in the west to the Niger flood- plains in central Nigeria covering parts of Oyo, Kwara, Kogi, Niger, Ekiti and Osun States (Figure 1). The study area is covered by the wooded savannah ecology which approximates the transitional zone between the southern rainforest and the northern grassland savannah. Average elevation is about 300m but outcrops rising above 500m in the eastern axis. Vegetation consists of mixture of trees and grasses, as well as moist peri-forest mixed with savannah of anthropic degradation and patchy landscape [14,15]. Generally, the area is characterized by a sub-humid Koppen’s Aw climate [16]. Annual rainfall received falls between 900mm and 1300mm and mean maximum temperature range is between 28℃ and 36℃ with peak temperature occurring around February and March. The southern part shares the bimodal rainfall pattern of the southern rainforest belt with peaks in mid June to July and September. The highest monthly rainfall occurs in September as opposed to July for the rainforest belt. Rainfall is the most critical limiting factor of human activity in the Nigerian Savannah. Prolonged change in quantity and regime of rainfall is an index of climatic variability and change. Monsoonal wind and MCS are the dominant rain producing forces over the region. The MCS predominates and produces over 75% of rainfall received [12]. Population density is high and a pov- erty-environment linkage is very strong. Survival for large rural population depends on small-holder rainfed agriculture [3,6,7] and the natural capital contributes sig- nificantly to human well-being [11]. The study area is important for root, tuber and cereal cultivation. Intense Copyright © 2011 SciRes. NR 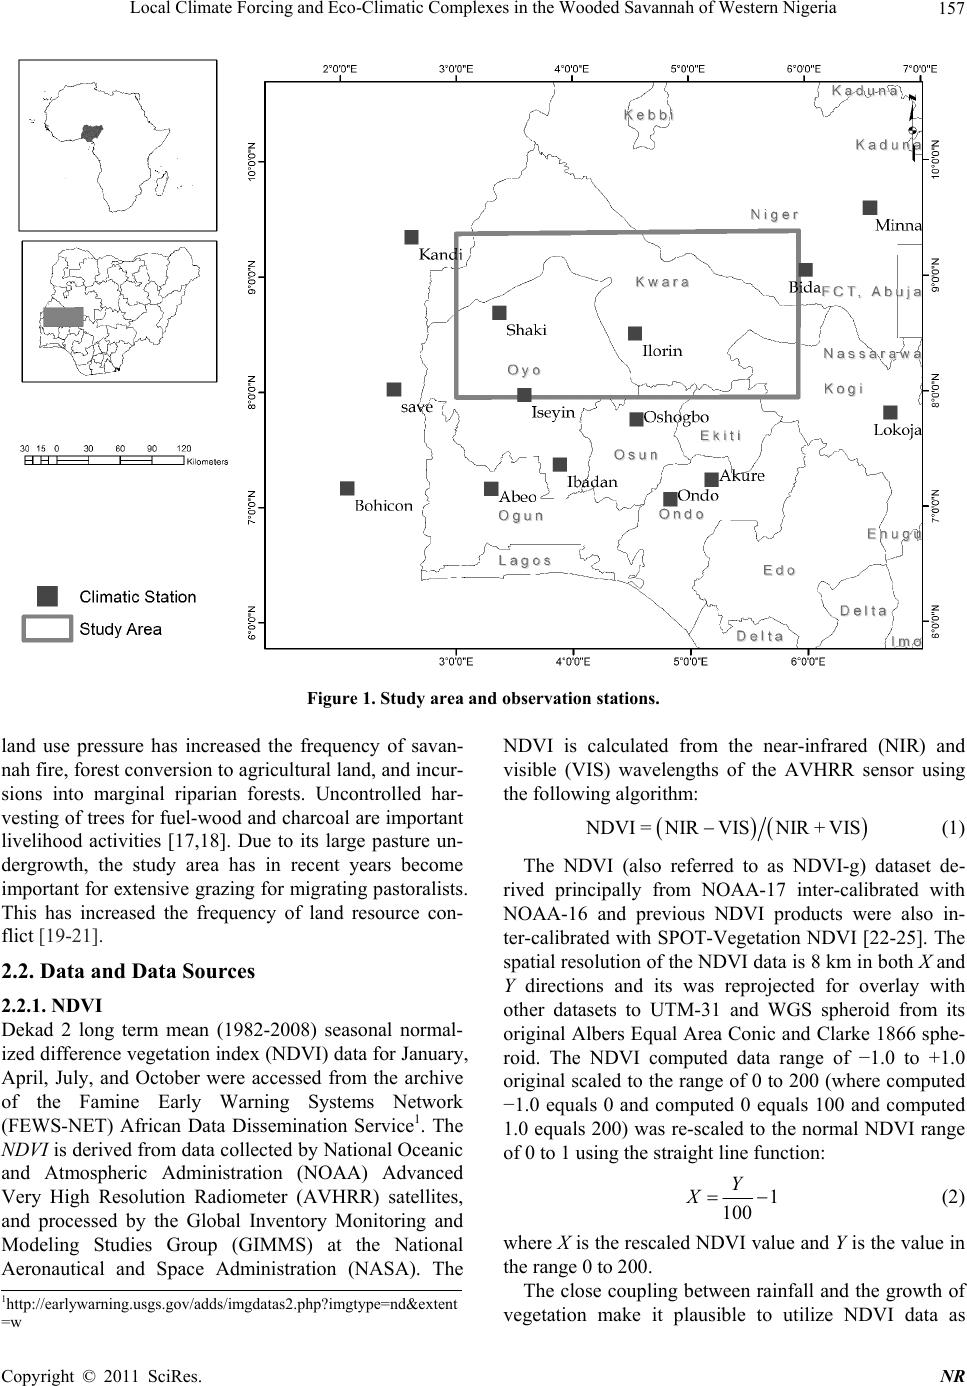 Local Climate Forcing and Eco-Climatic Complexes in the Wooded Savannah of Western Nigeria 157 Figure 1. Study area and observation stations. land use pressure has increased the frequency of savan- nah fire, forest conversion to agricultural land, and incur- sions into marginal riparian forests. Uncontrolled har- vesting of trees for fuel-wood and charcoal are important livelihood activities [17,18]. Due to its large pasture un- dergrowth, the study area has in recent years become important for extensive grazing for migrating pastoralists. This has increased the frequency of land resource con- flict [19-21]. 2.2. Data and Data Sources 2.2.1. NDVI Dekad 2 long term mean (1982-2008) seasonal normal- ized difference vegetation index (NDVI) data for January, April, July, and October were accessed from the archive of the Famine Early Warning Systems Network (FEWS-NET) African Data Dissemination Service1. The NDVI is derived from data collected by National Oceanic and Atmospheric Administration (NOAA) Advanced Very High Resolution Radiometer (AVHRR) satellites, and processed by the Global Inventory Monitoring and Modeling Studies Group (GIMMS) at the National Aeronautical and Space Administration (NASA). The NDVI is calculated from the near-infrared (NIR) and visible (VIS) wavelengths of the AVHRR sensor using the following algorithm: NDVI=NIRVISNIR+VIS (1) The NDVI (also referred to as NDVI-g) dataset de- rived principally from NOAA-17 inter-calibrated with NOAA-16 and previous NDVI products were also in- ter-calibrated with SPOT-Vegetation NDVI [22-25]. The spatial resolution of the NDVI data is 8 km in both X and Y directions and its was reprojected for overlay with other datasets to UTM-31 and WGS spheroid from its original Albers Equal Area Conic and Clarke 1866 sphe- roid. The NDVI computed data range of −1.0 to +1.0 original scaled to the range of 0 to 200 (where computed −1.0 equals 0 and computed 0 equals 100 and computed 1.0 equals 200) was re-scaled to the normal NDVI range of 0 to 1 using the straight line function: 1 100 Y X (2) where X is the rescaled NDVI value and Y is the value in the range 0 to 200. The close coupling between rainfall and the growth of vegetation make it plausible to utilize NDVI data as 1http://earlywarning.usgs.gov/adds/imgdatas2.php?imgtype=nd&extent =w Copyright © 2011 SciRes. NR  Local Climate Forcing and Eco-Climatic Complexes in the Wooded Savannah of Western Nigeria 158 proxy for land surface response to precipitation variabil- ity and changes in the biophysical properties of vegeta- tion [25-27]. 2.2.2. Terrain Terrain data was extracted from the 3 arc-second eleva- tion data from the Shuttle Radar Topography Mission (SRTM) obtained in February 2000 and accessed from the archive of the global land cover facility2. The world reference systems (WRS-2) scenes SRTM_ffB03, p190r054 and p190r054 were downloaded and processed to obtain derivatives including contour and spot heights, slope, and aspect. 2.2.3. Climate Data for historical daily rainfall and maximum tempera- ture (1960 to 2005) for 12 climatic stations around the study area was sourced from the Nigerian Meteorological Agency (NIMET) in Lagos. Because the study area is adjacent to the Nigeria/Benin Republic border, rainfall and maximum temperature data was also sourced for 3 adjacent stations in Benin Republic from the portal of the Climate Systems Analysis Group (CSAG) of the Univer- sity of Cape Town to improve the surface interpolation process. Statistical downscaling of the climate data was carried out in CSAG. The statistical downscaling tech- nique employed matching of GCM data with self organ- ized map (SOM) characterization of atmospheric states and forced by SRES A2 emissions scenario (8,Hewitson and Crane 2006). The driving GCMs were adopted from the Coupled Model Intercomparison Project Phase Three (CMIP3) archive3, which makes statistical downscaling possible for the non-seamless periods 2046-2065 (near future) and 2081-2100 (far future) only. The statistical downscaling process reproduced the observational data and also generated both near-future and far-future pro- jections for 10 GCMs plus NCEP reanalysis. Studies that compare climate model output often use ensemble sets of all the models. A comparability study of 18 GCM out- puts (including all the 10 generated by the downscaling process) at the process level by [28] suggests that the MRI CGCM 2.3.2 model provides the most reliable simulation of the twenty-first century climate over West Africa. The MRI CGCM 2.3.2 model was thus adopted to characterize the future climate. The comparison be- tween the model output and the observation data and NCEP reanalysis suggests a significant agreement in spa- tial and temporal pattern of rainfall and maximum tem- perature across the study area. 2.2.4. Other Datasets Data on forested lands, protected areas, disturbance index, potential of soils for agriculture, and population density were also developed and integrated. Forested and pro- tected areas were extracted from Landsat TM and ETM+ data. Disturbance indices were computed by criteria evaluation of 12 land cover categories derived from the Landsat imageries. The land cover categories were ana- lyzed according to current state and the extent to which they have been, or are likely to be impacted by human activity. Soil data extracted from the 1:650,000 digital Soils map of western Nigeria sourced from Soils Survey Division of the Ministry of Agriculture and Natural Re- sources was analyzed for the ability of each pedologic unit to support crop production. Population density data was computed at local government level using data from the 2006 census collated from the National Population Commission. 2.3. Procedure The GIS as a tool for data integration and analysis sup- ports the building of multiple spatial data layers. Features extracted and derivates generated from all data layers are integrated to generate composite results that reveal spa- tial pattern and processes that are not discernable in indi- vidual data layers. The datasets were analyzed to produce gridded derivatives which were integrated into a common GIS database for collocation analysis (Figure 2). The output from the gridded derivatives was exported in AS- CII text to statistical software and subjected to principal component analysis (PCA). The seasonal correlations and principal factors were generated and the result was transferred back into GIS for spatial interpolation to de- rive PCA maps. PCA is an exploratory multivariate sta- tistics that transforms series of variables into a set of components that are orthogonal in both time and space and ordered them in terms of the amount of variance they explain from the series. It is a powerful technique for analyzing variability over space and time [29] and very effective in organizing the underlying sources of vari- ability in data. PCA has been used in related studies on variability in data with climatic and ecological signifi- cance and air pollution [30,31], biological diversity [32,33], groundwater and geochemical data variability [34,35], and sources of heavy metals in soil [36]. The seasonal NDVI data produced 798 grid data points which was adopted as the frame for extracting point val- ues (in ASCII) from all the other gridded datasets (rain- fall, maximum temperature, aspect, slope, contour, agri- cultural potential of soils, population density, protected areas, forested areas, and disturbance indexes). The AS- CII values extracted were digitally written into the attrib- ute files of the seasonal NDVI data. This process pro- duced a collocated attribute data tables with data fields for the seasonal NDVI and all other datasets. This ex- 2http://www.landcover.org/data/srtm/ 3http://www.pcmdi.llnl.gov/projects/cmip/Table.php Copyright © 2011 SciRes. NR  Local Climate Forcing and Eco-Climatic Complexes in the Wooded Savannah of Western Nigeria 159 Figure 2. The framework for integration of eco-geographic variables for PCA. tended attribute data files were imported into STATIS- TICA® 9 software4 and subjected to PCA. With the ei- genvalues cut-off set at 1, the correlation matrix option produced standardized PCA. The slope of the scree plot was used to decide the number of factors to retain in each case thereby eliminating inconsequential principal com- ponents. Factor coordinates for all cases were transferred into GIS and PCA surfaces were generated using the in- verse distance weights (IDW) spatial interpolation algo- rithm. Efficient computation of PCA is done with matrix al- gebra and starts with a matrix of inter-correlations which produces standardized PCA. Data reduction is achieved by finding linear combinations (principal components) of the original variables which account for as much of the original total variance as possible given by: 112 2 PCV VV ii ini aa a n (3) where PCi is principal component i and a1i is the loading (correlation coefficient) of the original variable V1 [31]. The successive linear combinations are extracted in such a way that they are uncorrelated with each other and account for successive smaller amounts of total variance [31]. 3. Results 3.1. Pattern of Feedbacks Between Climate and Eco-Geographic Factors The feedbacks and associated spatial patterns created by the interaction between climatic elements and eco-geo- graphical variables are critical for planning adaptation to climate change especially at local levels. The regional climate of the wooded savannah is strongly influenced the MCS, a coupled system of local processes including the influence of terrain, land-cover and moisture gradi- ent. The seasonal correlations across space between rain- fall and maximum temperature on one hand, and NDVI and elevation on the other are shown on Tables 1 and 2 respectively for present and future climates. NDVI is positively correlated with elevation (r = 0.56, p < 0.01) and rainfall (r = 0.53, p < 0.01) in March- April-May (MAM). MAM represents the onset of the rains when the wooded savannah recovers after the dry period of December-January-February (DJF). The more rainfall experienced during this period the greener the region becomes. Elevated areas normally have higher chance of receiving early rainfall due to the strong effect of MCS which requires the lifting force provided by ter- rain to produce rain. This may also explain why some areas around relatively rugged terrain are wetter than the surrounding areas. This well known relationship between terrain and cli- mate is also demonstrated by the positive correlation between elevation and rainfall and the negative correla- tion of elevation with temperature (in all seasons) except in June-July-August (JJA) when the pervading system is reversed. Thus rainfall shows strong negative correlation with elevation (r = −0.62, p < 0.01) and strong positive correlation with Tmax (r = 0.76 p < 0.01) in JJA. This strongly suggests the dominance of the West African monsoon (WAM) system in JJA. Normally, the MCS requires a local forcing such as higher altitude or vegeta- tion to lift the gathered moisture to saturation, condensa- tion and precipitation stages. However, in JJA because of the influence of the WAM system which predominates during this period, the influence of MCS and the local forcings are weakened because the atmosphere is satu- rated already. Hence, less rainfall is produced by the lo- cal systems even at higher altitudes. 4www.statsoft.com Copyright © 2011 SciRes. NR 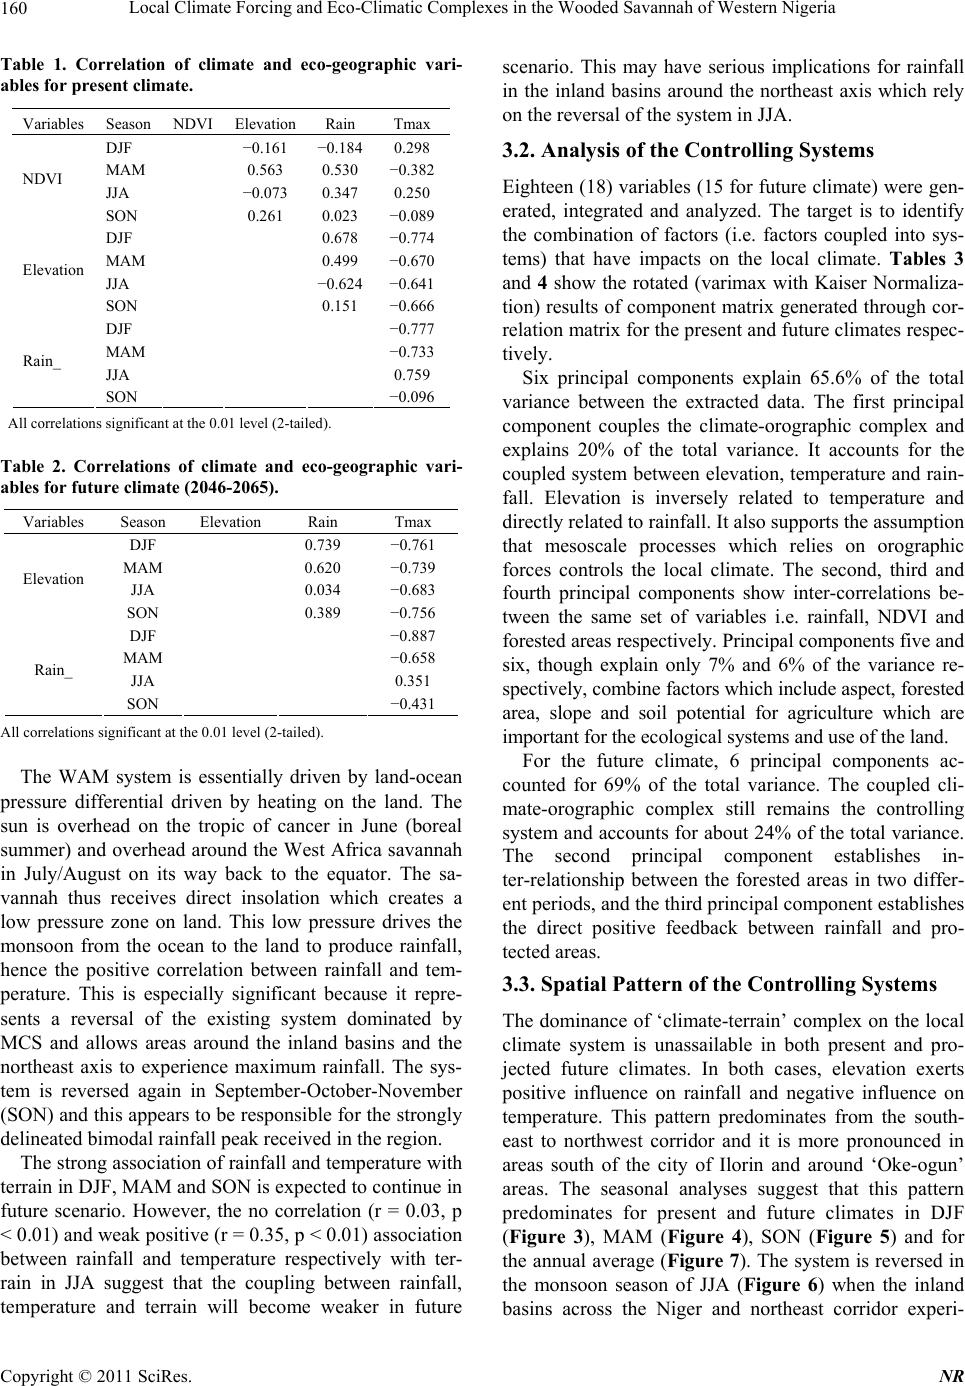 Local Climate Forcing and Eco-Climatic Complexes in the Wooded Savannah of Western Nigeria 160 Table 1. Correlation of climate and eco-geographic vari- ables for present climate. Variables Season NDVI Elevation Rain Tmax DJF −0.161 −0.184 0.298 MAM 0.563 0.530 −0.382 JJA −0.073 0.347 0.250 NDVI SON 0.261 0.023 −0.089 DJF 0.678 −0.774 MAM 0.499 −0.670 JJA −0.624 −0.641 Elevation SON 0.151 −0.666 DJF −0.777 MAM −0.733 JJA 0.759 Rain_ SON −0.096 All correlations significant at the 0.01 level (2-tailed). Table 2. Correlations of climate and eco-geographic vari- ables for future climate (2046-2065). Variables Season Elevation Rain Tmax DJF 0.739 −0.761 MAM 0.620 −0.739 JJA 0.034 −0.683 Elevation SON 0.389 −0.756 DJF −0.887 MAM −0.658 JJA 0.351 Rain_ SON −0.431 All correlations significant at the 0.01 level (2-tailed). The WAM system is essentially driven by land-ocean pressure differential driven by heating on the land. The sun is overhead on the tropic of cancer in June (boreal summer) and overhead around the West Africa savannah in July/August on its way back to the equator. The sa- vannah thus receives direct insolation which creates a low pressure zone on land. This low pressure drives the monsoon from the ocean to the land to produce rainfall, hence the positive correlation between rainfall and tem- perature. This is especially significant because it repre- sents a reversal of the existing system dominated by MCS and allows areas around the inland basins and the northeast axis to experience maximum rainfall. The sys- tem is reversed again in September-October-November (SON) and this appears to be responsible for the strongly delineated bimodal rainfall peak received in the region. The strong association of rainfall and temperature with terrain in DJF, MAM and SON is expected to continue in future scenario. However, the no correlation (r = 0.03, p < 0.01) and weak positive (r = 0.35, p < 0.01) association between rainfall and temperature respectively with ter- rain in JJA suggest that the coupling between rainfall, temperature and terrain will become weaker in future scenario. This may have serious implications for rainfall in the inland basins around the northeast axis which rely on the reversal of the system in JJA. 3.2. Analysis of the Controlling Systems Eighteen (18) variables (15 for future climate) were gen- erated, integrated and analyzed. The target is to identify the combination of factors (i.e. factors coupled into sys- tems) that have impacts on the local climate. Tables 3 and 4 show the rotated (varimax with Kaiser Normaliza- tion) results of component matrix generated through cor- relation matrix for the present and future climates respec- tively. Six principal components explain 65.6% of the total variance between the extracted data. The first principal component couples the climate-orographic complex and explains 20% of the total variance. It accounts for the coupled system between elevation, temperature and rain- fall. Elevation is inversely related to temperature and directly related to rainfall. It also supports the assumption that mesoscale processes which relies on orographic forces controls the local climate. The second, third and fourth principal components show inter-correlations be- tween the same set of variables i.e. rainfall, NDVI and forested areas respectively. Principal components five and six, though explain only 7% and 6% of the variance re- spectively, combine factors which include aspect, forested area, slope and soil potential for agriculture which are important for the ecological systems and use of the land. For the future climate, 6 principal components ac- counted for 69% of the total variance. The coupled cli- mate-orographic complex still remains the controlling system and accounts for about 24% of the total variance. The second principal component establishes in- ter-relationship between the forested areas in two differ- ent periods, and the third principal component establishes the direct positive feedback between rainfall and pro- tected areas. 3.3. Spatial Pattern of the Controlling Systems The dominance of ‘climate-terrain’ complex on the local climate system is unassailable in both present and pro- jected future climates. In both cases, elevation exerts positive influence on rainfall and negative influence on temperature. This pattern predominates from the south- east to northwest corridor and it is more pronounced in areas south of the city of Ilorin and around ‘Oke-ogun’ areas. The seasonal analyses suggest that this pattern predominates for present and future climates in DJF (Figure 3), MAM (Figure 4), SON (Figure 5) and for the annual average (Figure 7). The system is reversed in the monsoon season of JJA (Figure 6) when the inland basins across the Niger and northeast corridor experi- Copyright © 2011 SciRes. NR 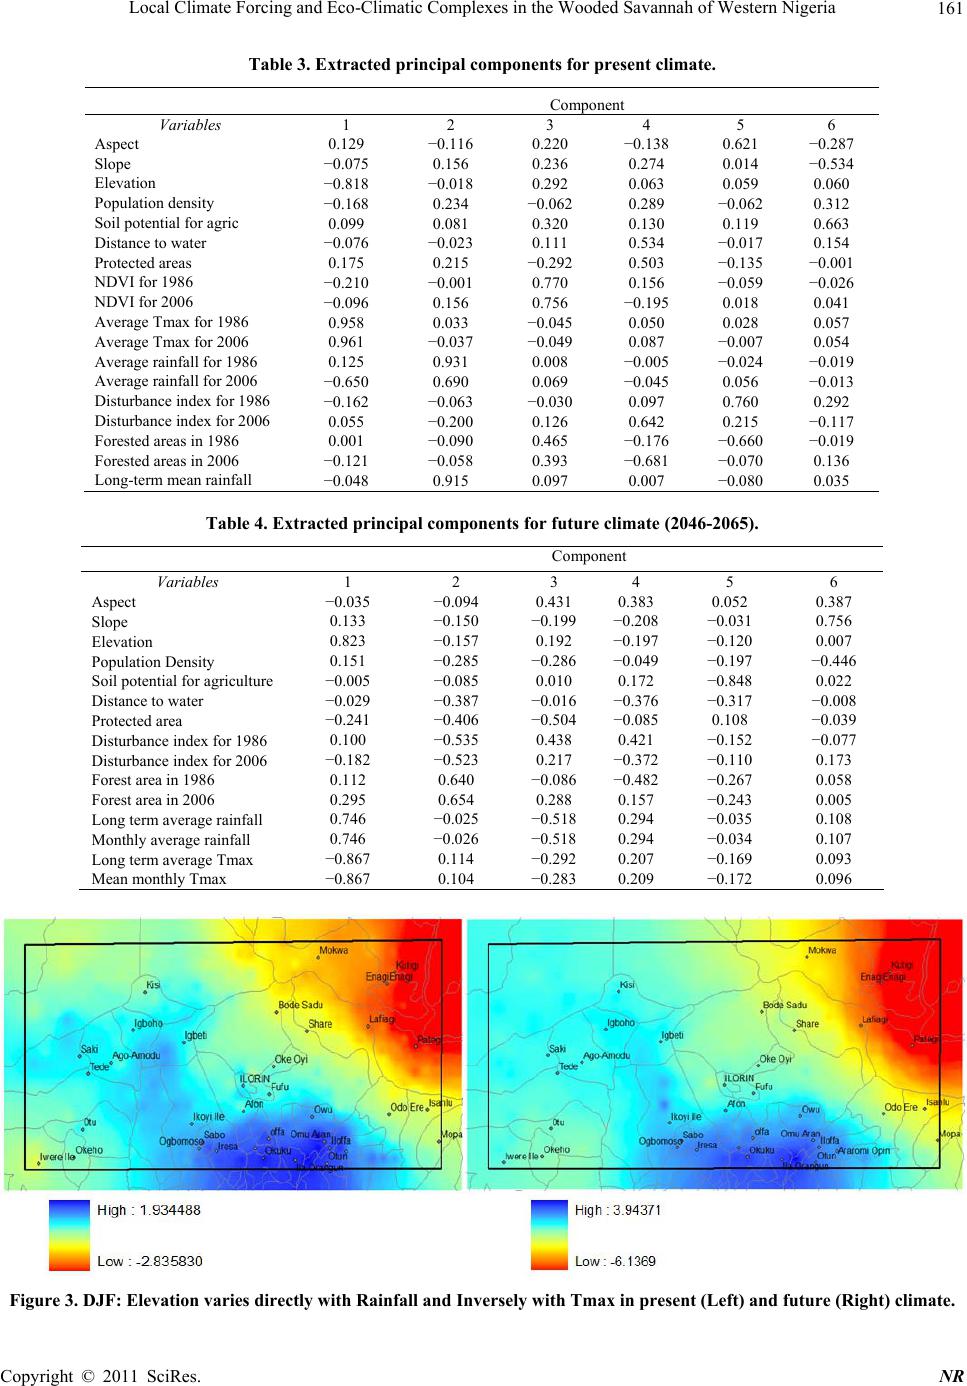 Local Climate Forcing and Eco-Climatic Complexes in the Wooded Savannah of Western Nigeria 161 Table 3. Extracted principal components for present climate. Component Variables 1 2 3 4 5 6 Aspect 0.129 −0.116 0.220 −0.138 0.621 −0.287 Slope −0.075 0.156 0.236 0.274 0.014 −0.534 Elevation −0.818 −0.018 0.292 0.063 0.059 0.060 Population density −0.168 0.234 −0.062 0.289 −0.062 0.312 Soil potential for agric 0.099 0.081 0.320 0.130 0.119 0.663 Distance to water −0.076 −0.023 0.111 0.534 −0.017 0.154 Protected areas 0.175 0.215 −0.292 0.503 −0.135 −0.001 NDVI for 1986 −0.210 −0.001 0.770 0.156 −0.059 −0.026 NDVI for 2006 −0.096 0.156 0.756 −0.195 0.018 0.041 Average Tmax for 1986 0.958 0.033 −0.045 0.050 0.028 0.057 Average Tmax for 2006 0.961 −0.037 −0.049 0.087 −0.007 0.054 Average rainfall for 1986 0.125 0.931 0.008 −0.005 −0.024 −0.019 Average rainfall for 2006 −0.650 0.690 0.069 −0.045 0.056 −0.013 Disturbance index for 1986 −0.162 −0.063 −0.030 0.097 0.760 0.292 Disturbance index for 2006 0.055 −0.200 0.126 0.642 0.215 −0.117 Forested areas in 1986 0.001 −0.090 0.465 −0.176 −0.660 −0.019 Forested areas in 2006 −0.121 −0.058 0.393 −0.681 −0.070 0.136 Long-term mean rainfall −0.048 0.915 0.097 0.007 −0.080 0.035 Table 4. Extracted principal components for future climate (2046-2065). Component Variables 1 2 3 4 5 6 Aspect −0.035 −0.094 0.431 0.383 0.052 0.387 Slope 0.133 −0.150 −0.199 −0.208 −0.031 0.756 Elevation 0.823 −0.157 0.192 −0.197 −0.120 0.007 Population Density 0.151 −0.285 −0.286 −0.049 −0.197 −0.446 Soil potential for agriculture −0.005 −0.085 0.010 0.172 −0.848 0.022 Distance to water −0.029 −0.387 −0.016 −0.376 −0.317 −0.008 Protected area −0.241 −0.406 −0.504 −0.085 0.108 −0.039 Disturbance index for 1986 0.100 −0.535 0.438 0.421 −0.152 −0.077 Disturbance index for 2006 −0.182 −0.523 0.217 −0.372 −0.110 0.173 Forest area in 1986 0.112 0.640 −0.086 −0.482 −0.267 0.058 Forest area in 2006 0.295 0.654 0.288 0.157 −0.243 0.005 Long term average rainfall 0.746 −0.025 −0.518 0.294 −0.035 0.108 Monthly average rainfall 0.746 −0.026 −0.518 0.294 −0.034 0.107 Long term average Tmax −0.867 0.114 −0.292 0.207 −0.169 0.093 Mean monthly Tmax −0.867 0.104 −0.283 0.209 −0.172 0.096 Figure 3. DJF: Elevation varies directly with Rainfall and Inversely with Tmax in present (Left) and future (Right) climate. Copyright © 2011 SciRes. NR 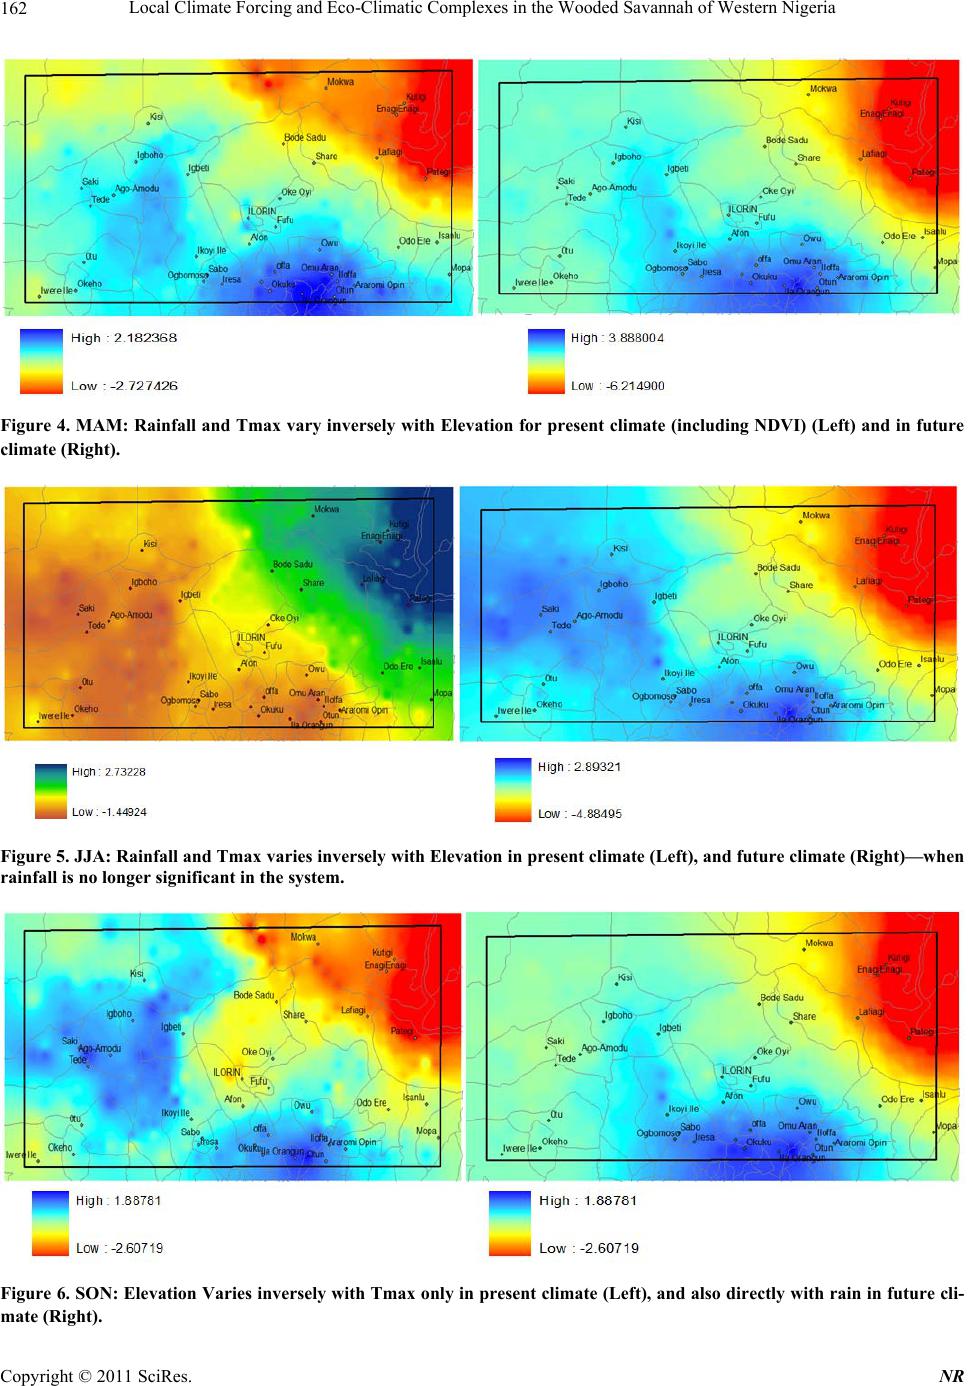 Local Climate Forcing and Eco-Climatic Complexes in the Wooded Savannah of Western Nigeria 162 Figure 4. MAM: Rainfall and Tmax vary inversely with Elevation for present climate (including NDVI) (Left) and in future climate (Right). Figure 5. JJA: Rainfall and Tmax varies inversely with Elevation in present climate (Left), and future climate (Right)—when rainfall is no longer significant in the system. Figure 6. SON: Elevation Varies inversely with Tmax only in present climate (Left), and also directly with rain in future cli- mate (Right). Copyright © 2011 SciRes. NR 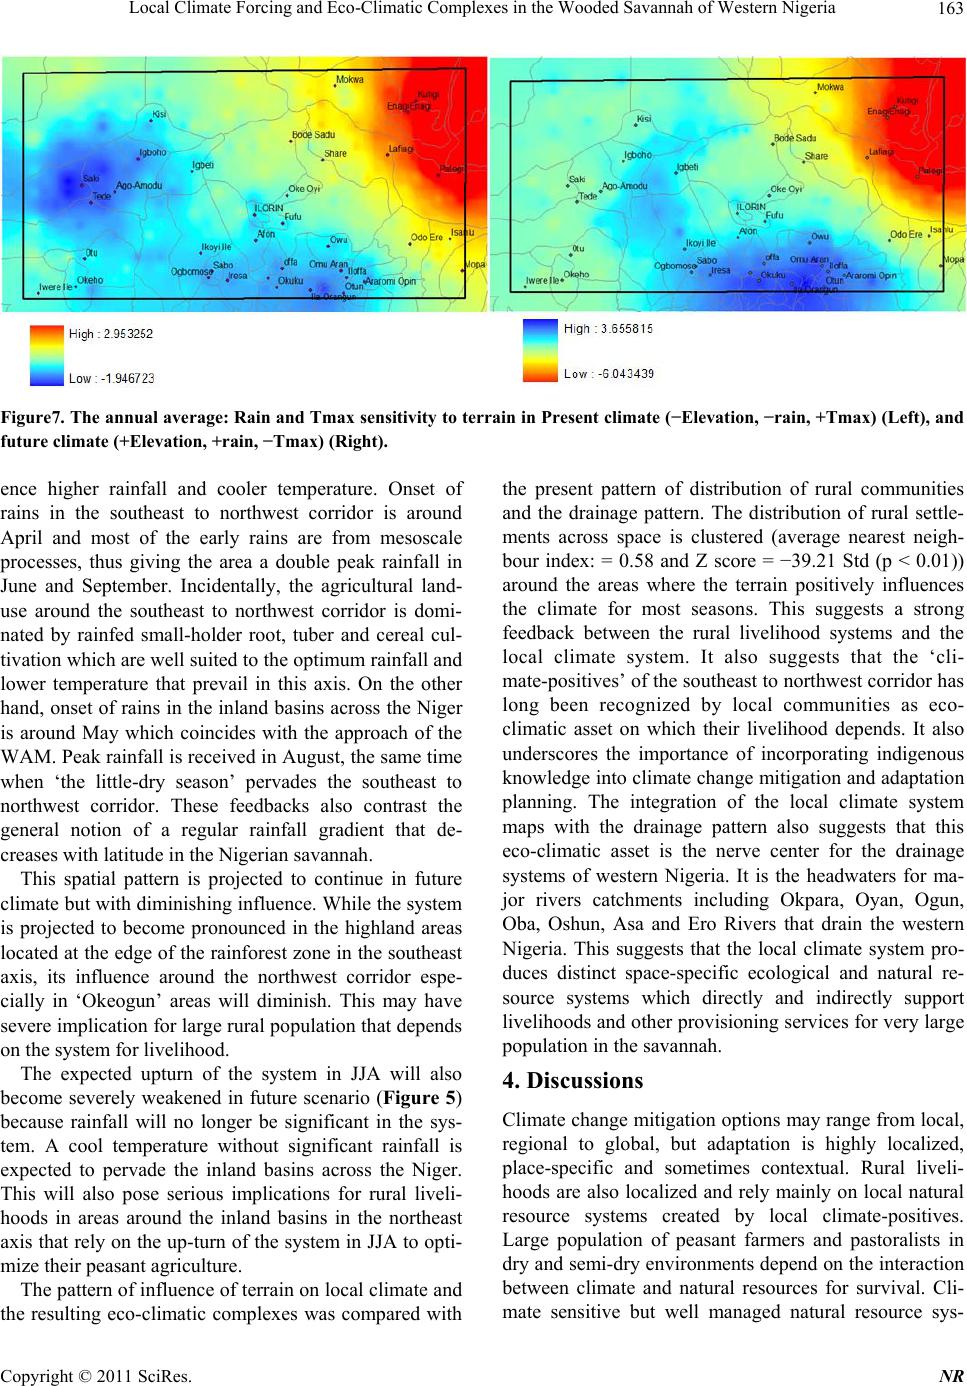 Local Climate Forcing and Eco-Climatic Complexes in the Wooded Savannah of Western Nigeria Copyright © 2011 SciRes. NR 163 Figure7. The annual average: Rain and Tmax sensitivity to terrain in Present climate (−Elevation, −rain, +Tmax) (Left), and future climate (+Elevation, +rain, −Tmax) (Right). ence higher rainfall and cooler temperature. Onset of rains in the southeast to northwest corridor is around April and most of the early rains are from mesoscale processes, thus giving the area a double peak rainfall in June and September. Incidentally, the agricultural land- use around the southeast to northwest corridor is domi- nated by rainfed small-holder root, tuber and cereal cul- tivation which are well suited to the optimum rainfall and lower temperature that prevail in this axis. On the other hand, onset of rains in the inland basins across the Niger is around May which coincides with the approach of the WAM. Peak rainfall is received in August, the same time when ‘the little-dry season’ pervades the southeast to northwest corridor. These feedbacks also contrast the general notion of a regular rainfall gradient that de- creases with latitude in the Nigerian savannah. This spatial pattern is projected to continue in future climate but with diminishing influence. While the system is projected to become pronounced in the highland areas located at the edge of the rainforest zone in the southeast axis, its influence around the northwest corridor espe- cially in ‘Okeogun’ areas will diminish. This may have severe implication for large rural population that depends on the system for livelihood. The expected upturn of the system in JJA will also become severely weakened in future scenario (Figure 5) because rainfall will no longer be significant in the sys- tem. A cool temperature without significant rainfall is expected to pervade the inland basins across the Niger. This will also pose serious implications for rural liveli- hoods in areas around the inland basins in the northeast axis that rely on the up-turn of the system in JJA to opti- mize their peasant agriculture. The pattern of influence of terrain on local climate and the resulting eco-climatic complexes was compared with the present pattern of distribution of rural communities and the drainage pattern. The distribution of rural settle- ments across space is clustered (average nearest neigh- bour index: = 0.58 and Z score = −39.21 Std (p < 0.01)) around the areas where the terrain positively influences the climate for most seasons. This suggests a strong feedback between the rural livelihood systems and the local climate system. It also suggests that the ‘cli- mate-positives’ of the southeast to northwest corridor has long been recognized by local communities as eco- climatic asset on which their livelihood depends. It also underscores the importance of incorporating indigenous knowledge into climate change mitigation and adaptation planning. The integration of the local climate system maps with the drainage pattern also suggests that this eco-climatic asset is the nerve center for the drainage systems of western Nigeria. It is the headwaters for ma- jor rivers catchments including Okpara, Oyan, Ogun, Oba, Oshun, Asa and Ero Rivers that drain the western Nigeria. This suggests that the local climate system pro- duces distinct space-specific ecological and natural re- source systems which directly and indirectly support livelihoods and other provisioning services for very large population in the savannah. 4. Discussions Climate change mitigation options may range from local, regional to global, but adaptation is highly localized, place-specific and sometimes contextual. Rural liveli- hoods are also localized and rely mainly on local natural resource systems created by local climate-positives. Large population of peasant farmers and pastoralists in dry and semi-dry environments depend on the interaction between climate and natural resources for survival. Cli- mate sensitive but well managed natural resource sys-  Local Climate Forcing and Eco-Climatic Complexes in the Wooded Savannah of Western Nigeria 164 tems support sustainable livelihoods and also enhance long-term climate regulation services. If these resource systems are poorly managed, they tend to exacerbate climate change impacts. The pattern created by the inter- action between terrain, land cover and the local climate varies spatio-temporally. In the present climate, the cli- mate-positive produces eco-climatic complex which stretches from southeast to northwest corridor and par- ticularly pronounced around the ‘Oke-ogun’ in the west-central area of the region. The ‘Oke-ogun’ area is locally acknowledged as the food basket of western Ni- geria because its highly productive land supports produc- tion of arable crops including yam, cassava, maize and sorghum. This area has also witnessed significant ru- ral-to-rural migration in recent past. Conflict over land resources especially between sedentary cultivators and pastoralists is becoming rampant. Because the cli- mate-positive advantage is projected to weaken in future, severe consequences on livelihoods and increase in re- source conflict are also likely. A reversed rural-to-rural migration may also upset existing socio-economic bal- ance and increase land resource conflicts in newly suit- able lands. The people in the inland basins across the Niger River around the northeast axis also depend on peasant rainfed agriculture for livelihood. Farming is programmed to take full advantage of the rainy months except in the floodplains. The situation may become more critical in future because the expected reversal which will likely lead to the weakening of the MCS in the southeast to northwest corridor is projected to become more unstable, causing less rainfall in JJA in the northeast axis than presently experience. This suggests these areas will be- come drier in future. This will no doubt challenge exist- ing traditional agricultural systems. Innovative adaptive capacities and strategies are therefore required to avert food insecurity. The pattern exhibited by location of communities suggests the livelihood systems are directly connected to the eco-climatic corridors. In essence, the terrain sys- tem modifies the local climate to produce favorable con- dition that supports rainfed agriculture for most seasons of the year. On the other hand, communities located in the inland basin across the Niger River rely mainly on the upturning of the system in JJA before planting their crops. This could be responsible for why flood plain ag- riculture and small scale irrigation farming is common in the inland basins than the southeast to northwest corridor. The eco-climatic complex as a natural resource system area also creates a super watershed that drains the entire western Nigeria. This suggests that ecological breakdown resulting from climate change, which is suggested by the future climate scenario, may spell disaster for human livelihoods as well as water availability. The green and blue water footprint in the region may in future become the footprint of fierce resource competition. Aggressive vegetation and albedo enhancement strate- gies to restore moisture and energy balances, maintain ecological function and enhance climate regulation ser- vices may be necessary to guarantee the local climate system. The eco-climatic resources together with the river catchments constitute important climate sensitive natural resource system that needs to be protected. This makes it attractive to the reduced emission from defores- tation and land degradation (REDD) and clean develop- ment mechanisms (CDM) initiatives. 5. Conclusions The study has attempted to provide insights into the rela- tions between the local climate system and the control- ling factors using the PCA. The principal factors show a strong coupling between the climatic elements and the terrain which suggests the dominance of the mesoscale convective systems. The variation in the spatial pattern of influence is consistent with the locational pattern of communities and the livelihood systems which suggests dependence on the eco-climatic resource complex. While the observed pattern is projected to continue in future, the spatial influence will severely diminish and some areas especially around ‘Oke-ogun’ that presently sup- port large population and viable rural livelihoods may be negatively affected. The areas of strong positive cli- mate-terrain feedback corridor also correspond to a super catchment for the major drainages of western Nigeria. We conclude that these eco-climatic complexes consti- tute an important natural resource system for climate change mitigation and adaptation in the wooded savan- nah of western Nigeria. 6. Acknowledgments This research was carried out under the African Climate Change Fellowship Programme (ACCFP) postdoctoral fellowship awarded to MF. The ACCFP is supported by a grant from the Climate Change Adaptation in Africa (CCAA) jointly funded by IDRC and DFID. The Interna- tional START Secretariat is the implementing agency in collaboration with the Institute of Resource Assessment (IRA) of the University of Dar es Salaam and the African Academic of Sciences (AAS). REFERENCES [1] S. D. Solomon, D. Qin, M. Manning, R. B. Alley, T. Berntsen, N. L. Bindoff, Z. Chen, A. Chidthaisong, J. M. Gregory, G. C. Hegerl, M. Heimann, B. Hewitson, B. J Hoskins, F. Joos, J. Jouzel, V. Kattsov, U. Lohmann, T. Matsuno, M. Molina, N. Nicholls, J. Overpeck, G. Raga, Copyright © 2011 SciRes. NR  Local Climate Forcing and Eco-Climatic Complexes in the Wooded Savannah of Western Nigeria165 V. Ramaswamy, J. Ren, M. Rusticucci, R. Somerville, T. F. Stocker, P. Whetton, R. A. Wood, D. Wratt (2007): “Technical Summary,” In: S. Solomon, D. Quin, M. Man- ning, Z. Chen, M. Marquis, K. B. Averyt, M. Tignor, Miller H. L., Eds., Climate Change 2007: The Physical Science Basis. Contribution of Working Group I to the Fourth Assessment Report of the Intergovernmental Panel on Climate Change, Cambridge University Press, Cambridge, Cambridge and New York, 2007. [2] S. Nicholson, “Land Surface Processes and Sahel cli- mate,” Reviews of Geophysics, Vol. 38, No 1, 2000, pp. 117-339. doi:10.1029/1999RG900014 [3] E. A. Afiesimama, J. S Pal, B. J. Abiodun, W. J. Gu- towski and A. Adedoyin, “Simulation of West African monsoon using the RegCM3. Part I: Model Validation and Interannual Variability.” Theoretical and Applied Climatology, Vol. 86, 2006, pp. 23-37. doi:10.1007/s00704-005-0202-8 [4] B. J. Abiodun, J. S. Pal, E. A. Afiesimama, W. J. Gu- towski and A. Adedoyin, “Simulation of West African monsoon using RegCM3 Part II: Impacts of Deforestation and Desertification, Theoretical and Applied Climatology, Vol. 93, 2008, pp. 245-261. doi:10.1007/s00704-007-0333-1 [5] C. Müller, “Climate Change Impact on Sub-Saharan Af- rica: An Overview and Analysis of Scenarios and Mod- els,” Deutsches Institut für Entwicklungspolitik, Vol. 3, 2009. [6] T. O. Odekunle, E. E. Balogun and O. O. Ogunkoya, “On the Prediction of Rainfall Onset and Retreat Dates in Ni- geria.” Theoretical and Applied Climatology, Vol. 81, 2005, pp. 101-112. doi:10.1007/s00704-004-0108-x [7] M. Fasona, A. Omojola, O. Adeaga and D. Dabi, “As- pects of Climate Change and Resource Conflicts in the Nigeria Savannah,” Report of IPCC/TGICA Expert Meet- ing on Integrating Analysis of Regional Climate Change and Response Options, Fiji Island, 2007, pp. 45-55. [8] B. C. Hewitson and R. G. Crane, “Consensus between GCM Climate Change Projections with Empirical Down- scaling: Precipitation Downscaling over South Africa,” International Journal of Climatology, Vol. 26, 2006, pp. 1315-1337. doi:10.1002/joc.1314 [9] T. J. Stohlren, T. N. Chase, R. A. Pielke, T. G. Kittel and J. S. Baron, “Evidence that Local Land Use Practices In- fluence Regional Climate, Vegetation, and Stream Flow Patterns in Adjacent Natural Areas,” Global Change Bi- ology, Vol. 4, No. 5, 1998, pp. 495-504. doi:10.1046/j.1365-2486.1998.t01-1-00182.x [10] R. A. Pielke, J. Adegoke, A. Beltran-Przekurat, C. A. Hiemstra, J. Lin, U. S. Nair, D. Niyogi and E. Nobis, “An Overview of Regional Land-Use and Land-Cover Impacts on Rainfall,” Tellus B, Vol. 59, No 3, 2007, pp. 587-601. doi:10.1111/j.1600-0889.2007.00251.x [11] NDP-UNEP, “Mainstreaming Poverty-Environment Lin- kages into Development Planning: A Handbook for Prac- titioners,” 2009. http://www.unpei.org [12] J. B. Omotosho and J. Abiodun, “A Numerical Study ofMoisture Build-Up and Rainfall over West Africa,” Me teorologucal Applications, Vol. 14, 2007, pp. 209-225. [13] R. L. Wilby, S. P. Charles, E. Zorita, B. Timbal, P. Whet- ton and L. O. Mearns, “Guidelines for Use of Climate Scenarios Developed from Statistical Downscaling Meth- ods,” 2004. http://www.ipcc-data.org/guidelines/dgm_no2_v1_09_20 04.pdf [14] W. A. Hoffmann and R. B. Jackson, “Vegetation–Climate Feedbacks in the Conversion of Tropical Savannah to Grassland”, Journal of Climate, Vol. 13, No. 9, 2000, pp. , 1593-1602 [15] G. Bucini and E. F. Lambin, “Fire Impacts on Vegetation in Central Africa: A Remote-Sensing-Based Statistical Analysis,” Applied Geography, Vol. 22, No.1, 2002, pp. 27-48. doi:10.1016/S0143-6228(01)00020-0 [16] M. Kottek, J. Grieser, C. Beck, B. Rudolf and F. Ru, “World Map of the Köppen-Geiger Climate Classification Updated,” Meteorologische Zeitschrift, Vol. 15, No. 3, 2006, pp. 259-263. [17] C. Neely, S. Bunning and A. Wilkes, “Review of Evi- dence on Drylands Pastoral Systems and Climate Change: Implications and Opportunities for Mitigation and Adap- tation,” FAO, Rome, 2009. [18] J. F. K. Akinbami, A. T. Salami and W. O. Siyanbola, “An Integrated Strategy for Sustainable Forest-Energy- Environment Interactions in Nigeria,” Journal of Envi- ronmental Management, Vol. 69, No. 2, 2003, pp. 115-128. doi:10.1016/S0301-4797(03)00083-5 [19] M. J. Fasona and A. S. Omojola, “Climate Change, Hu- man Security and Communal Clashes in Nigeria,” Pro- ceedings International Workshop on Human Security and Climate Change, Asker, Oslo, 21-23 June 2005. [20] E. E. Obioha, “Climate Change, Population Drift and Violent Conflict over Land Resources in North-eastern Nigeria,” Journal of Human Ecology, Vol. 23, No. 4, 2008, pp. 311-324. [21] S. R. Adisa and O. A. Adekunle, “Farmer-Herdsmen Conflicts: A Factor Analysis of Socio-Economic Conflict Variables among Arable Crop Farmers in North Central Nigeria,” Journal of Human Ecology, Vol. 30, No. 1, 2010, pp. 1-9. [22] J. Pinzon, “Using HHT to Successfully Uncouple Sea- sonal and iIterannual Components in Remotely Sensed Data,” Proceedings SCI 2002, Orlando, 14-18 July 2002. [23] J. Pinzon, M. E. Brown and C. J. Tucker, “Satellite Time Series Correction of Orbital Drift Artifacts Using Em- pirical Mode Decomposition,” In: N. Hubert-Huang, Ed., Transform: Introduction and Applications, World Scien- tific, 2004. [24] C. J. Tucker, J. E. Pinzón, M. E. Brown, D. Slayback, E. W. Pak, R. Mahoney, E. Vermote and N. El Saleous, “An Extended AVHRR 8-km NDVI Data Set Compatible with MODIS and SPOT Vegetation NDVI Data,” Interna- tional Journal of Remote Sensing, Vol. 26, No. 20, 2005, pp. 4485-4498. [25] A. Anyamba and C. J. Tucker, “Analysis of Sahelian Vegetation Dynamics Using NOAA-AVHRR NDVI Data Copyright © 2011 SciRes. NR  Local Climate Forcing and Eco-Climatic Complexes in the Wooded Savannah of Western Nigeria Copyright © 2011 SciRes. NR 166 from 1981-2003.” Journal of Arid Environments, Vol. 63, 2005, pp. 596-614. doi:10.1016/j.jaridenv.2005.03.007 [26] D. A. Stow, A. Hope, D. McGuire, D. Verbyla, J. Gamon, F. Huemmrich, S. Houston, C. Racine, M. Sturm, K. Tape, I. Hinzman, K. Yoshikawa, C. Tweedie, B. Noyle, C. Si- lapaswan, D. Douglas, B. Griffith, G. Jia, H. Epstein, D. Walker, S. Daeschner, A. Petersen, L. Zhou and R. Myneni, “Remote Sensing of Vegetation and Land-Over Change in Arctic Tundra Ecosystems,” Remote Sensing of Environment, Vol. 89, No. 3, 2004, pp. 281-308. doi:10.1016/j.rse.2003.10.018 [27] C. S. R. Neigh, C. J. Tucker and J. R. G. Townshend, “North American Vegetation Dynamics Observed with Multi-Resolution Satellite Data,” Remote Sensing of En- vironment, Vol. 112, No. 4, 2008, pp. 1749-1772. doi:10.1016/j.rse.2007.08.018 [28] K. H. Cook and E. K. Vizy, “Coupled Model Simulation of the West African Monsoon Systems: Twentieth- and Twenty-First-Century Simulations,” Journal of Climate, Vol. 19, 2006, pp. 3681-3703. doi:10.1175/JCLI3814.1 [29] J. R. Eastman, “Idrisi Taiga Guide to Image Processing,” Clark Labs, Worcester, 2009. [30] K. G. Paterson, J. Sagady, D. Hooper, S. B. Bertman, M. A. Carrol and P. B. Shepson, “Analysis of Air Quality Data Using Positive Matrix Factorization,” Environ- mental Science & Technology, Vol. 33, No. 4, 1999, pp. 635-641. [31] M. Statheropoulos, N. Vassiliadis and A. Pappa, “Princi- pal Component and Canonical Correlation Analysis for Examining Air Pollution and Meteorological Data,” At- mospheric Environment, Vol. 32, No. 6, 1998, pp. 1087-1095. [32] J. L. Moore, L. Manne, T. Brooks, N. D. Burgess, R. Davies, C. Rahbek, P. Williams and A. Balmford, “The Distribution of Cultural and Biological Diversity in Af- rica,” Proceedings of Royal Society, Vol. 269, No. 1501, 2002, pp. 1645-1653. [33] R. Engler, A. Guisan and L. Rechsteiner, “An Improved Approach for Predicting the Distribution of Rare and En- dangered Species from Occurrence and Pseudo-Absence Data,” Journal of Applied Ecology, Vol. 41, No. 2, 2004, pp. 263-274. doi:10.1111/j.0021-8901.2004.00881.x [34] C. Reimanna, C. Filzmoserb and R. G. Garrett, “Factor Analysis Applied to Regional Geochemical Data: Prob- lems and Possibilities,” Applied Geochemistry, Vol. 17, No. 3, 2002, pp. 185-206. doi:10.1016/S0883-2927(01)00066-X [35] D. Love, D. Hallbauer, A. Amos and R. Hranova, “Factor Analysis as a Tool in Groundwater Quality Management: Two Southern African Case Studies,” Physics and Chem- istry of the Earth, Vol. 29, No. 15-18, 2004, pp. 1135-1143. [36] A. Facchinelli, E. Sacchi and L. Mallen, “Multivariate Statistical and GIS-Based Approach to Identify Heavy Metals in Soils,” Environmental Pollution, Vol. 114, No. 3, 2001, pp. 313-324. doi:10.1016/S0269-7491(00)00243-8
|