Paper Menu >>
Journal Menu >>
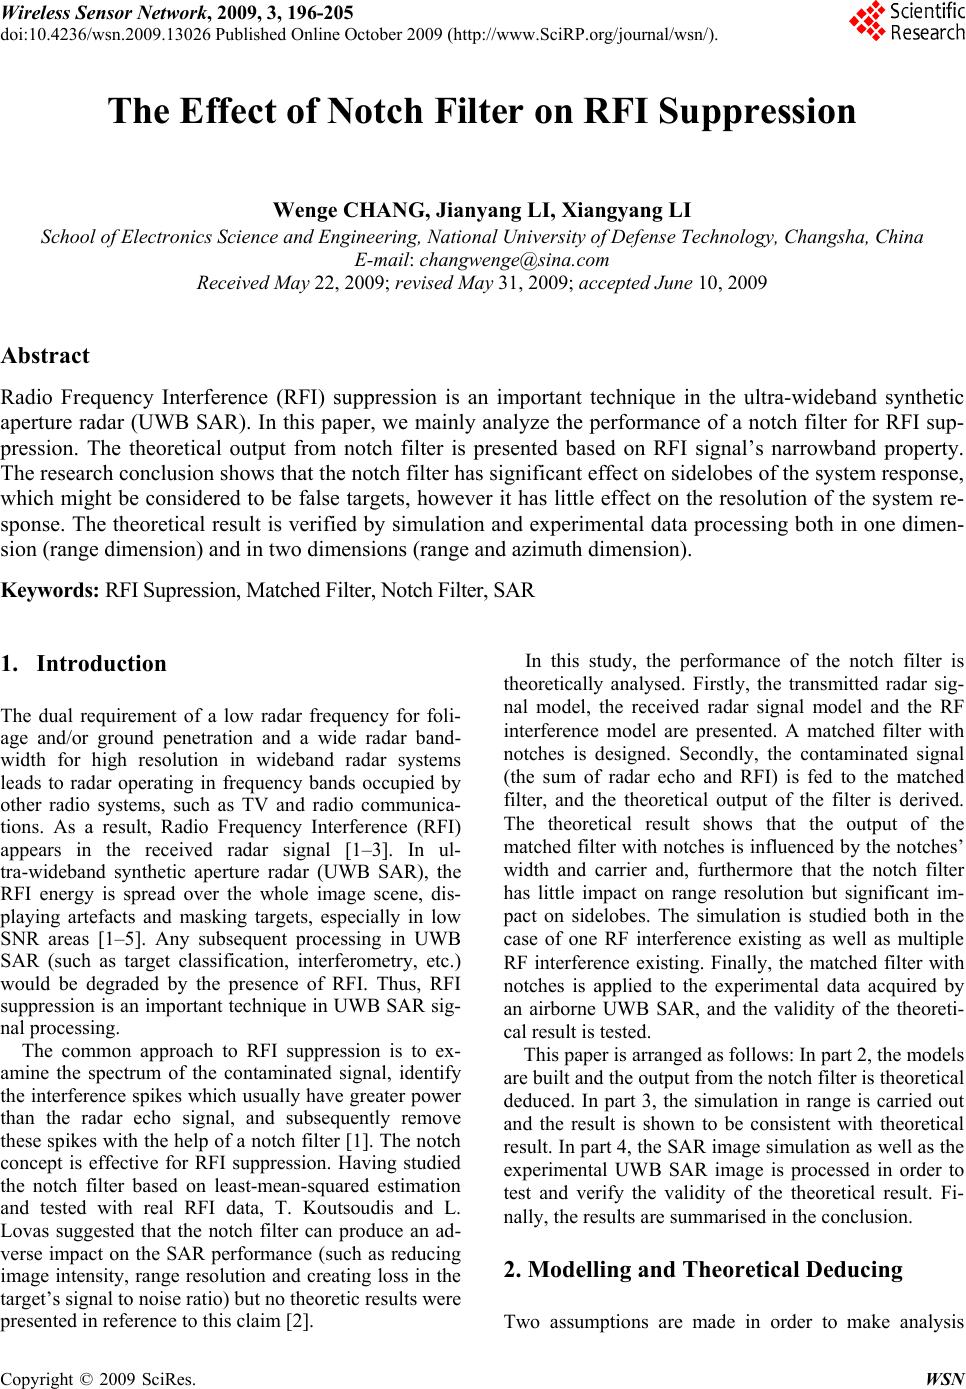 Wireless Sensor Network, 2009, 3, 196-205 doi:10.4236/wsn.2009.13026 ctober 2009 (http://www.SciRP.org/journal/wsn/). Copyright © 2009 SciRes. WSN Published Online O The Effect of Notch Filter on RFI Suppression Wenge CHANG, Jianyang LI, Xiangyang LI School of Electronics Science and Engineering, National University of Defense Technology, Changsha, China E-mail: changwenge@sina.com Received May 22, 2009; revised May 31, 2009; accepted June 10, 2009 Abstract Radio Frequency Interference (RFI) suppression is an important technique in the ultra-wideband synthetic aperture radar (UWB SAR). In this paper, we mainly analyze the performance of a notch filter for RFI sup- pression. The theoretical output from notch filter is presented based on RFI signal’s narrowband property. The research conclusion shows that the notch filter has significant effect on sidelobes of the system response, which might be considered to be false targets, however it has little effect on the resolution of the system re- sponse. The theoretical result is verified by simulation and experimental data processing both in one dimen- sion (range dimension) and in two dimensions (range and azimuth dimension). Keywords: RFI Supression, Matched Filter, Notch Filter, SAR 1. Introduction The dual requirement of a low radar frequency for foli- age and/or ground penetration and a wide radar band- width for high resolution in wideband radar systems leads to radar operating in frequency bands occupied by other radio systems, such as TV and radio communica- tions. As a result, Radio Frequency Interference (RFI) appears in the received radar signal [1–3]. In ul- tra-wideband synthetic aperture radar (UWB SAR), the RFI energy is spread over the whole image scene, dis- playing artefacts and masking targets, especially in low SNR areas [1–5]. Any subsequent processing in UWB SAR (such as target classification, interferometry, etc.) would be degraded by the presence of RFI. Thus, RFI suppression is an important technique in UWB SAR sig- nal processing. The common approach to RFI suppression is to ex- amine the spectrum of the contaminated signal, identify the interference spikes which usually have greater power than the radar echo signal, and subsequently remove these spikes with the help of a notch filter [1]. The notch concept is effective for RFI suppression. Having studied the notch filter based on least-mean-squared estimation and tested with real RFI data, T. Koutsoudis and L. Lovas suggested that the notch filter can produce an ad- verse impact on the SAR performance (such as reducing image intensity, range resolution and creating loss in the target’s signal to noise ratio) but no theoretic results were presented in reference to this claim [2]. In this study, the performance of the notch filter is theoretically analysed. Firstly, the transmitted radar sig- nal model, the received radar signal model and the RF interference model are presented. A matched filter with notches is designed. Secondly, the contaminated signal (the sum of radar echo and RFI) is fed to the matched filter, and the theoretical output of the filter is derived. The theoretical result shows that the output of the matched filter with notches is influenced by the notches’ width and carrier and, furthermore that the notch filter has little impact on range resolution but significant im- pact on sidelobes. The simulation is studied both in the case of one RF interference existing as well as multiple RF interference existing. Finally, the matched filter with notches is applied to the experimental data acquired by an airborne UWB SAR, and the validity of the theoreti- cal result is tested. This paper is arranged as follows: In part 2, the models are built and the output from the notch filter is theoretical deduced. In part 3, the simulation in range is carried out and the result is shown to be consistent with theoretical result. In part 4, the SAR image simulation as well as the experimental UWB SAR image is processed in order to test and verify the validity of the theoretical result. Fi- nally, the results are summarised in the conclusion. 2. Modelling and Theoretical Deducing Two assumptions are made in order to make analysis  W. G. CHANG ET AL. 197 more convenient. Firstly, it is assumed that the transmit- ted and received signal of UWB SAR is a base-band lin- ear frequency modulated pulse as follows: 2 ()( ),/ ; jk t s trecte kBT T (1) 2 4 ()( ) 2 jk Srect e B (2) where B is the bandwidth, T is the width of the transmit- ted pulse, S (ω) is the spectrum of s(t) . Secondly, it is assumed that only one narrow band RFI signal exists with carrier ω1 and bandwidth b1. The matched filter with a notch at ω1 is designed for suppressing FRI with carrier ω1 and bandwidth b1. The matched filter in spectrum is shown in Equation (3). 2 ** 11 4 11 ()(1( ))()=()( ) 22 jk HrectS Srecte bb (3) The received radar signal includes the echo signal (the reflected transmitted signal from the target), the RFI signal and thermal noise. Assuming only one RFI 1() RFI s t exists and that thermal noise can be ignored, the received signal () r s t, and its spectrum () r S , can be written as 1 ()( )() r RFI s tasts t (4) 1 () ()() j r SaSeS R FI (5) where a is a constant coefficient. The received signal is processed with the matched filter. The output in spec- trum is given by Equation (6). 2 2 *14 1 1 * 1 14 1 1 1 ()() ()(() ())(()()) 2 ()()() 2 ()() 2 (2 j r jk RFI j RFI j jk YSH aSe SSrecte b arecteS S B aS erecte b arect b 2 4 1 )( jk RFI eS ) (6) where: 2 22 14 1 1 44 1 1 1 ()( ) 2 ()() 22 =() 2 j jk jj j kk j aS erecte b a recteerecte Bb a recte b (7) 2 *4 11 () ()()() 2 jk RFI RFI S SrecteS B (8) Thus: 22 1 1 1 44 11 1 ()()() 22 +()()()( 22 jj jj kk RFI RFI Yarect earecte Bb recte Srecte S Bb ) (9) Based on the assumption that the RFI signal1() RFI s t is a narrow band signal with carrier ω1 and bandwidth b1, we have 22 1 44 11 1 ()()()() 22 jj kk RFI RFI recte Srecte S Bb (10) Considering Equations (10) and (9), the output of the matched filter with a notch is given by 1 1 ()( )() 22 j j Ya rectea recte Bb (11) The output in the time domain of the matched filter with a notch is given by 1() 11 ()(( ))(( ))jt y taBSaBtabSa bte (12) From Equation (12) we find that the output of the matched filter with a notch has two parts: one is the de- sired part and the other one is the undesired part. Here we call the undesired part clutter, which is a high fre- quency oscillating signal modulated by a wide pulsed sinc-function, determined by parameters ω1, b1. This clutter influences the peak-sidelobe-ratio (PSLR), the integrated-sidelobe-ratio (ISLR) of radar system re- sponse. Here the signal-to-clutter-ratio (SCR) is utilised to de- scribe the influence as follows: 1 20log(/)SCRbB (13) It is easy to expand Equation (12) for multiple RF in- terference signals. Assuming there are n RFI signals with carriers and bandwidths being ωn, bn (n=1,2,...,n) respec- tively. The matched filter with n notches is given by: 2 * 1 *4 1 () (1()) () 2 =()( ) 2 n k kk nj kk kk HrectS b Srecte b (14) The output spectrum of the matched filter is: C opyright © 2009 SciRes. WSN 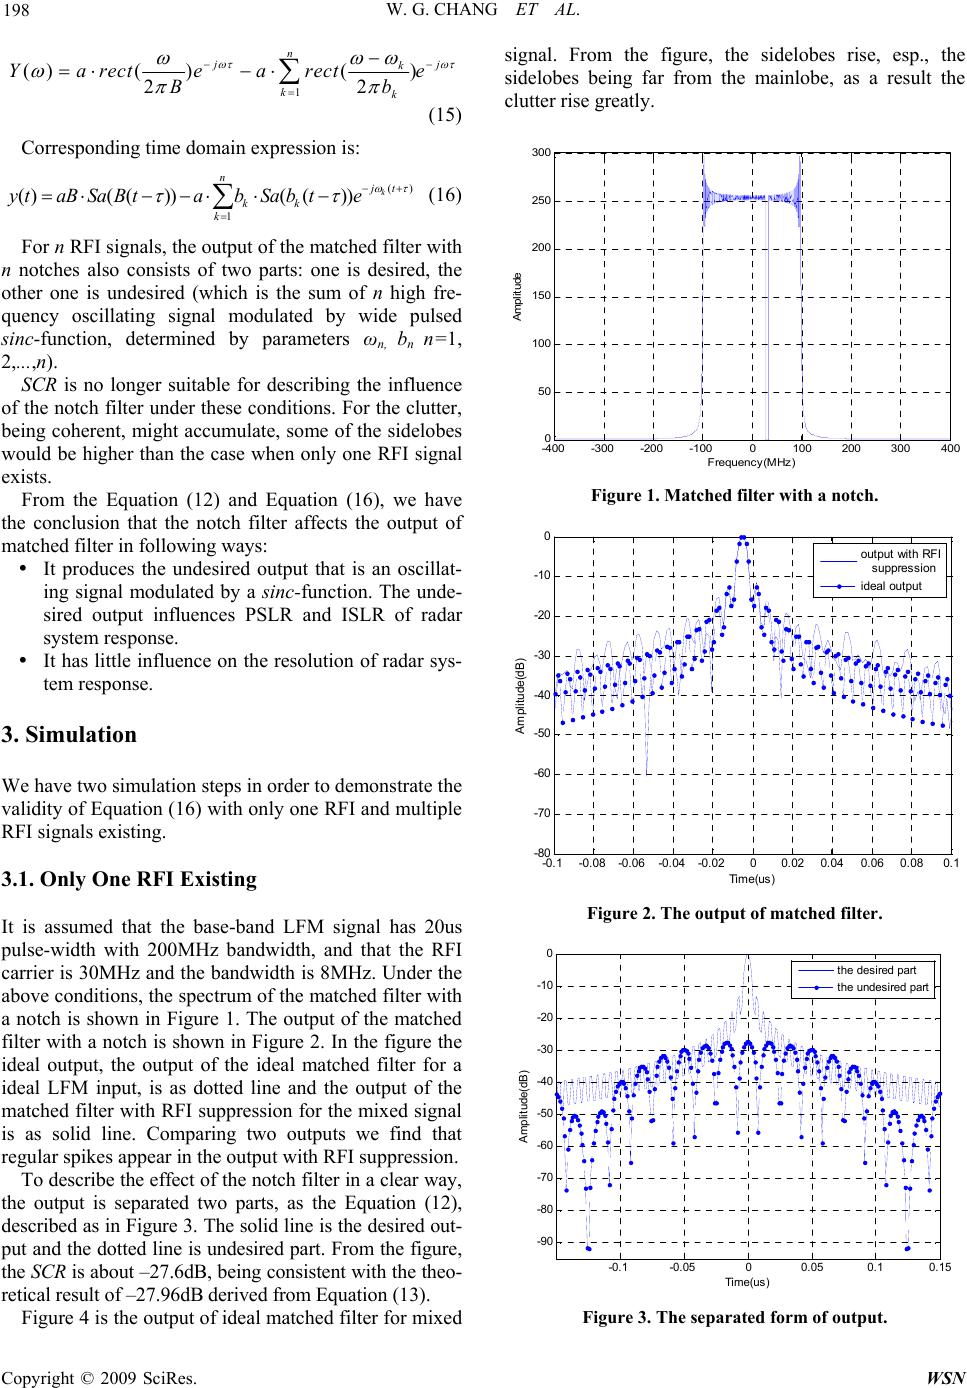 W. G. CHANG ET AL. 198 1 ()()() 22 n j k kk Yarectearecte B j b (15) Corresponding time domain expression is: () 1 ()(( ))(( ))k n jt kk k y taBSaBtabSa bte (16) For n RFI signals, the output of the matched filter with n notches also consists of two parts: one is desired, the other one is undesired (which is the sum of n high fre- quency oscillating signal modulated by wide pulsed sinc-function, determined by parameters ωn, bn n=1, 2,...,n). SCR is no longer suitable for describing the influence of the notch filter under these conditions. For the clutter, being coherent, might accumulate, some of the sidelobes would be higher than the case when only one RFI signal exists. From the Equation (12) and Equation (16), we have the conclusion that the notch filter affects the output of matched filter in following ways: It produces the undesired output that is an oscillat- ing signal modulated by a sinc-function. The unde- sired output influences PSLR and ISLR of radar system response. It has little influence on the resolution of radar sys- tem response. 3. Simulation We have two simulation steps in order to demonstrate the validity of Equation (16) with only one RFI and multiple RFI signals existing. 3.1. Only One RFI Existing It is assumed that the base-band LFM signal has 20us pulse-width with 200MHz bandwidth, and that the RFI carrier is 30MHz and the bandwidth is 8MHz. Under the above conditions, the spectrum of the matched filter with a notch is shown in Figure 1. The output of the matched filter with a notch is shown in Figure 2. In the figure the ideal output, the output of the ideal matched filter for a ideal LFM input, is as dotted line and the output of the matched filter with RFI suppression for the mixed signal is as solid line. Comparing two outputs we find that regular spikes appear in the output with RFI suppression. To describe the effect of the notch filter in a clear way, the output is separated two parts, as the Equation (12), described as in Figure 3. The solid line is the desired out- put and the dotted line is undesired part. From the figure, the SCR is about –27.6dB, being consistent with the theo- retical result of –27.96dB derived from Equation (13). Figure 4 is the output of ideal matched filter for mixed signal. From the figure, the sidelobes rise, esp., the sidelobes being far from the mainlobe, as a result the clutter rise greatly. -400 -300 -200 -100 0100 200 300 400 0 50 100 150 200 250 300 Frequency(MHz ) Amplitude Figure 1. Matched filter with a notch. -0.1-0.08 -0.06-0.04-0.0200.02 0.040.06 0.080.1 -80 -70 -60 -50 -40 -30 -20 -10 0 Ti me( us ) A mpl itude(dB) output with RFI suppression ideal output Figure 2. The output of matched filter. -0.1 -0.0500.05 0.1 0.15 -90 -80 -70 -60 -50 -40 -30 -20 -10 0 Time(us) Amplitude(dB) the desired part the undesired part Figure 3. The separated form of output. Copyright © 2009 SciRes. WSN 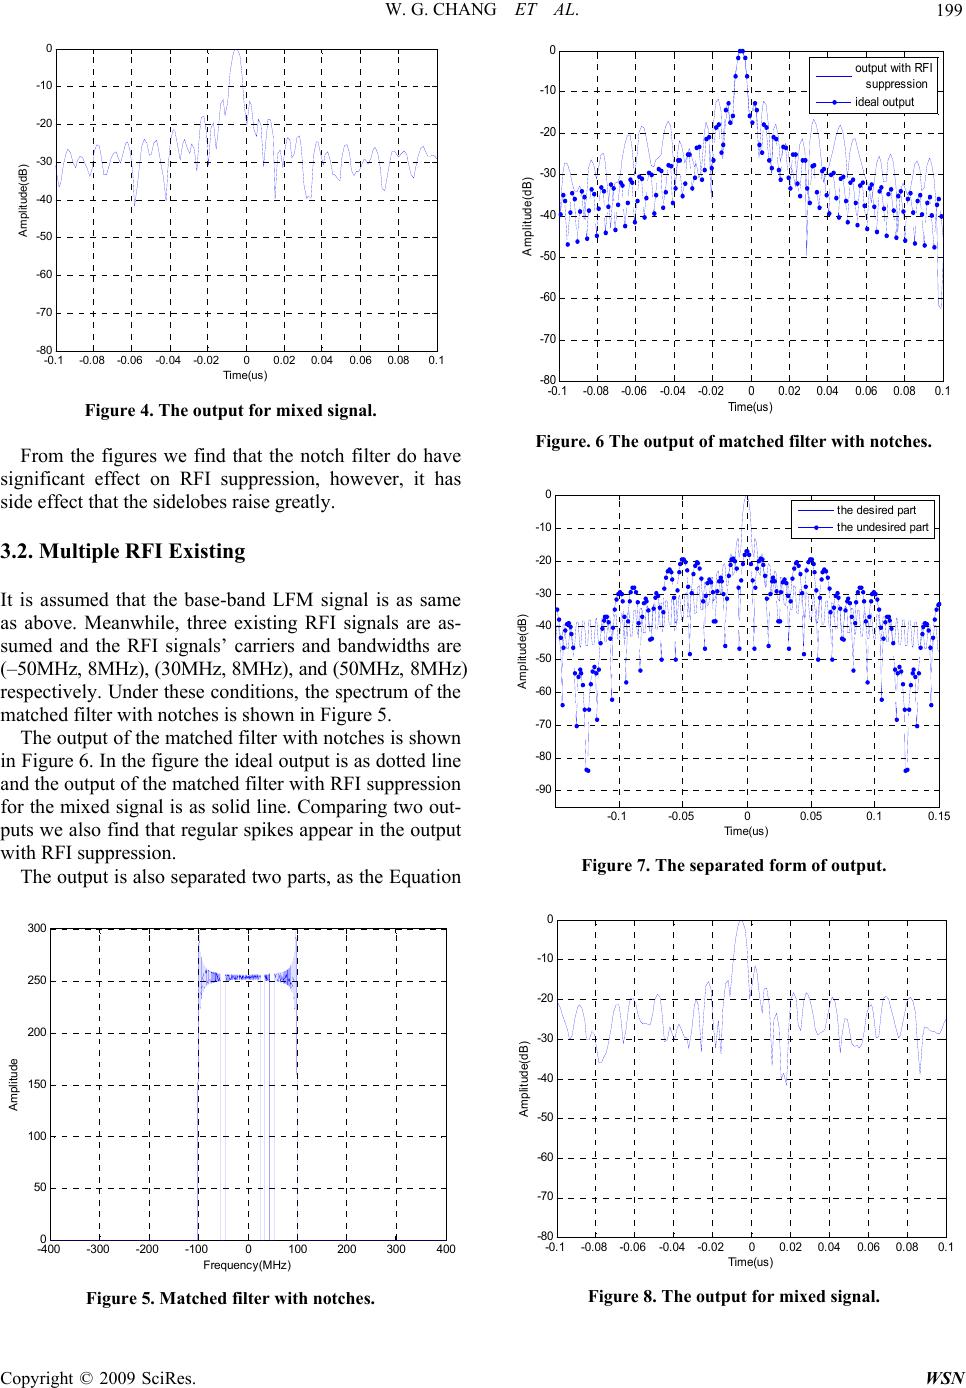 W. G. CHANG ET AL. 199 -0.1-0.08 -0.06-0.04-0.0200.02 0.040.06 0.080.1 -80 -70 -60 -50 -40 -30 -20 -10 0 Time( u s) A m pli tud e(dB ) Figure 4. The output for mixed signal. From the figures we find that the notch filter do have significant effect on RFI suppression, however, it has side effect that the sidelobes raise greatly. 3.2. Multiple RFI Existing It is assumed that the base-band LFM signal is as same as above. Meanwhile, three existing RFI signals are as- sumed and the RFI signals’ carriers and bandwidths are (–50MHz, 8MHz), (30MHz, 8MHz), and (50MHz, 8MHz) respectively. Under these conditions, the spectrum of the matched filter with notches is shown in Figure 5. The output of the matched filter with notches is shown in Figure 6. In the figure the ideal output is as dotted line and the output of the matched filter with RFI suppression for the mixed signal is as solid line. Comparing two out- puts we also find that regular spikes appear in the output with RFI suppression. The output is also separated two parts, as the Equation -400 -300 -200 -1000100 200 300400 0 50 100 150 200 250 300 Frequency(MHz) Amplitude Figure 5. Matched filter with notches. -0.1 -0.08 -0.06-0.04 -0.02 00.02 0.040.060.08 0.1 -80 -70 -60 -50 -40 -30 -20 -10 0 Tim e(u s) Amplitude(dB) output with RFI suppression ideal output Figure. 6 The output of matched filter with notches. -0.1 -0.0500.05 0.1 0.15 -90 -80 -70 -60 -50 -40 -30 -20 -10 0 Time( us) Amplitude(dB) the desired part the undesired part Figure 7. The separated form of output. -0.1-0.08-0.06 -0.04 -0.02 00.02 0.04 0.06 0.08 0.1 -80 -70 -60 -50 -40 -30 -20 -10 0 Time(us) A mpl itude(dB) Figure 8. The output for mixed signal. C opyright © 2009 SciRes. WSN 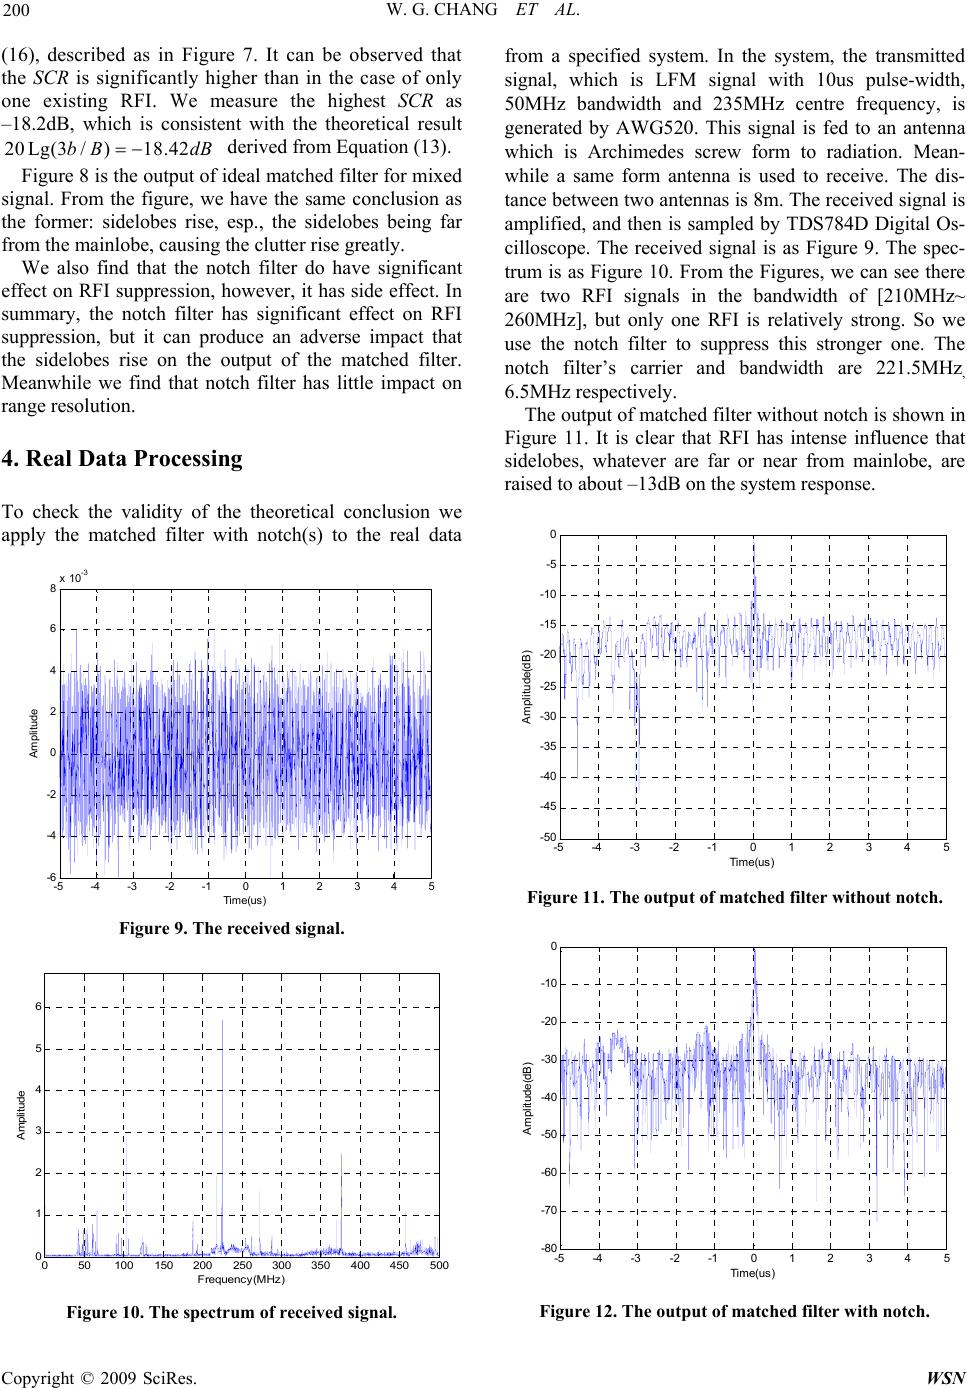 W. G. CHANG ET AL. 200 (16), described as in Figure 7. It can be observed that the SCR is significantly higher than in the case of only one existing RFI. We measure the highest SCR as –18.2dB, which is consistent with the theoretical result derived from Equation (13). 20 Lg(3/)18.42bB dB Figure 8 is the output of ideal matched filter for mixed signal. From the figure, we have the same conclusion as the former: sidelobes rise, esp., the sidelobes being far from the mainlobe, causing the clutter rise greatly. We also find that the notch filter do have significant effect on RFI suppression, however, it has side effect. In summary, the notch filter has significant effect on RFI suppression, but it can produce an adverse impact that the sidelobes rise on the output of the matched filter. Meanwhile we find that notch filter has little impact on range resolution. 4. Real Data Processing To check the validity of the theoretical conclusion we apply the matched filter with notch(s) to the real data -5 -4 -3-2 -1 01 2 3 4 5 -6 -4 -2 0 2 4 6 8x 10 -3 Time(us) Amplitude Figure 9. The received signal. 050100 150 200250 300350 400 450500 0 1 2 3 4 5 6 Frequenc y(M Hz) Amplitude Figure 10. The spectrum of received signal. from a specified system. In the system, the transmitted signal, which is LFM signal with 10us pulse-width, 50MHz bandwidth and 235MHz centre frequency, is generated by AWG520. This signal is fed to an antenna which is Archimedes screw form to radiation. Mean- while a same form antenna is used to receive. The dis- tance between two antennas is 8m. The received signal is amplified, and then is sampled by TDS784D Digital Os- cilloscope. The received signal is as Figure 9. The spec- trum is as Figure 10. From the Figures, we can see there are two RFI signals in the bandwidth of [210MHz~ 260MHz], but only one RFI is relatively strong. So we use the notch filter to suppress this stronger one. The notch filter’s carrier and bandwidth are 221.5MHz, 6.5MHz respectively. The output of matched filter without notch is shown in Figure 11. It is clear that RFI has intense influence that sidelobes, whatever are far or near from mainlobe, are raised to about –13dB on the system response. -5 -4 -3-2 -101 23 45 -50 -45 -40 -35 -30 -25 -20 -15 -10 -5 0 Time(us ) A mpl it ude(dB ) Figure 11. The output of matched filter without notch. -5 -4 -3-2 -1 0 1 23 45 -80 -70 -60 -50 -40 -30 -20 -10 0 Time(us) Am pli t ude(dB) Figure 12. The output of matched filter with notch. Copyright © 2009 SciRes. WSN 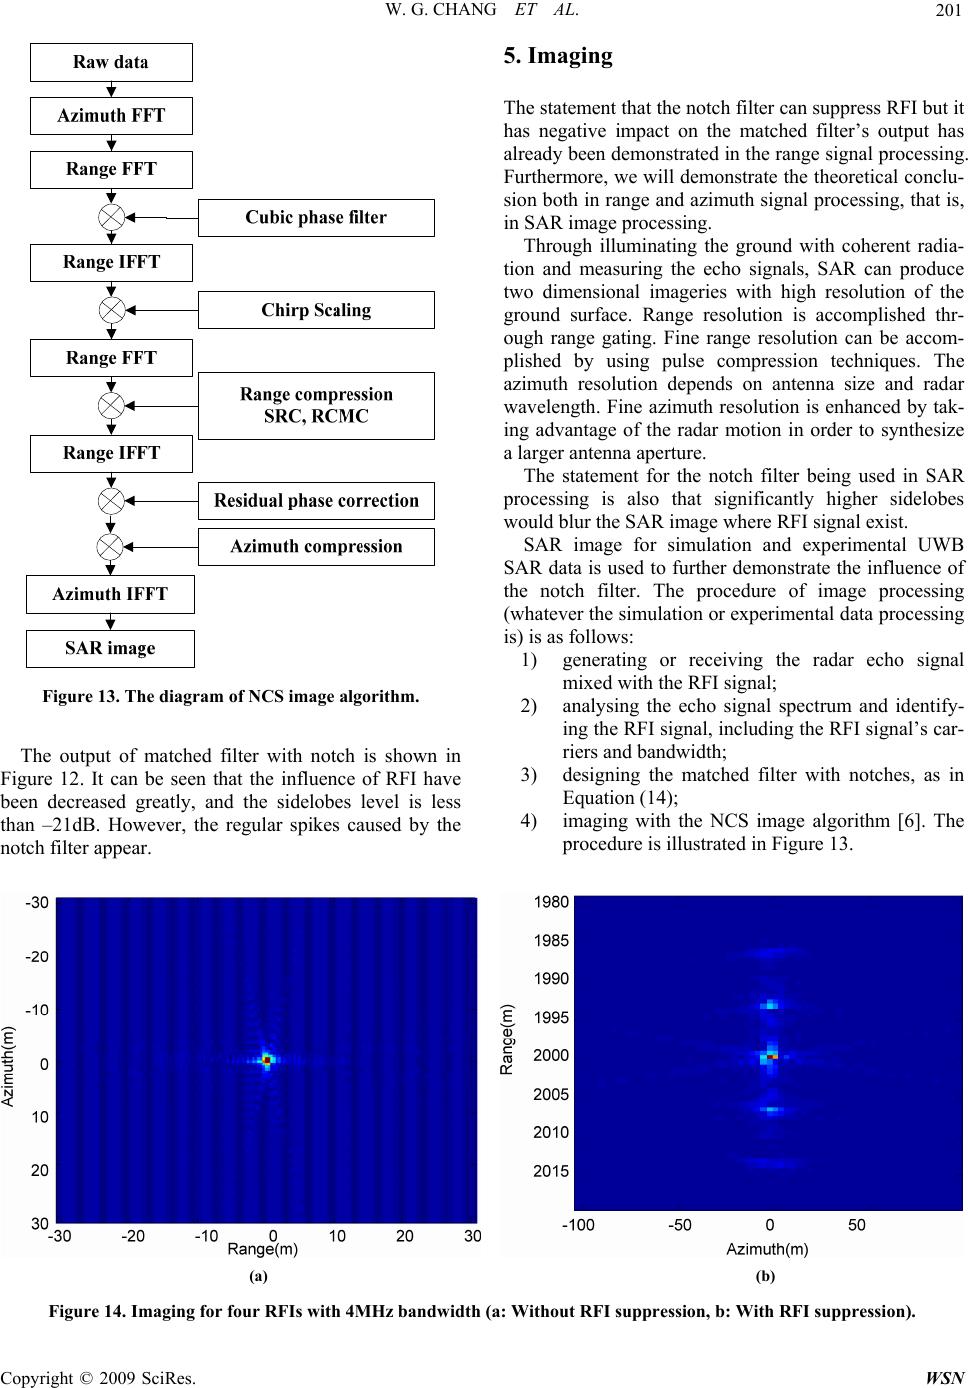 W. G. CHANG ET AL. Copyright © 2009 SciRes. WSN 201 5. Imaging The statement that the notch filter can suppress RFI but it has negative impact on the matched filter’s output has already been demonstrated in the range signal processing. Furthermore, we will demonstrate the theoretical conclu- sion both in range and azimuth signal processing, that is, in SAR image processing. Through illuminating the ground with coherent radia- tion and measuring the echo signals, SAR can produce two dimensional imageries with high resolution of the ground surface. Range resolution is accomplished thr- ough range gating. Fine range resolution can be accom- plished by using pulse compression techniques. The azimuth resolution depends on antenna size and radar wavelength. Fine azimuth resolution is enhanced by tak- ing advantage of the radar motion in order to synthesize a larger antenna aperture. The statement for the notch filter being used in SAR processing is also that significantly higher sidelobes would blur the SAR image where RFI signal exist. SAR image for simulation and experimental UWB SAR data is used to further demonstrate the influence of the notch filter. The procedure of image processing (whatever the simulation or experimental data processing is) is as follows: 1) generating or receiving the radar echo signal mixed with the RFI signal; Figure 13. The diagram of NCS image algorithm. 2) analysing the echo signal spectrum and identify- ing the RFI signal, including the RFI signal’s car- riers and bandwidth; The output of matched filter with notch is shown in Figure 12. It can be seen that the influence of RFI have been decreased greatly, and the sidelobes level is less than –21dB. However, the regular spikes caused by the notch filter appear. 3) designing the matched filter with notches, as in Equation (14); 4) imaging with the NCS image algorithm [6]. The procedure is illustrated in Figure 13. (a) (b) Figure 14. Imaging for four RFIs with 4MHz bandwidth (a: Without RFI suppression, b: With RFI suppression).  W. G. CHANG ET AL. 202 Range(m) Azimuth ( m ) -100 -50 050 1980 1985 1990 1995 2000 2005 2010 2015 Range(m) Azimuth ( m ) -100 -50050 1980 1985 1990 1995 2000 2005 2010 2015 (a) (b) Figure 15. Imaging for four RFIs with 8MHz bandwidth (a: Without RFI suppression, b: With RFI suppression). 5.1. Imaging for Simulation In order to study the effect of the notch filter, we have LFM signal with 20us pulse-width and 200MHz band- width to mix with four RFI signals to form the radar echo. Firstly, the bandwidths of all the RFI signals are as- sumed to be the same as 4MHz, and the carriers are 22MHz, 44MHz, 66MHz and 88MHz respectively. After the filter with the four notches and the SAR image is processed, the result is shown in Figure 14. Figure 14(a) is the figure without any RFI suppression, so the regular texture caused by RFI can be seen clearly and Figure 14(b) is the figure with RFI suppression using the notch filter, where the regular texture disappears, but the false targets in range, caused by the notch filter, appear. Then all the RFI signal bandwidths are assumed to be 8MHz whereas the other conditions are kept as above. The imaging result is shown in Figure 15. Figure 15(a) is the figure without any RFI suppression and Figure 15(b) is the figure with RFI suppression using the notch filter. Comparing Figure 14 to Figure 15, we find that RFI certainly blur the SAR image without RFI suppression, whereas the false targets appear in the SAR image with RFI suppression using the notch filter. From the simula- tion we find that the wider bandwidth the RFI signals have, the stronger the false targets appear in the image. This observation is consistent with the theoretical con- clusion. The influence of the RFI quantities has been studied, and with Figure 14 and Figure 15, the numerical values are measured and described in Table 1 and Table 2, where Table 1 is the result without any RFI suppression and Table 2 is the result with RFI suppression using the notch filter. In the table, the term (N×RFI with BMHz) means that there are N RFI signals with BMHz band- width in the radar echo. We draw further conclusions from Table 1 and Table 2, namely that the notch filter has significant effect on sidelobes, as the quantities and the RFI bandwidth in- crease, the sidelobes rise too. Raised sidelobes result in the SAR image having more false targets. We also have the conclusion from Table 1 and Table 2 that the notch filter has little effect on the SAR resolu- tion. 5.2. Imaging for Experimental UWB SAR Data The matched filter with notches is applied to experimental UWB SAR data to verify the simulation and theoretical Table 1. SAR performance without RFI suppression. Resolution(m) PSLR(dB) ISLR(dB) 2×RFI with 4MHz 0.66(r)×0.9(a) –11.32 –9.71 2×RFI with 8MHz 0.66(r)×0.9(a) –11.8 –9.71 8×RFI with 4MHz 0.66(r)×0.9(a) –11.23 –9.15 8×RFI with 8MHz 0.66(r)×0.9(a) –11.59 –9.74 *Note: ISLR is calculated only in range dimension. Table 2. SAR performance with RFI suppression. Resolution(m) PSLR(dB) ISLR(dB) 2×RFI with 4MHz 0.66(r)×0.9(a) –11.12 –6.04 2×RFI with 8MHz 0.66(r)×0.9(a) –7.84 –2.15 8×RFI with 4MHz 0.66(r)×0.9(a) –11.12 –4.12 8×RFI with 8MHz 0.66(r)×0.9(a) –9.06 1.1 *Note: ISLR is calculated only in range dimension. Copyright © 2009 SciRes. WSN 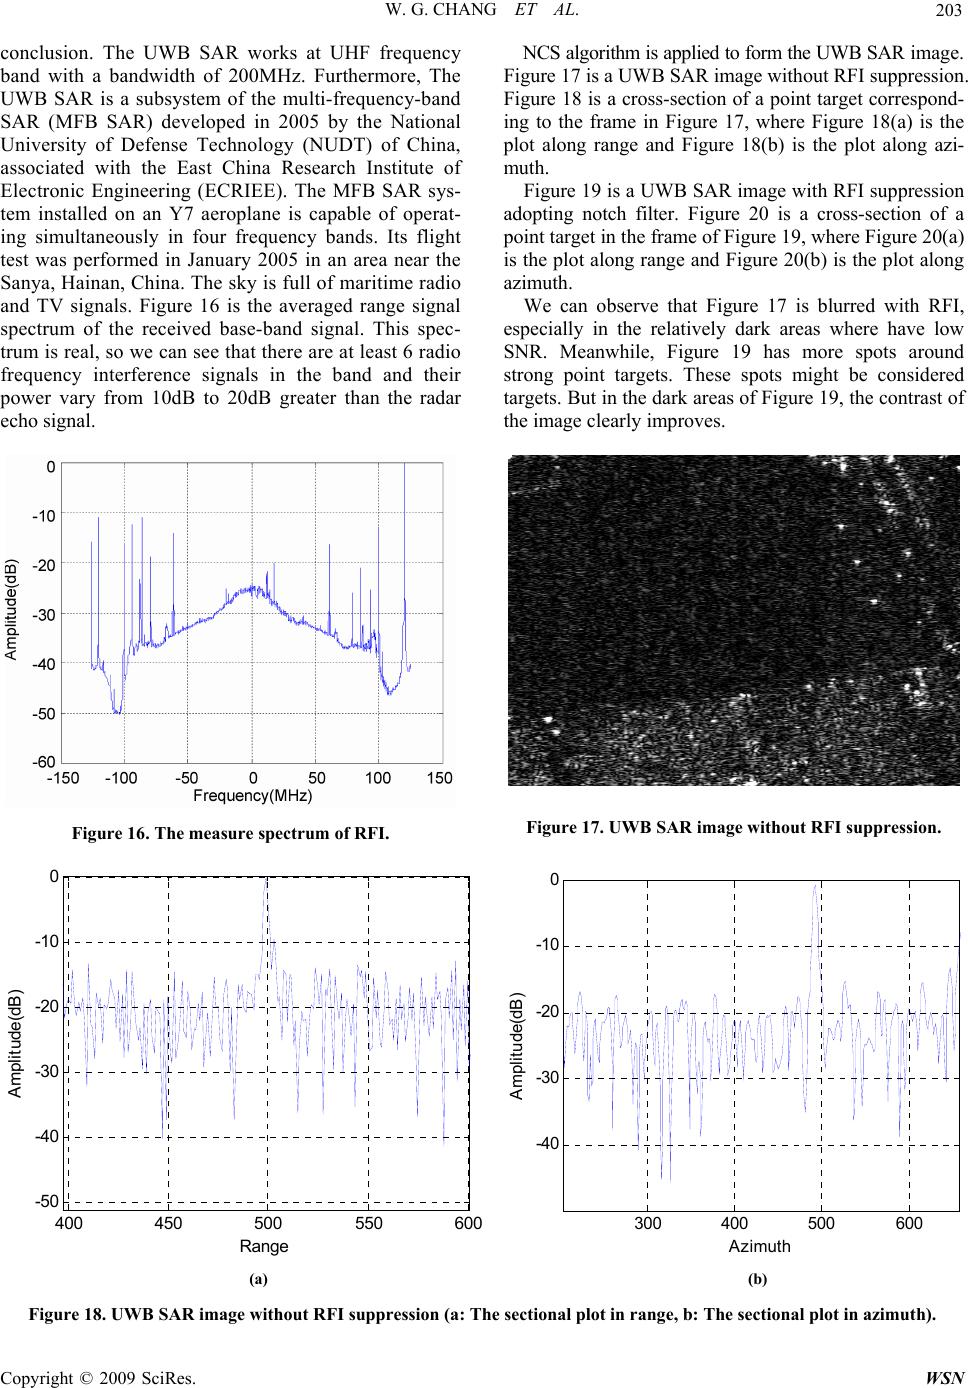 W. G. CHANG ET AL. 203 conclusion. The UWB SAR works at UHF frequency band with a bandwidth of 200MHz. Furthermore, The UWB SAR is a subsystem of the multi-frequency-band SAR (MFB SAR) developed in 2005 by the National University of Defense Technology (NUDT) of China, associated with the East China Research Institute of Electronic Engineering (ECRIEE). The MFB SAR sys- tem installed on an Y7 aeroplane is capable of operat- ing simultaneously in four frequency bands. Its flight test was performed in January 2005 in an area near the Sanya, Hainan, China. The sky is full of maritime radio and TV signals. Figure 16 is the averaged range signal spectrum of the received base-band signal. This spec- trum is real, so we can see that there are at least 6 radio frequency interference signals in the band and their power vary from 10dB to 20dB greater than the radar echo signal. Figure 16. The measure spectrum of RFI. NCS algorithm is applied to form the UWB SAR image. Figure 17 is a UWB SAR image without RFI suppression. Figure 18 is a cross-section of a point target correspond- ing to the frame in Figure 17, where Figure 18(a) is the plot along range and Figure 18(b) is the plot along azi- muth. Figure 19 is a UWB SAR image with RFI suppression adopting notch filter. Figure 20 is a cross-section of a point target in the frame of Figure 19, where Figure 20(a) is the plot along range and Figure 20(b) is the plot along azimuth. We can observe that Figure 17 is blurred with RFI, especially in the relatively dark areas where have low SNR. Meanwhile, Figure 19 has more spots around strong point targets. These spots might be considered targets. But in the dark areas of Figure 19, the contrast of the image clearly improves. Figure 17. UWB SAR image without RFI suppression. 400 450 500 550 600 -50 -40 -30 -20 -10 0 Range Amplitude(dB) 300 400 500 600 -40 -30 -20 -10 0 Azimuth Ampl itude(dB ) (a) (b) Figure 18. UWB SAR image without RFI suppression (a: The sectional plot in range, b: The sectional plot in azimuth). C opyright © 2009 SciRes. WSN 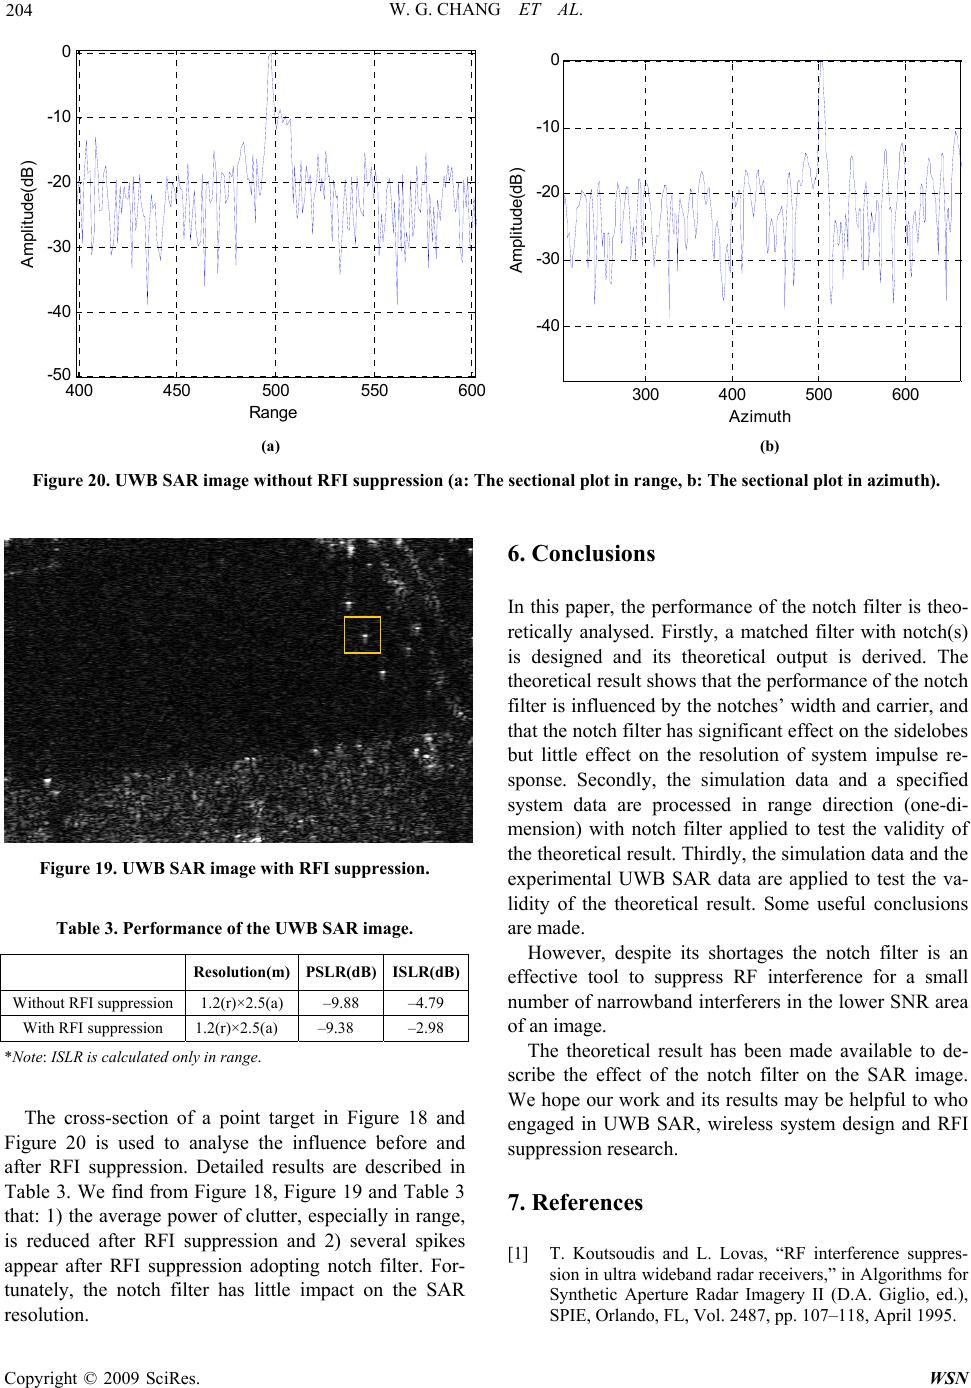 W. G. CHANG ET AL. 204 400 450500550 600 -50 -40 -30 -20 -10 0 Range A mplitude(dB ) 300 400 500 600 -40 -30 -20 -10 0 Azimuth Ampli tude(dB) (a) (b) Figure 20. UWB SAR image without RFI suppression (a: The sectional plot in range, b: The sectional plot in azimuth). Figure 19. UWB SAR image with RFI suppression. Table 3. Performance of the UWB SAR image. Resolution(m) PSLR(dB) ISLR(dB) Without RFI suppression 1.2(r)×2.5(a) –9.88 –4.79 With RFI suppression 1.2(r)×2.5(a) –9.38 –2.98 *Note: ISLR is calculated only in range. The cross-section of a point target in Figure 18 and Figure 20 is used to analyse the influence before and after RFI suppression. Detailed results are described in Table 3. We find from Figure 18, Figure 19 and Table 3 that: 1) the average power of clutter, especially in range, is reduced after RFI suppression and 2) several spikes appear after RFI suppression adopting notch filter. For- tunately, the notch filter has little impact on the SAR resolution. 6. Conclusions In this paper, the performance of the notch filter is theo- retically analysed. Firstly, a matched filter with notch(s) is designed and its theoretical output is derived. The theoretical result shows that the performance of the notch filter is influenced by the notches’ width and carrier, and that the notch filter has significant effect on the sidelobes but little effect on the resolution of system impulse re- sponse. Secondly, the simulation data and a specified system data are processed in range direction (one-di- mension) with notch filter applied to test the validity of the theoretical result. Thirdly, the simulation data and the experimental UWB SAR data are applied to test the va- lidity of the theoretical result. Some useful conclusions are made. However, despite its shortages the notch filter is an effective tool to suppress RF interference for a small number of narrowband interferers in the lower SNR area of an image. The theoretical result has been made available to de- scribe the effect of the notch filter on the SAR image. We hope our work and its results may be helpful to who engaged in UWB SAR, wireless system design and RFI suppression research. 7. References [1] T. Koutsoudis and L. Lovas, “RF interference suppres- sion in ultra wideband radar receivers,” in Algorithms for Synthetic Aperture Radar Imagery II (D.A. Giglio, ed.), SPIE, Orlando, FL, Vol. 2487, pp. 107–118, April 1995. Copyright © 2009 SciRes. WSN 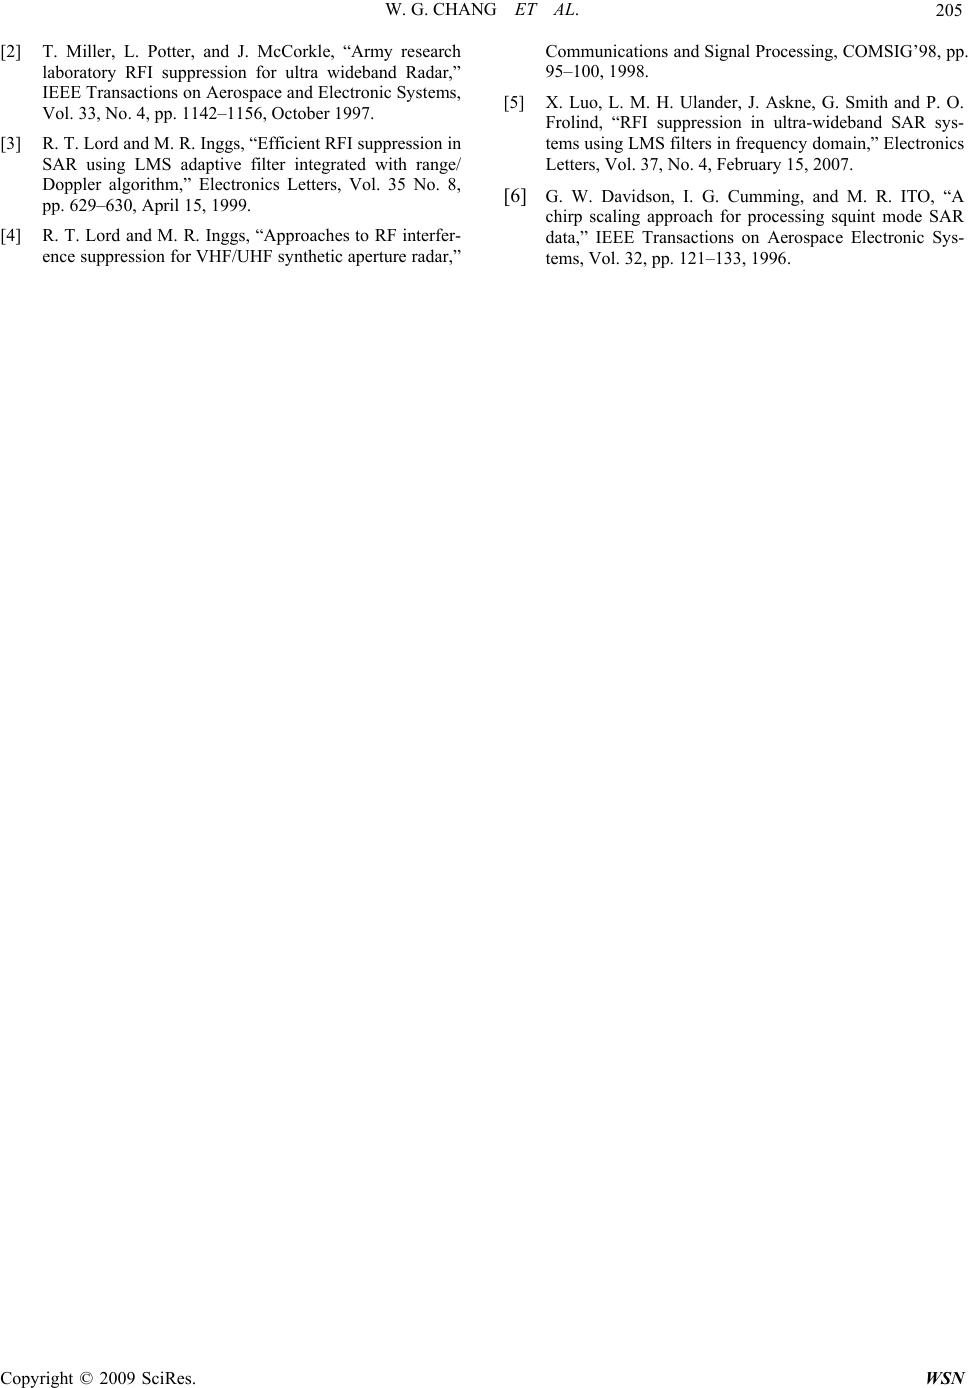 W. G. CHANG ET AL. 205 [2] T. Miller, L. Potter, and J. McCorkle, “Army research laboratory RFI suppression for ultra wideband Radar,” IEEE Transactions on Aerospace and Electronic Systems, Vol. 33, No. 4, pp. 1142–1156, October 1997. [3] R. T. Lord and M. R. Inggs, “Efficient RFI suppression in SAR using LMS adaptive filter integrated with range/ Doppler algorithm,” Electronics Letters, Vol. 35 No. 8, pp. 629–630, April 15, 1999. [4] R. T. Lord and M. R. Inggs, “Approaches to RF interfer- ence suppression for VHF/UHF synthetic aperture radar,” Communications and Signal Processing, COMSIG’98, pp. 95–100, 1998. [5] X. Luo, L. M. H. Ulander, J. Askne, G. Smith and P. O. Frolind, “RFI suppression in ultra-wideband SAR sys- tems using LMS filters in frequency domain,” Electronics Letters, Vol. 37, No. 4, February 15, 2007. [6] G. W. Davidson, I. G. Cumming, and M. R. ITO, “A chirp scaling approach for processing squint mode SAR data,” IEEE Transactions on Aerospace Electronic Sys- tems, Vol. 32, pp. 121–133, 1996. C opyright © 2009 SciRes. WSN |