Paper Menu >>
Journal Menu >>
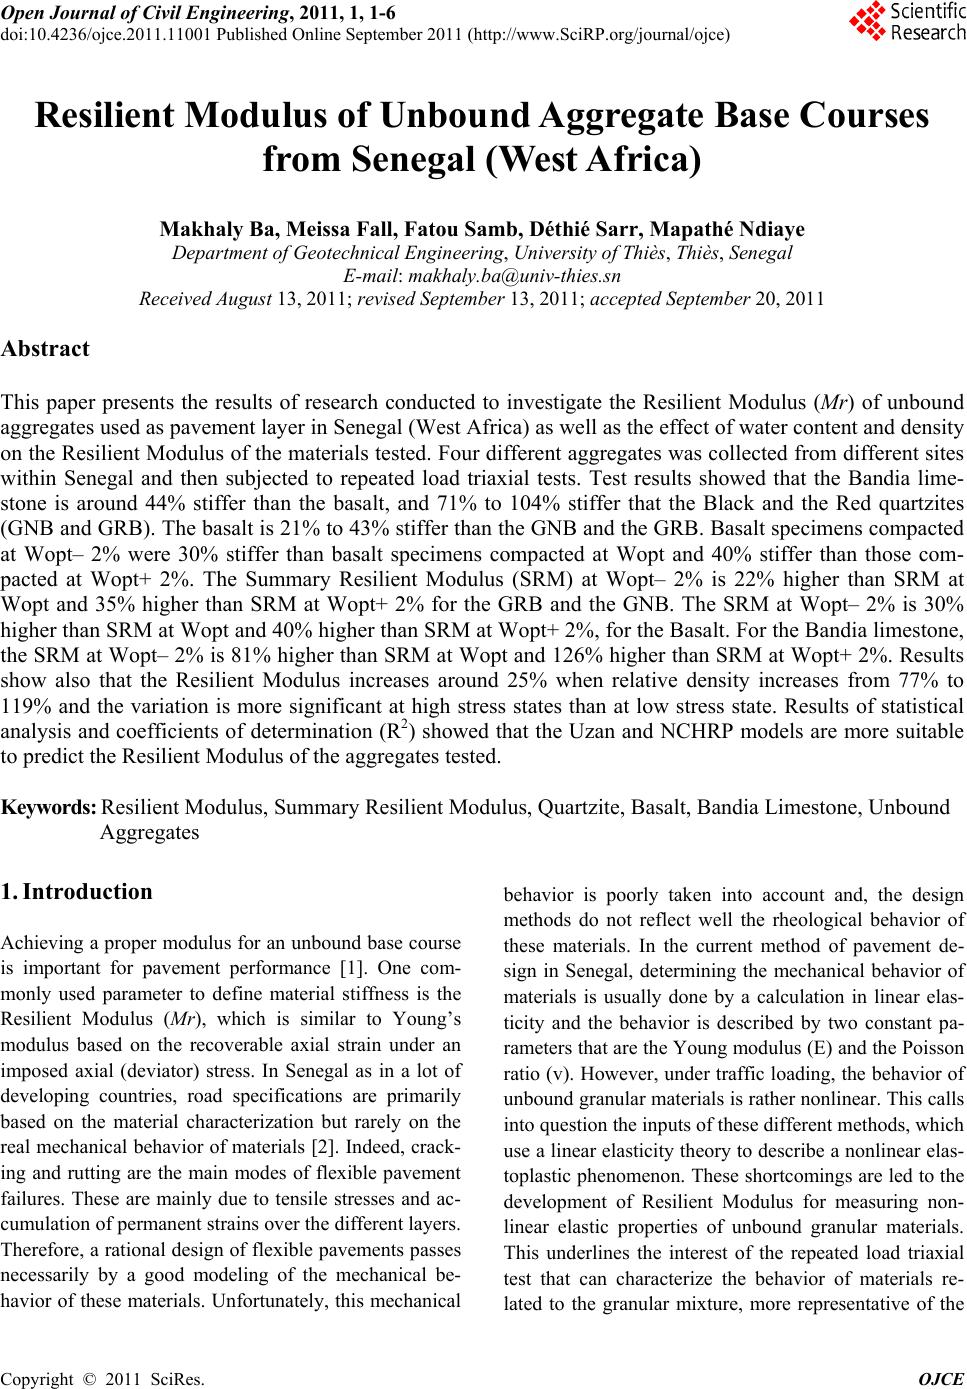 Open Journal of Civil Engineering, 2011, 1, 1-6 doi:10.4236/ojce.2011.11001 Published Online September 2011 (http://www.SciRP.org/journal/ojce) Copyright © 2011 SciRes. OJCE Resilient Modulus of Unbound Aggregate Base Courses from Senegal (West Africa) Makhaly Ba, Meissa Fall, Fatou Samb, Déthié Sarr, Mapathé Ndiaye Department of Geotechnical Engineering, University of Thiès, Thiès, Senegal E-mail: makhaly.ba@univ-thies.sn Received August 13, 2011; revised September 13, 2011; accepted September 20, 2011 Abstract This paper presents the results of research conducted to investigate the Resilient Modulus (Mr) of unbound aggregates used as pavement layer in Senegal (West Africa) as well as the effect of water content and density on the Resilient Modulus of the materials tested. Four different aggregates was collected from different sites within Senegal and then subjected to repeated load triaxial tests. Test results showed that the Bandia lime- stone is around 44% stiffer than the basalt, and 71% to 104% stiffer that the Black and the Red quartzites (GNB and GRB). The basalt is 21% to 43% stiffer than the GNB and the GRB. Basalt specimens compacted at Wopt– 2% were 30% stiffer than basalt specimens compacted at Wopt and 40% stiffer than those com- pacted at Wopt+ 2%. The Summary Resilient Modulus (SRM) at Wopt– 2% is 22% higher than SRM at Wopt and 35% higher than SRM at Wopt+ 2% for the GRB and the GNB. The SRM at Wopt– 2% is 30% higher than SRM at Wopt and 40% higher than SRM at Wopt+ 2%, for the Basalt. For the Bandia limestone, the SRM at Wopt– 2% is 81% higher than SRM at Wopt and 126% higher than SRM at Wopt+ 2%. Results show also that the Resilient Modulus increases around 25% when relative density increases from 77% to 119% and the variation is more significant at high stress states than at low stress state. Results of statistical analysis and coefficients of determination (R2) showed that the Uzan and NCHRP models are more suitable to predict the Resilient Modulus of the aggregates tested. Keywords: Resilient Modulus, Summary Resilient Modulus, Quartzite, Basalt, Bandia Limestone, Unbound Aggregates 1. Introduction Achieving a proper modulus for an unbound base course is important for pavement performance [1]. One com- monly used parameter to define material stiffness is the Resilient Modulus (Mr), which is similar to Young’s modulus based on the recoverable axial strain under an imposed axial (deviator) stress. In Senegal as in a lot of developing countries, road specifications are primarily based on the material characterization but rarely on the real mechanical behavior of materials [2]. Indeed, crack- ing and rutting are the main modes of flexible pavement failures. These are mainly due to tensile stresses and ac- cumulation of permanent strains over the d iff er en t laye r s. Therefore, a rational design of flexible pavements passes necessarily by a good modeling of the mechanical be- havior of these materials. Unfortunately, this mechanical behavior is poorly taken into account and, the design methods do not reflect well the rheological behavior of these materials. In the current method of pavement de- sign in Senegal, determining the mechanical behavior of materials is usually done by a calculation in linear elas- ticity and the behavior is described by two constant pa- rameters that are the Young modulus (E) and the Poisson ratio (v). However, under traffic loading, the behavior of unbound granular materials is rather nonlin ear. This calls into question the inputs of these different methods, which use a linear elasticity theory to describe a nonlinear elas- toplastic phenomenon. These shortcomings are led to the development of Resilient Modulus for measuring non- linear elastic properties of unbound granular materials. This underlines the interest of the repeated load triaxial test that can characterize the behavior of materials re- lated to the granular mixture, more representative of the 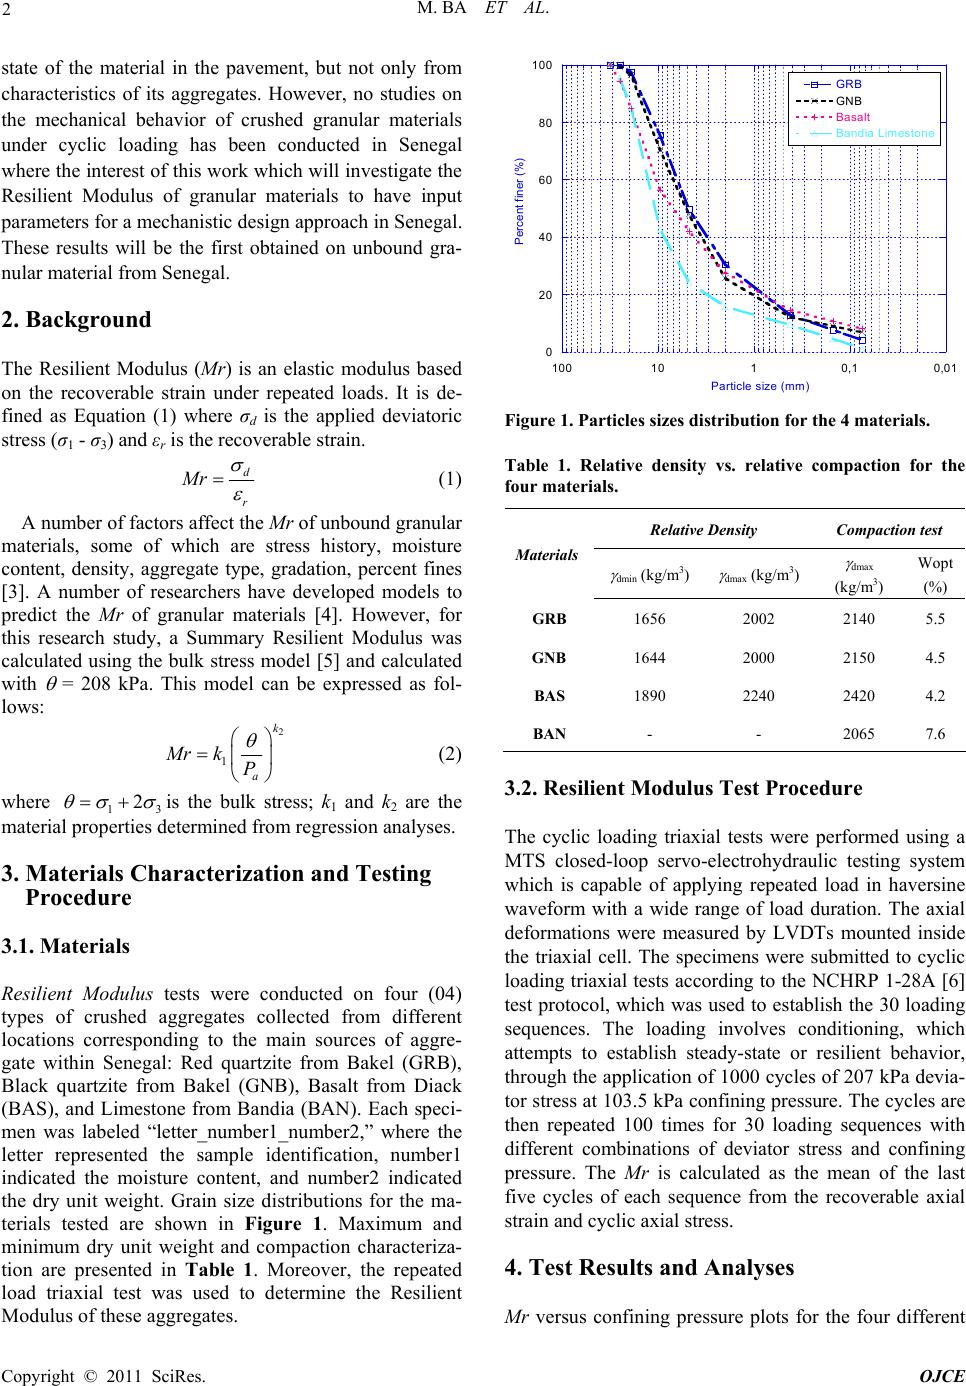 M. BA ET AL. Copyright © 2011 SciRes. OJCE 2 state of the material in the pavement, but not only from characteristics of its aggregates. However, no studies on the mechanical behavior of crushed granular materials under cyclic loading has been conducted in Senegal where the interest of this work wh ich will investigate the Resilient Modulus of granular materials to have input parameters for a mechanistic design approach in Senegal. These results will be the first obtained on unbound gra- nular material from Senegal. 2. Background The Resilient Modulus (Mr) is an elastic modulus based on the recoverable strain under repeated loads. It is de- fined as Equation (1) where σd is the applied deviatoric stress (σ1 - σ3) and εr is the recoverable strain. d r Mr (1) A number of factors affect the Mr of unbound granular materials, some of which are stress history, moisture content, density, aggregate type, gradation, percent fines [3]. A number of researchers have developed models to predict the Mr of granular materials [4]. However, for this research study, a Summary Resilient Modulus was calculated using the bulk stress model [5] and calculated with = 208 kPa. This model can be expressed as fol- lows: 2 1 k a Mrk P (2) where 13 2 is the bulk stress; k1 and k2 are the material properties determined from regression analyses. 3. Materials Characterization and Testing Procedure 3.1. Materials Resilient Modulus tests were conducted on four (04) types of crushed aggregates collected from different locations corresponding to the main sources of aggre- gate within Senegal: Red quartzite from Bakel (GRB), Black quartzite from Bakel (GNB), Basalt from Diack (BAS), and Limestone from Bandia (BAN). Each speci- men was labeled “letter_number1_number2,” where the letter represented the sample identification, number1 indicated the moisture content, and number2 indicated the dry unit weight. Grain size distributions for the ma- terials tested are shown in Figure 1. Maximum and minimum dry unit weight and compaction characteriza- tion are presented in Table 1. Moreover, the repeated load triaxial test was used to determine the Resilient Modulus of these aggregates. 0 20 40 60 80 100 0,010,1110100 GRB GNB Basalt Bandia Limestone Percent fi n er (%) Particle size (mm) Figure 1. Particles sizes distribution for the 4 materials. Table 1. Relative density vs. relative compaction for the four materials. Relative Density Compaction test Materials dmin (kg/m3) dmax (kg/m3) dmax (kg/m3) Wopt (%) GRB 1656 2002 2140 5.5 GNB 1644 2000 2150 4.5 BAS 1890 2240 2420 4.2 BAN - - 2065 7.6 3.2. Resilient Modulus Test Procedure The cyclic loading triaxial tests were performed using a MTS closed-loop servo-electrohydraulic testing system which is capable of applying repeated load in haversine waveform with a wide range of load duration. The axial deformations were measured by LVDTs mounted inside the triaxial cell. The specimens were submitted to cyclic loading triaxial tests according to the NCHRP 1-28A [6] test protocol, which was used to establish the 30 loading sequences. The loading involves conditioning, which attempts to establish steady-state or resilient behavior, through the application of 1000 cycles of 207 kPa devia- tor stress at 103.5 kPa confining pressure. The cycles are then repeated 100 times for 30 loading sequences with different combinations of deviator stress and confining pressure. The Mr is calculated as the mean of the last five cycles of each sequence from the recoverable axial strain and cyclic axial stress. 4. Test Results and Analyses Mr versus confining pressure plots for the four different 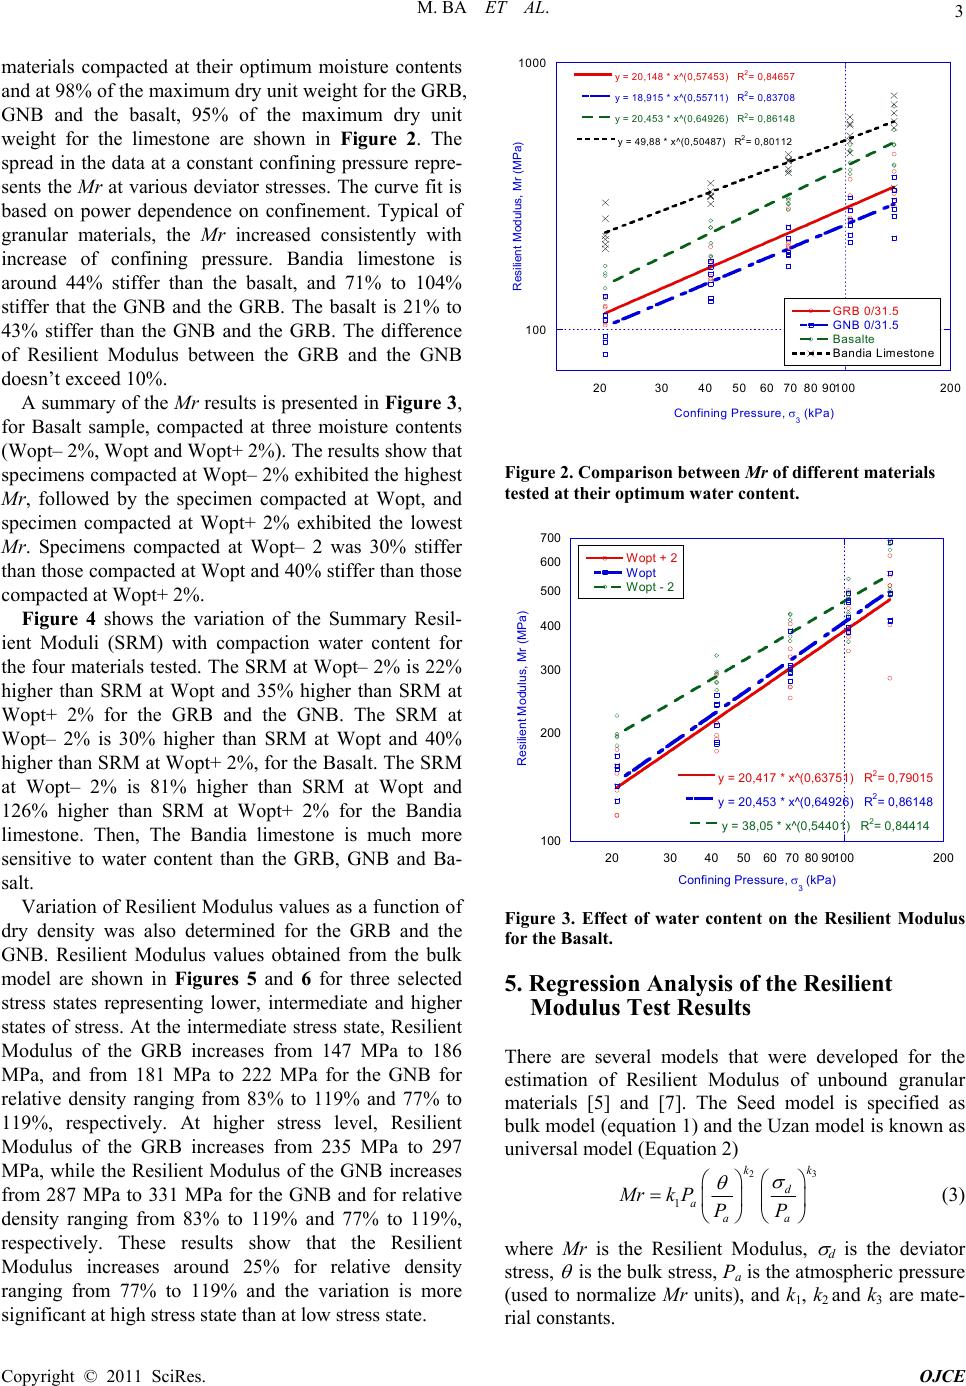 M. BA ET AL. Copyright © 2011 SciRes. OJCE 3 materials compacted at their optimum moisture contents and at 98% of the maximum dry unit weight for the GRB, GNB and the basalt, 95% of the maximum dry unit weight for the limestone are shown in Figure 2. The spread in the data at a constant confining pressure repre- sents the Mr at various deviator stresses. The curve fit is based on power dependence on confinement. Typical of granular materials, the Mr increased consistently with increase of confining pressure. Bandia limestone is around 44% stiffer than the basalt, and 71% to 104% stiffer that the GNB and the GRB. The basalt is 21% to 43% stiffer than the GNB and the GRB. The difference of Resilient Modulus between the GRB and the GNB doesn’t exceed 10%. A summary of the Mr results is presented in Figure 3, for Basalt sample, compacted at three moisture contents (Wopt– 2%, Wopt and Wopt+ 2%). The results show that specimens compacted at Wopt– 2% exhibited the highest Mr, followed by the specimen compacted at Wopt, and specimen compacted at Wopt+ 2% exhibited the lowest Mr. Specimens compacted at Wopt– 2 was 30% stiffer than those compacted at Wopt and 40% stiffer than those compacted at Wopt+ 2%. Figure 4 shows the variation of the Summary Resil- ient Moduli (SRM) with compaction water content for the four materials tested. The SRM at Wopt– 2% is 22% higher than SRM at Wopt and 35% higher than SRM at Wopt+ 2% for the GRB and the GNB. The SRM at Wopt– 2% is 30% higher than SRM at Wopt and 40% higher than SRM at Wopt+ 2%, for the Basalt. The SRM at Wopt– 2% is 81% higher than SRM at Wopt and 126% higher than SRM at Wopt+ 2% for the Bandia limestone. Then, The Bandia limestone is much more sensitive to water content than the GRB, GNB and Ba- salt. Variation of Resilient Modulus values as a function of dry density was also determined for the GRB and the GNB. Resilient Modulus values obtained from the bulk model are shown in Figures 5 and 6 for three selected stress states representing lower, intermediate and higher states of stress. At the intermediate stress state, Resilient Modulus of the GRB increases from 147 MPa to 186 MPa, and from 181 MPa to 222 MPa for the GNB for relative density ranging from 83% to 119% and 77% to 119%, respectively. At higher stress level, Resilient Modulus of the GRB increases from 235 MPa to 297 MPa, while the Resilient Modulus of the GNB increases from 287 MPa to 331 MPa for the GNB and for relative density ranging from 83% to 119% and 77% to 119%, respectively. These results show that the Resilient Modulus increases around 25% for relative density ranging from 77% to 119% and the variation is more significant at high stress state than at low stress state. 100 1000 20304050607080 90100200 GRB 0/31.5 GNB 0/31.5 Basalte Bandia Limestone y = 20,148 * x^(0,57453) R2= 0,84657 y = 18,915 * x^(0,55711) R2= 0,83708 y = 20,453 * x^(0,64926) R2= 0,86148 y = 49,8 8 * x ^(0,50 487) R2= 0,80112 Resilient Modulus, Mr (MPa) Confining Pressure, 3 (kPa) Figure 2. Comparison between Mr of different materials tested at their optimum water content. 100 200 300 400 500 600 700 2030405060708090100200 Wopt + 2 Wopt Wopt - 2 y = 20,417 * x^(0,63751) R2= 0,79015 y = 20,453 * x^(0,64926) R2= 0,86148 y = 38,05 * x^(0,54401) R2= 0,84414 Resilient Modulus, Mr (MPa) Confining Pressure, 3 (kPa) Figure 3. Effect of water content on the Resilient Modulus for the Basalt. 5. Regression Analysis of the Resilient Modulus Test Results There are several models that were developed for the estimation of Resilient Modulus of unbound granular materials [5] and [7]. The Seed model is specified as bulk model (equation 1) and the Uzan model is known as universal model (Equation 2) 23 1 kk d a aa Mrk PPP (3) where Mr is the Resilient Modulus, d is the deviator stress, is the bulk stress, Pa is the atmospheric pressure (used to normalize Mr units), and k1, k2 and k3 are mate- rial constants. 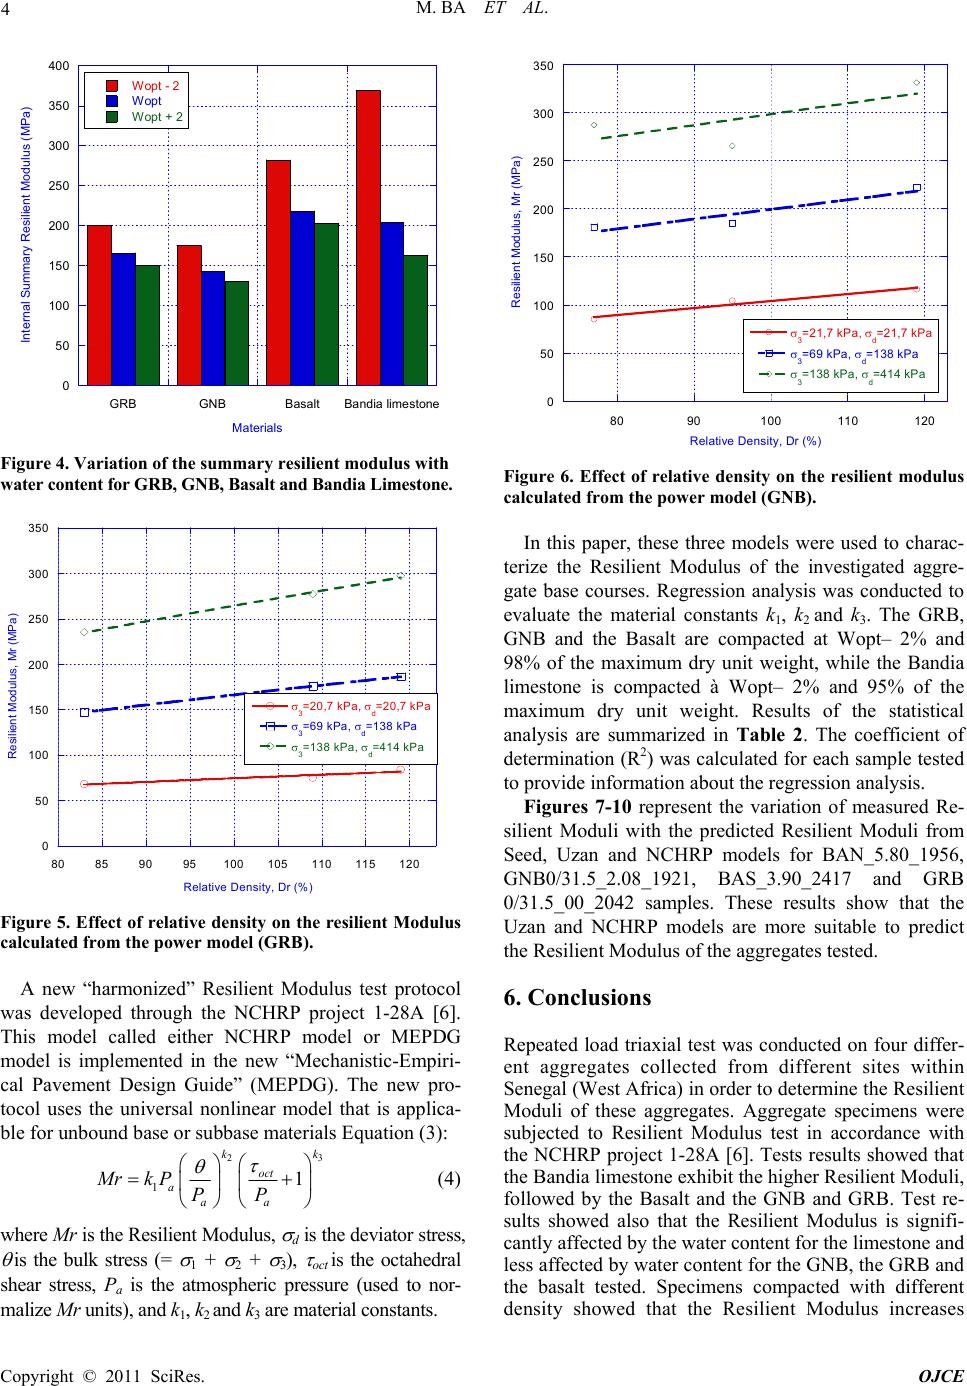 M. BA ET AL. Copyright © 2011 SciRes. OJCE 4 0 50 100 150 200 250 300 350 400 GRBGNBBas a l tBan dia li m estone Wopt - 2 Wopt Wopt + 2 Internal Summary Resilient Modulus (MPa) Materials Figure 4. Variation of the summary resilient modulus with water content for GRB, GNB, Basalt and Bandia Limestone. 0 50 100 150 200 250 300 350 80859095100105 110 115 120 3=20,7 kPa, d=20,7 kPa 3=69 kPa, d=138 kPa 3=138 kPa, d=414 kPa Resilient Modulus, Mr (MPa) Relative D en sity, D r (%) Figure 5. Effect of relative density on the resilient Modulus calculated from the power model (GRB). A new “harmonized” Resilient Modulus test protocol was developed through the NCHRP project 1-28A [6]. This model called either NCHRP model or MEPDG model is implemented in the new “Mechanistic-Empiri- cal Pavement Design Guide” (MEPDG). The new pro- tocol uses the universal nonlinear model that is applica- ble for unbound base or su bbase materials Equation (3): 23 11 kk oct a aa Mrk PPP (4) where Mr is the Res ili ent Modu lus, d is the deviator stre ss, is the bulk stress (= 1 + 2 + 3), oct is the octahedral shear stress, Pa is the atmospheric pressure (used to nor- malize Mr units), and k1, k2 and k3 are mat erial constants. 0 50 100 150 200 250 300 350 8090100 110 120 3=21,7 kPa, d=21,7 kPa 3=69 kPa, d=138 kPa 3=138 kPa, d=414 kPa Resilient Modulus, Mr (MPa) Rel ati ve De ns i ty, Dr (%) Figure 6. Effect of relative density on the resilient modulus calculated from the power model (GNB). In this paper, these three models were used to charac- terize the Resilient Modulus of the investigated aggre- gate base courses. Regression analysis was conducted to evaluate the material constants k1, k2 and k3. The GRB, GNB and the Basalt are compacted at Wopt– 2% and 98% of the maximum dry unit weight, while the Bandia limestone is compacted à Wopt– 2% and 95% of the maximum dry unit weight. Results of the statistical analysis are summarized in Table 2. The coefficient of determination (R2) was calculated for each sample tested to provide information about the regression analysis. Figures 7-10 represent the variation of measured Re- silient Moduli with the predicted Resilient Moduli from Seed, Uzan and NCHRP models for BAN_5.80_1956, GNB0/31.5_2.08_1921, BAS_3.90_2417 and GRB 0/31.5_00_2042 samples. These results show that the Uzan and NCHRP models are more suitable to predict the Resilient Modulus of the aggregates tested. 6. Conclusions Repeated load triaxial test was conducted on four differ- ent aggregates collected from different sites within Senegal (West Africa) in order to determine the Resilient Moduli of these aggregates. Aggregate specimens were subjected to Resilient Modulus test in accordance with the NCHRP project 1-28A [6]. Tests results showed that the Bandia limestone exhib it the higher Resilien t Modu li, followed by the Basalt and the GNB and GRB. Test re- sults showed also that the Resilient Modulus is signifi- cantly affected by the water content for the limestone and less affected by water content for the GNB, the GRB and the basalt tested. Specimens compacted with different density showed that the Resilient Modulus increases 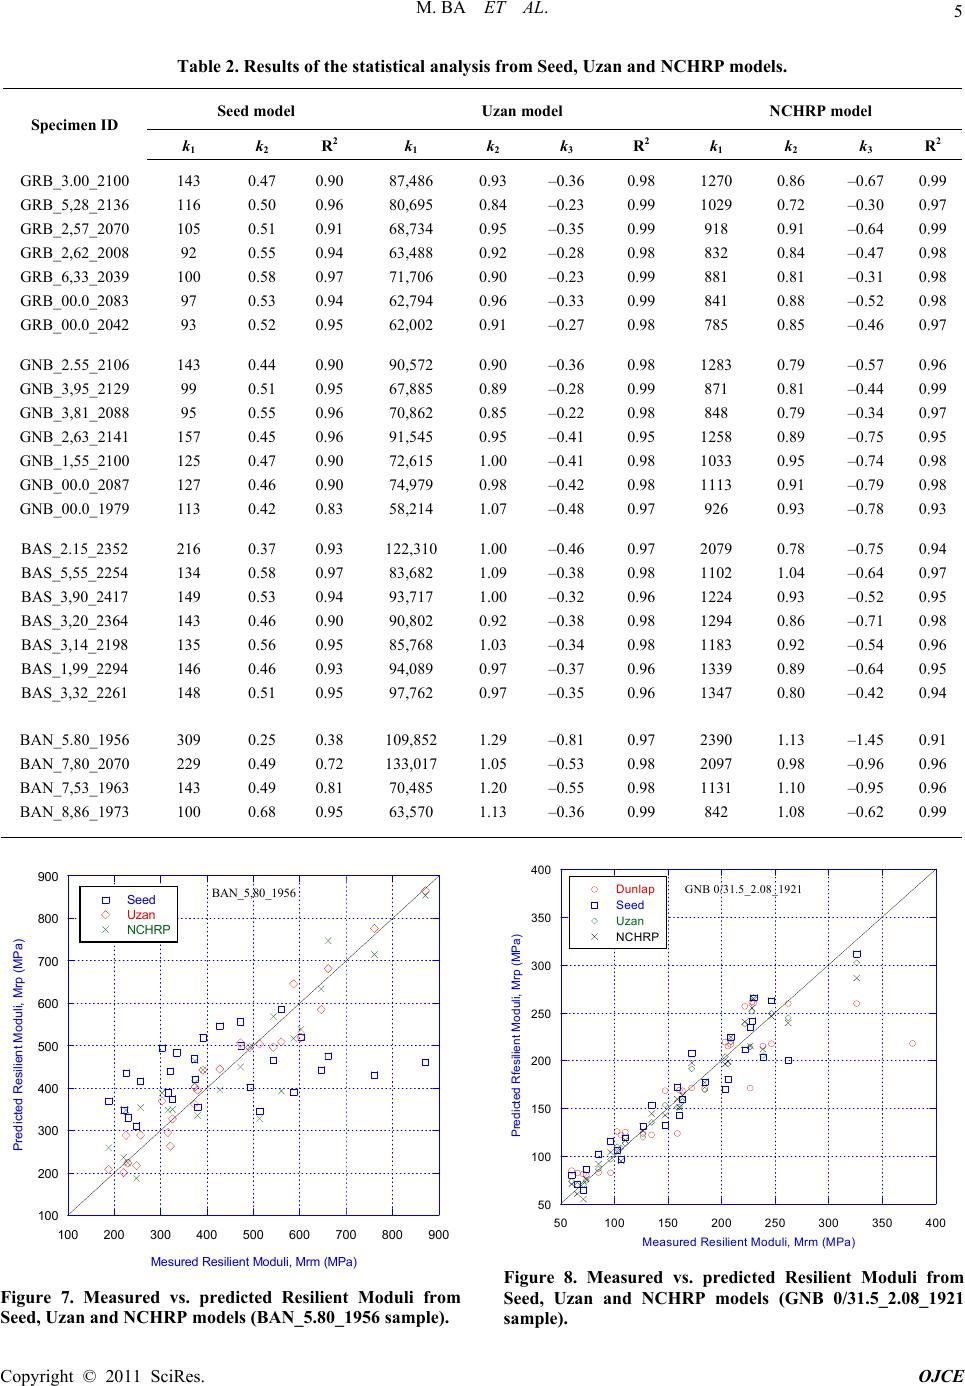 M. BA ET AL. Copyright © 2011 SciRes. OJCE 5 Table 2. Results of the statistical analysis from Seed, Uzan and NCHRP models. Seed model Uzan model NCHRP model Specimen ID k1 k2 R 2 k1 k2 k3 R 2 k1 k2 k3 R 2 GRB_3.00_2100 GRB_5,28_2136 GRB_2,57_2070 GRB_2,62_2008 GRB_6,33_2039 GRB_00.0_2083 GRB_00.0_2042 143 116 105 92 100 97 93 0.47 0.50 0.51 0.55 0.58 0.53 0.52 0.90 0.96 0.91 0.94 0.97 0.94 0.95 87,486 80,695 68,734 63,488 71,706 62,794 62,002 0.93 0.84 0.95 0.92 0.90 0.96 0.91 –0.36 –0.23 –0.35 –0.28 –0.23 –0.33 –0.27 0.98 0.99 0.99 0.98 0.99 0.99 0.98 1270 1029 918 832 881 841 785 0.86 0.72 0.91 0.84 0.81 0.88 0.85 –0.67 –0.30 –0.64 –0.47 –0.31 –0.52 –0.46 0.99 0.97 0.99 0.98 0.98 0.98 0.97 GNB_2.55_2106 GNB_3,95_2129 GNB_3,81_2088 GNB_2,63_2141 GNB_1,55_2100 GNB_00.0_2087 GNB_00.0_1979 143 99 95 157 125 127 113 0.44 0.51 0.55 0.45 0.47 0.46 0.42 0.90 0.95 0.96 0.96 0.90 0.90 0.83 90,572 67,885 70,862 91,545 72,615 74,979 58,214 0.90 0.89 0.85 0.95 1.00 0.98 1.07 –0.36 –0.28 –0.22 –0.41 –0.41 –0.42 –0.48 0.98 0.99 0.98 0.95 0.98 0.98 0.97 1283 871 848 1258 1033 1113 926 0.79 0.81 0.79 0.89 0.95 0.91 0.93 –0.57 –0.44 –0.34 –0.75 –0.74 –0.79 –0.78 0.96 0.99 0.97 0.95 0.98 0.98 0.93 BAS_2.15_2352 BAS_5,55_2254 BAS_3,90_2417 BAS_3,20_2364 BAS_3,14_2198 BAS_1,99_2294 BAS_3,32_2261 216 134 149 143 135 146 148 0.37 0.58 0.53 0.46 0.56 0.46 0.51 0.93 0.97 0.94 0.90 0.95 0.93 0.95 122,310 83,682 93,717 90,802 85,768 94,089 97,762 1.00 1.09 1.00 0.92 1.03 0.97 0.97 –0.46 –0.38 –0.32 –0.38 –0.34 –0.37 –0.35 0.97 0.98 0.96 0.98 0.98 0.96 0.96 2079 1102 1224 1294 1183 1339 1347 0.78 1.04 0.93 0.86 0.92 0.89 0.80 –0.75 –0.64 –0.52 –0.71 –0.54 –0.64 –0.42 0.94 0.97 0.95 0.98 0.96 0.95 0.94 BAN_5.80_1956 BAN_7,80_2070 BAN_7,53_1963 BAN_8,86_1973 309 229 143 100 0.25 0.49 0.49 0.68 0.38 0.72 0.81 0.95 109,852 133,017 70,485 63,570 1.29 1.05 1.20 1.13 –0.81 –0.53 –0.55 –0.36 0.97 0.98 0.98 0.99 2390 2097 1131 842 1.13 0.98 1.10 1.08 –1.45 –0.96 –0.95 –0.62 0.91 0.96 0.96 0.99 100 200 300 400 500 600 700 800 900 100 200 300 400 500 600 700 800 900 BAN_5,80_1956 Seed Uzan NCHRP Predicted Resilient Moduli, Mrp (MPa) Mesured Resilient Moduli, Mrm (MPa) Figure 7. Measured vs. predicted Resilient Moduli from Seed, Uzan and NCHRP models (BAN_5.80_1956 sample). 50 100 150 200 250 300 350 400 50100 150 200 250 300350 400 GNB 0/31.5_2.08_1921 Dunlap Seed Uzan NCHRP Predicted Rfesilient Moduli, Mrp (MPa) Measured Resilient Moduli, Mrm (MPa) Figure 8. Measured vs. predicted Resilient Moduli from Seed, Uzan and NCHRP models (GNB 0/31.5_2.08_1921 sample). 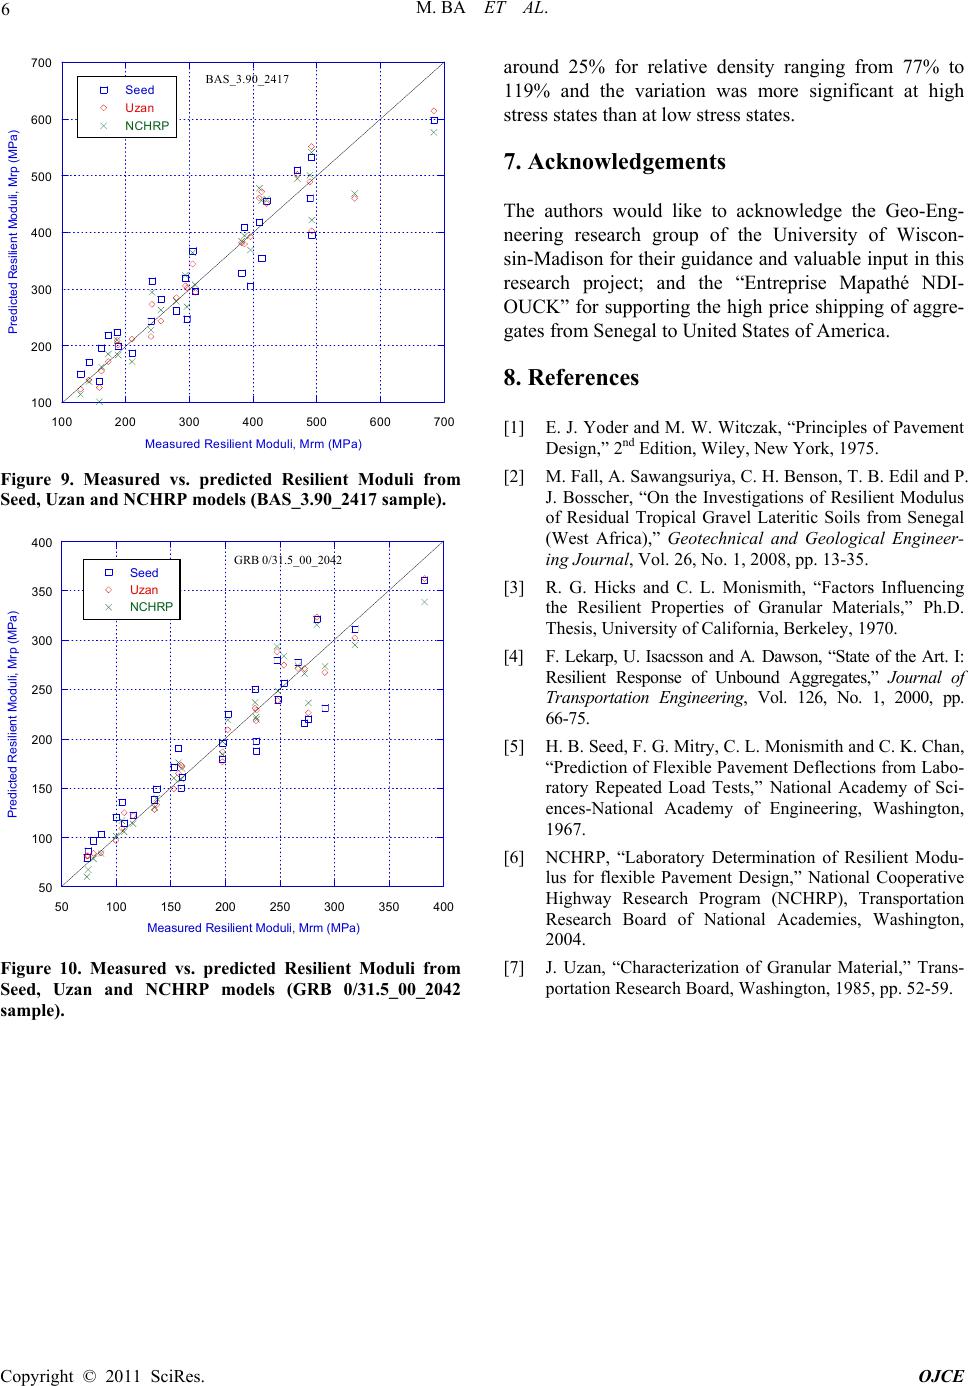 M. BA ET AL. Copyright © 2011 SciRes. OJCE 6 100 200 300 400 500 600 700 100200 300 400 500 600 700 BAS_3.90_2417 Seed Uzan NCHRP Predicted Resilient Moduli, Mrp (MPa) Measured Resilient Moduli, Mrm (MPa) Figure 9. Measured vs. predicted Resilient Moduli from Seed, Uzan and NCHRP models (BAS_3.90_2417 sample). 50 100 150 200 250 300 350 400 50100 150 200 250 300 350 400 GRB 0/31.5_00_2042 Seed Uzan NCHRP Predict ed Resi l ie nt Modul i, Mrp (M Pa) Measured Resilient Moduli, Mrm (MPa) Figure 10. Measured vs. predicted Resilient Moduli from Seed, Uzan and NCHRP models (GRB 0/31.5_00_2042 sample). around 25% for relative density ranging from 77% to 119% and the variation was more significant at high stress states than at low stress states. 7. Acknowledgements The authors would like to acknowledge the Geo-Eng- neering research group of the University of Wiscon- sin-Madison for their guid ance and valuable input in this research project; and the “Entreprise Mapathé NDI- OUCK” for supporting the high price shipping of aggre- gates from Senegal to United States of America. 8. References [1] E. J. Yoder and M. W. Witczak, “Principles of Pavement Design,” 2nd Edition, Wiley, New York, 1975. [2] M. Fall, A. Sawangsuriya, C. H. Benson, T. B. Edil and P. J. Bosscher, “On the Investigations of Resilient Modulus of Residual Tropical Gravel Lateritic Soils from Senegal (West Africa),” Geotechnical and Geological Engineer- ing Journal, Vol. 26, No. 1, 2008, pp. 13-35. [3] R. G. Hicks and C. L. Monismith, “Factors Influencing the Resilient Properties of Granular Materials,” Ph.D. Thesis, University of California, Berkeley, 1970. [4] F. Lekarp, U. Isacsson and A. Dawson, “State of the Art. I: Resilient Response of Unbound Aggregates,” Journal of Transportation Engineering, Vol. 126, No. 1, 2000, pp. 66-75. [5] H. B. Seed, F. G. Mitry, C. L. Monismith and C. K. Chan, “Prediction of Flexible Pavement Deflections from Labo- ratory Repeated Load Tests,” National Academy of Sci- ences-National Academy of Engineering, Washington, 1967. [6] NCHRP, “Laboratory Determination of Resilient Modu- lus for flexible Pavement Design,” National Cooperative Highway Research Program (NCHRP), Transportation Research Board of National Academies, Washington, 2004. [7] J. Uzan, “Characterization of Granular Material,” Trans- portation Research Board, Washington, 1985, pp. 52-59. |