 Journal of Service Science and Management, 2011, 4, 391-399 doi:10.4236/jssm.2011.43045 Published Online September 2011 (http://www.SciRP.org/journal/jssm) Copyright © 2011 SciRes. JSSM 391 Sea-Port Operational Efficiency: An Evaluation of Five Asian Ports Using Stochastic Frontier Production Function Model Otieno Robert Kennedy1, Khin Lin1, Hu a lo n g Yang1*, Banomyong Ruth2 1Transportation Management College, Dalian Maritime University, Dalian, China; 2Department of International Business, Logistics & Transport, Thammasat University, Bangkok, Thailand. Email: *yanghualong@dlmu.edu.cn, yang_hualong02@126.com, {robertko78, khinlinmmu68}@gmail.com, ruth@banomyong.com Received April 25th, 2011; revised June 3rd, 2011; accepted June 23rd, 2011. ABSTRACT Sea-port operational efficiency is critical factor for handling of goods in the international supply chains, and is viewed to impact transportation and logistics which play an important role in trade exchange with other countries. It is impor- tant to evaluate operational efficiency of sea-ports to reflect their status and reveal their position in this competitive environment. Moreover, knowing impacts of efficiency of sea-ports on the supply chain is vital for business survival. This study uses stochastic frontier and inefficiency models to analyze sea-port operational efficiency and Delphi tech- nique to seek expert respondents’ opinion on its characteristics. The research also uses structural equation modeling to build a model of sea-port operational efficiency as a further step to examine the significance of the characteristics. The results of this study emphasize the need to improve sea-port operational efficiency, and indicate which characteristics should be given more attention. Keywords: Sea-port Operational Efficiency, Supply Chain, Stochastic Frontier Model, Delphi Technique, Asian Ports 1. Introduction Sea-ports have been considered to be important parts of international supply chains [1]. They hold a very impor- tant role and are the most critical nodes in the supply chain [2]. It is widely believed that sea-ports form a vital link in the overall trading chain [3]. Sea-ports are a com- ponent of freight distribution as they offer a maritime to land interface for cross-border businesses. Therefore, effi- ciency of sea-port operation is vital for supply chains. A lot of research has been done in the area of sea-port operational efficiency. Many of such research dwell on tactical means of bolstering sea-port operational effi- ciency [3-6]. Some researchers regard sea-port as Third Party Logistics (3PL) provider that intervenes in a series of different companies and supply chains [7]. Three dif- ferent channels: trade channel, logistics channel and sup- ply chain channel were identified by [7] as a new frame- work of measuring performance of sea-ports. However, there still exists a gap in assessing the sea-port opera- tional efficiency. The question: “What characteristics are key to improving sea-port operational and to what extent they can bolster efficiency?” has not been adequately addressed in literature. Some research dwell on one or two aspects at a time leaving out other aspects. This research seeks to address this concern by exam- ining sea-port operational efficiency, establishing deter- minants of such efficiency for its evaluation and building its model. Since various aspects of efficiency do not lend themselves to precise analytical techniques but can bene- fit from subjective judgments on collective basis [8], Delphi technique was chosen as a feasible method for identifying key factors that are significant to sea-port operational efficiency. The paper will be comprised of five main sections. Following the introductory section, the paper will present reviews on related literature concerning sea-port opera- tional efficiency and logistics flexibility. The section will be devoted to defining it and outlining its theoretical pre- cepts. Next section will present the selected research methodology followed by results of the research as well as their analyses and related discussions. The paper will further present implications of research findings and dis- cussions of limitations of the current study as well as recommendations for further research. Finally, there will  Sea-Port Operational Efficiency: An Evaluation of Five Asian Ports Using 392 Stochastic Frontier Production Function Model be summary and conclusions. 2. Literature Review Sea-port operation is defined as cargo handling (or mov- ing) activity, performed by a designed company (gang or team), consisting of labor and machines. It is also defined as the operation of a wharf and other port facilities, op- eration of port passenger transport service, operation of cargo loading/unloading, haulage and warehousing ser- vices within a port area and so on [9]. Presently, there is difficulty in defining port efficiency due to non-universal definition of what indicates an effi- cient port or what port efficiency entails [10]. An effi- cient sea-port should be one that is competent in opera- tions [10]. Based on this definition, efficiency of sea-port operations is determined by duration (time) of ship’s stay in a port, quality of cargo handling and quality of service to inland transport vehicle during passage through the port [11]. Quality of cargo handling is in the form of berth throughput [10] and quality of service to inland vehicle is dependent on port infrastructure. Productivity has been identified as a measure of sea-port operational efficiency [3]. Many researchers have used various approaches to evaluate sea-port efficiency. Annual firm level surveys have been employed as indicators of sea-port operational efficiency, but “there was almost no information on how port efficiencies evolve over time from these studies” [11, p. 3]. A number of studies have used data on inputs, out- puts and production function theory, by means of data envelopment analysis (DEA), to estimate the most effi- cient production frontier across a set of sea-ports [6,12, 13]. The approaches using this method have the advan- tage of economies of scale derived from econometric evidence but the drawback is that they typically assume constant return to scale [11]. To address the issue of error estimation and statistical confidence, another approach, econometric estimation of cost functions, was developed by [11]. The method, however, has “difficulties with data requirements, particularly measurement of labor, capital and other requirements” [11, p. 5] which limit its appli- cation to many sea-ports at a time. Some research has been done on the contribution of port ownership to efficiency. Transformation from public to private ownership is believed to improve sea-port op- erational efficiency even without change in level of com- petition [14]. Some researchers contended this position [14] and have opinion that principal-agent problems may also arise in the private sector as a result of capital mar- ket imperfections [3]. Reference [15] applied stochastic production function to evaluate technical efficiency but did not show that port ownership has significant effects on sea-port operational efficiency. Moreover, [16] de- veloped stochastic frontier model and carried out com- parison of efficiency level of 40 container terminals, but also failed to establish the relationship between terminal ownership, operations and efficiency level. On the con- trary, a number of studies have shown relationship be- tween port ownership and sea-port operational efficiency [3,11,17]. Relative efficiency of a number of Asian ports was assessed by [17] using a combination of cross-sec- tional and panel data versions of stochastic frontier model and the finding was that there seems to be some support that privatization should have some relationship with improvement in efficiency [3]. These efforts by the researchers show that port ownership is a likely determi- nant of operational efficiency. It has been found that size of sea-port has positive ef- fects on its efficiency [18]. Also, it has been shown that ports with larger throughput seem to have certain per- formance advantage over those with smaller throughput [17]. In research on 15 sea-ports [19] showed that port efficiency has no clear relationship with its size and func- tion (hub or feeder) [3]. 3. Methodology and Data 3.1. Methodology Researchers identified research tools and strategies that will be employed and related their application to speci- fied research objectives. Questions to be addressed by this research set up the direction that the research will take and are tied to research objectives. The research questions were: 1) What are the operational efficiencies of a set of sea-ports? 2) What are the key characteristics of sea-port operational efficiency? 3) What is the model of sea-port operational efficiency? Based on the research questions, the objectives of this research were to: evaluate operational efficiencies of a number of selected sea-ports; examine the characteristics of sea-ports’ operational efficiency and build its struc- tural model. Stochastic frontier production function model in [19] was used to evaluate the efficiency of selected sea-ports. This method was selected because of its ability to esti- mate technical inefficiency [19] and simultaneously es- timates parameters of an inefficiency model with those of stochastic frontier production model [3]. Delphi tech- nique was employed to seek expert respondents’ opinion on the characteristics of sea-port operational efficiency. 3.1.1. S tochasti c Frontier and Inefficiency Models Stochastic frontier, also known as composed error, model for production function i , ii ygx (i = 1, 2, 3, …, N), [20] where is the output for observation i, i y Copyright © 2011 SciRes. JSSM  Sea-Port Operational Efficiency: An Evaluation of Five Asian Ports Using 393 Stochastic Frontier Production Function Model i is vector of inputs for observation i, is the vector of parameters, i is error term for observation i, postu- lates that the error term i is made up of two inde- pendent components, iii vu it where, i v is a two- sided error term representing statistical noise in any rela- tionship; i is one-sided error term representing technical inefficiency. 0u it The exponential form of the proposed model giving production function in Equation (1) as, exp it it xv u (1) where, it is the production at the tth observation (t = 1, 2, …, T) for the ith firm (i = 1, 2, …, N); it y is logarithm of input variables it is random error assumed to be truncated normal distribution with respect to mean and variance, v 2 0, v N , and independently distributed of non-negative random variable, it . The truncated normal distribution using Wald or generalized likelihood-ratio test [20] is specified in this research to justify the selec- tion of distribution form for technical inefficiency effects [3]. u it it W Regression of effects of inefficiency on the variables that explain inefficiency is given by Equation (2) as, it uz (2) where zit is a vector of explanatory variables; is a vector of unknown scalar parameters; Wit is truncation of normal distribution, 2 0, v N , such that the point of truncation is such that point of truncation is it z [3]. To avoid serial correlation among random errors, this part of the research will employ cross-sectional data and use cross-sectional analysis to address concerns about correlations of inefficiencies and input choices [15,17]. We propose maximum likelihood method for simultane- ous estimation of parameters of stochastic frontier model and those of technical inefficiencies model [3]. The like- lihood function is expressed in terms of variance pa- rameters 2 sv 22 and22 , inefficiency can therefore be defined in terms of the ratio between observed output and potential output given input xit as pit TE Wex it exp it x it yit vit z (3) 3.1.2. Delphi Technique Delphi, a systematic interactive forecasting technique which depends on a panel of independent, carefully se- lected expert respondents [21], was used to identify char- acteristics of efficient sea-port operations. Delphi was used because researchers felt that expert opinion was the best available evidence. The method has the ability to provide anonymity to respondents and controlled feed- back process as well as allows application of variety of statistical analysis techniques to interpret data [8]. A group of selected 32 expert respondents in port management, shipping and logistics field drawn mainly from China, Hong Kong, Singapore and Korea partici- pated in the study by answering questionnaires sent through email. Sample size was kept reasonably small, so as to do justice to the rich evidence given by qualitative studies [22]. Table 1 shows sample of expert respondents who participated in this part of the research. The process was carried out in three rounds as recom- mended by literature [21]. Caution was exercised to deal with concerns of Delphi such as time consumption [21], molding of opinion, subjectivity versus objectivity and the assumption that the participants have equivalent knowledge and experience [21]. Round 1 questionnaire was unstructured with ques- tions and statements phrased to increase chances of ac- curacy of responses [21]. In Round 1 the respondents were asked to identify key characteristics of sea-port operational efficiency and provide their comments as to why they thought the identified items were important. After Round 1 deadline, two weeks as recommended by literature between rounds [21], results were analyzed and a summary of the same was included in the design of Round 2 questionnaire. A review of questionnaire statements was done to remove any possible influences by monitor team’s views [9]. The questionnaire was sent to the experts to refine ideas, explore agreements and disagreements and to probe strengths and weaknesses of opinions. After deadline of Round 2, responses were analyzed and Round 3 questionnaire was prepared. In this round re- spondents were asked to revise judgments or specify why they remain out of consensus [21]. Round 2 and Round 3 question was, “To what extent do you agree that the following fac- tors contribute to sea-port operational efficiency? Please, provide your comments or additional factors that in your view are significant to sea-port efficiency.” The experts were required to rate the characteristics using Likert-scale (1 = strongly disagree, 2 = disagree, 3 = moderately agree, 4 = strongly agree, 5 = very strongly agree). 3.2. Data Since the main activity of container ports is handling containers only one output will be identified in this study. The total throughput is a good measurement for the out- put of a container terminal [3]. Table 2 shows container throughput of five container ports being investigated. Literature argues that only the input factors: quay length; terminal area; and the number of quay cranes are relevant variables affecting container terminal opera- ional efficiency [17]. Table 3 shows these input factors t Copyright © 2011 SciRes. JSSM  Sea-Port Operational Efficiency: An Evaluation of Five Asian Ports Using Stochastic Frontier Production Function Model Copyright © 2011 SciRes. JSSM 394 Table 1. Sample of Delphi respondents. No. of port/firm employees No. of employees represented % employees the ports/firms in all Respondents expected (fe) Respondents who participated (f0) 100 - 249 1,505 43 22 14 250 - 499 770 22 11 7 500 - 999 525 15 8 5 1,000+ 700 20 10 6 2 test (= =7.089, df = 3, p = 0.0691) Job title CEO/president 805 23 11 7 Vice president 525 15 8 5 Manager 1,890 54 27 17 Director 280 8 4 3 2 test (= =6.533, df = 3, p = 0.0884) Total 3,500 100 50 32 2 is obtained using the formula: 2 0e e f f Table 2. Port container throughput in TEUs. Asian Port 2005 2006 2007 2008 2009 2010 Singapore 23,192,000 24,792,400 27,932,000 29,918,200 25,866,400 28,400,000 Hong Kong 22,602,000 23,538,580 23,998,000 24,248,400 21,040,000 23,699,000 Shanghai 18,084,000 21,710,000 26,168,000 28,006,000 25,002,000 29,100,000 Shenzhen 16,197,173 18,468,900 21099,000 21,416,000 18,250,100 22,510,000 Busan 11,840,000 12,030,000 13,261,000 13,425,000 11,954,000 14,180,000 Sources: China Port Industry Report, 2010; Container Throughput Hong Kong [available online] www.pdc.gov.hk/docs/Hkport.pdf. United Nations (2010) Review of Maritime Transport, Chapter 5. Table 3. Input factors of five major Asian ports. vate sector participation is given as 0/3 for purely public ownership; 1/3 for public regulator and landownership while private sector acts as operators; 2/3 is given for public being regulator while the private sector perform the role of landowner and operator and 3/3 is given for purely private ownership. Quay Length (km) Terminal Area (hectares) No. of Quay cranes Singapore 16.945 600 190 Hongkong 19 285 93 Shanghai 20 401 240 Shenzhen 5.543 344 71 Busan 9.95 292.5 70 Cobb-Douglas and Translog functional forms for sto- chastic production function forms are tested based on maximum likelihood method by applying FRONTIER package version 4.1. The following, Equation (4), is the stochastic production function to be tested, 011 22 33 22 41 5263 71 28193 92 3 lnln lnln lnlnln lnlnlnln lnln iii iii ii i iiii YXXX XX X 2 i i XX XXvu Source: Global Container Terminal Operators Annual Review, 2010. X (4) for the five ports studied. We will also use the port ownership [3] to analyze port ownership structure. According to [3] the degree of pri- Technical inefficiencies are defined by, 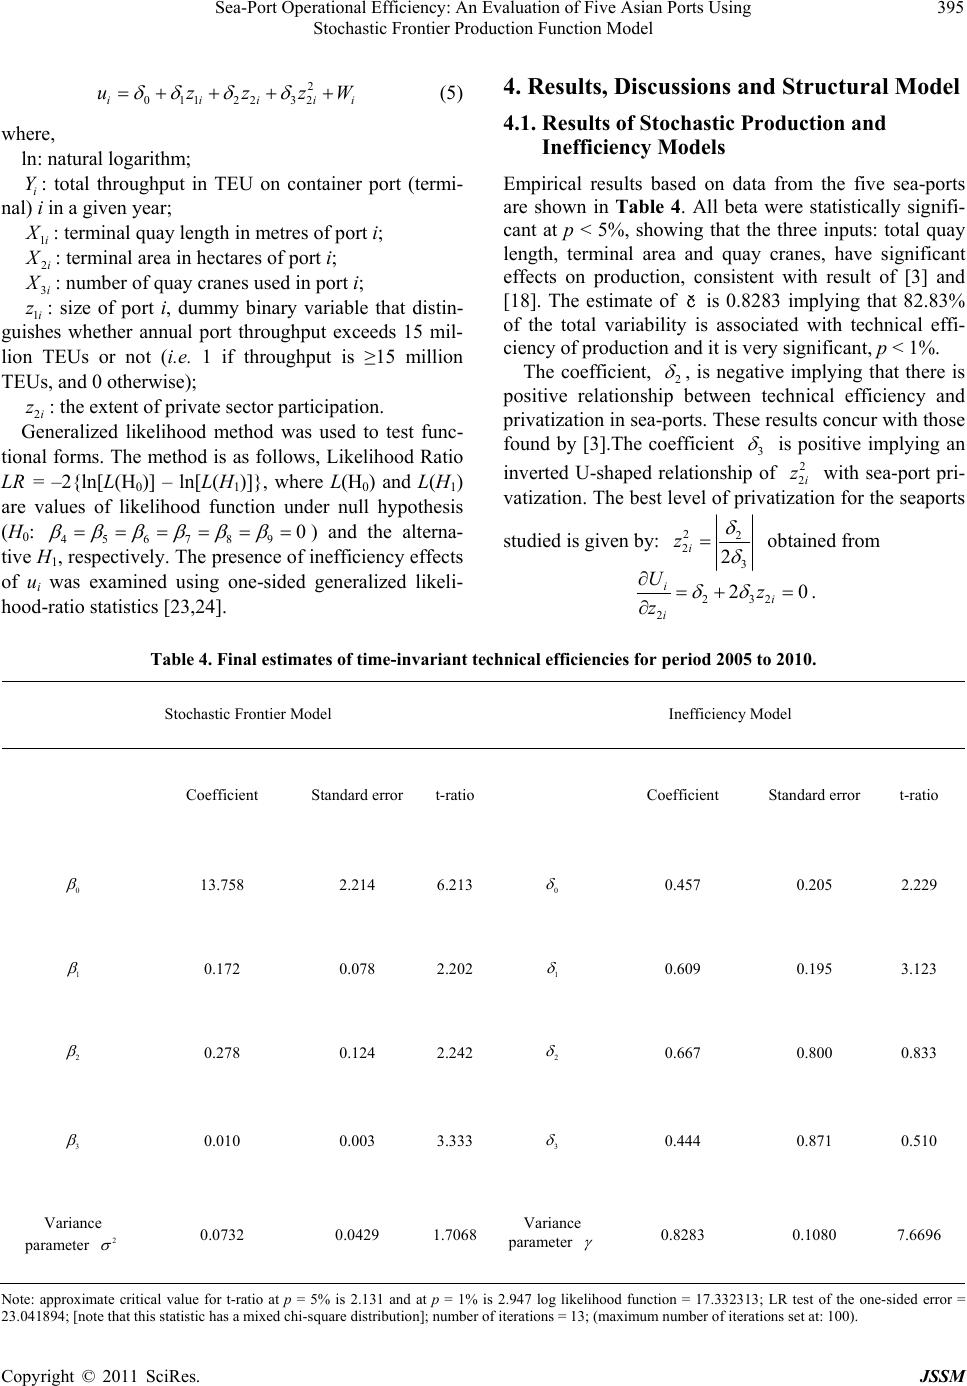 Sea-Port Operational Efficiency: An Evaluation of Five Asian Ports Using 395 Stochastic Frontier Production Function Model i W 2 011 22 32 iiii uzzz (5) where, ln: natural logarithm; i: total throughput in TEU on container port (termi- nal) i in a given year; Y 1i : terminal quay length in metres of port i; 2i : terminal area in hectares of port i; 3i : number of quay cranes used in port i; 1i: size of port i, dummy binary variable that distin- guishes whether annual port throughput exceeds 15 mil- lion TEUs or not (i.e. 1 if throughput is ≥15 million TEUs, and 0 otherwise); z 2i Generalized likelihood method was used to test func- tional forms. The method is as follows, Likelihood Ratio LR = –2{ln[L(H0)] – ln[L(H1)]}, where L(H0) and L(H1) are values of likelihood function under null hypothesis (H0: 456789 z: the extent of private sector participation. 0 ) and the alterna- tive H1, respectively. The presence of inefficiency effects of ui was examined using one-sided generalized likeli- hood-ratio statistics [23,24]. 4. Results, Discussions and Structural Model 4.1. Results of Stochastic Production and Inefficiency Models Empirical results based on data from the five sea-ports are shown in Table 4. All beta were statistically signifi- cant at p < 5%, showing that the three inputs: total quay length, terminal area and quay cranes, have significant effects on production, consistent with result of [3] and [18]. The estimate of č is 0.8283 implying that 82.83% of the total variability is associated with technical effi- ciency of production and it is very significant, p < 1%. The coefficient, 2 , is negative implying that there is positive relationship between technical efficiency and privatization in sea-ports. These results concur with those found by [3].The coefficient 3 is positive implying an inverted U-shaped relationship of with sea-port pri- 2 2i z vatization. The best level of privatization for the seaports studied is given by: 22 2 3 2 i z obtained from 232 2 20 i i i Uz z . Table 4. Final estimates of time-invariant technical efficiencies for period 2005 to 2010. Stochastic Frontier Model Inefficiency Model Coefficient Standard errort-ratio Coefficient Standard error t-ratio 0 13.758 2.214 6.213 0 0.457 0.205 2.229 1 0.172 0.078 2.202 1 0.609 0.195 3.123 2 0.278 0.124 2.242 2 0.667 0.800 0.833 3 0.010 0.003 3.333 3 0.444 0.871 0.510 Variance parameter 2 0.0732 0.0429 1.7068 Variance parameter 0.8283 0.1080 7.6696 Note: approximate critical value for t-ratio at p = 5% is 2.131 and at p = 1% is 2.947 log likelihood function = 17.332313; LR test of the one-sided error = 3.041894; [note that this statistic has a mixed chi-square distribution]; number of iterations = 13; (maximum number of iterations set at: 100). 2 Copyright © 2011 SciRes. JSSM 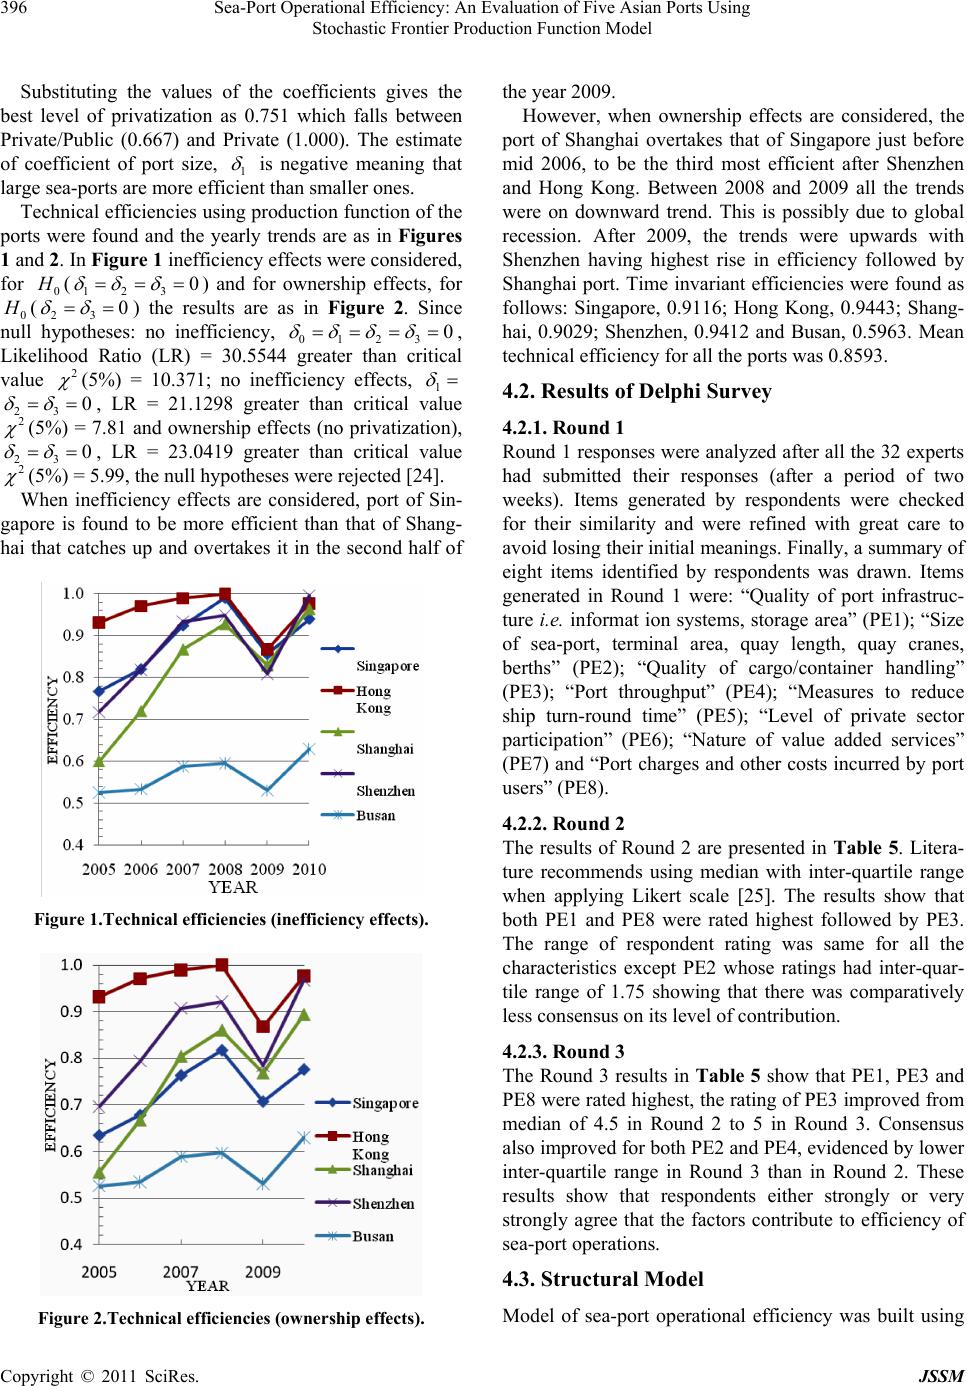 Sea-Port Operational Efficiency: An Evaluation of Five Asian Ports Using 396 Stochastic Frontier Production Function Model Substituting the values of the coefficients gives the best level of privatization as 0.751 which falls between Private/Public (0.667) and Private (1.000). The estimate of coefficient of port size, 1 is negative meaning that large sea-ports are more efficient than smaller ones. Technical efficiencies using production function of the ports were found and the yearly trends are as in Figures 1 and 2. In Figure 1 inefficiency effects were considered, for 0 (123 0 ) and for ownership effects, for 0 (23 0 ) the results are as in Figure 2. Since null hypotheses: no inefficiency, 0123 0 , Likelihood Ratio (LR) = 30.5544 greater than critical value 2 (5%) = 10.371; no inefficiency effects, 1 23 0 , LR = 21.1298 greater than critical value 2 (5%) = 7.81 and ownership effects (no privatization), 23 0 , LR = 23.0419 greater than critical value 2 (5%) = 5.99, the null hypotheses were rejected [24]. When inefficiency effects are considered, port of Sin- gapore is found to be more efficient than that of Shang- hai that catches up and overtakes it in the second half of Figure 1.Technical efficiencies (inefficiency effects). Figure 2.Technical efficiencies (ownership effects). the year 2009. However, when ownership effects are considered, the port of Shanghai overtakes that of Singapore just before mid 2006, to be the third most efficient after Shenzhen and Hong Kong. Between 2008 and 2009 all the trends were on downward trend. This is possibly due to global recession. After 2009, the trends were upwards with Shenzhen having highest rise in efficiency followed by Shanghai port. Time invariant efficiencies were found as follows: Singapore, 0.9116; Hong Kong, 0.9443; Shang- hai, 0.9029; Shenzhen, 0.9412 and Busan, 0.5963. Mean technical efficiency for all the ports was 0.8593. 4.2. Results of Delphi Survey 4.2.1. R ound 1 Round 1 responses were analyzed after all the 32 experts had submitted their responses (after a period of two weeks). Items generated by respondents were checked for their similarity and were refined with great care to avoid losing their initial meanings. Finally, a summary of eight items identified by respondents was drawn. Items generated in Round 1 were: “Quality of port infrastruc- ture i.e. informat ion systems, storage area” (PE1); “Size of sea-port, terminal area, quay length, quay cranes, berths” (PE2); “Quality of cargo/container handling” (PE3); “Port throughput” (PE4); “Measures to reduce ship turn-round time” (PE5); “Level of private sector participation” (PE6); “Nature of value added services” (PE7) and “Port charges and other costs incurred by port users” (PE8). 4.2.2. R ound 2 The results of Round 2 are presented in Table 5. Litera- ture recommends using median with inter-quartile range when applying Likert scale [25]. The results show that both PE1 and PE8 were rated highest followed by PE3. The range of respondent rating was same for all the characteristics except PE2 whose ratings had inter-quar- tile range of 1.75 showing that there was comparatively less consensus on its level of contribution. 4.2.3. R ound 3 The Round 3 results in Table 5 show that PE1, PE3 and PE8 were rated highest, the rating of PE3 improved from median of 4.5 in Round 2 to 5 in Round 3. Consensus also improved for both PE2 and PE4, evidenced by lower inter-quartile range in Round 3 than in Round 2. These results show that respondents either strongly or very strongly agree that the factors contribute to efficiency of sea-port operations. 4.3. Structural Model M odel of sea-port operational efficiency was built using Copyright © 2011 SciRes. JSSM 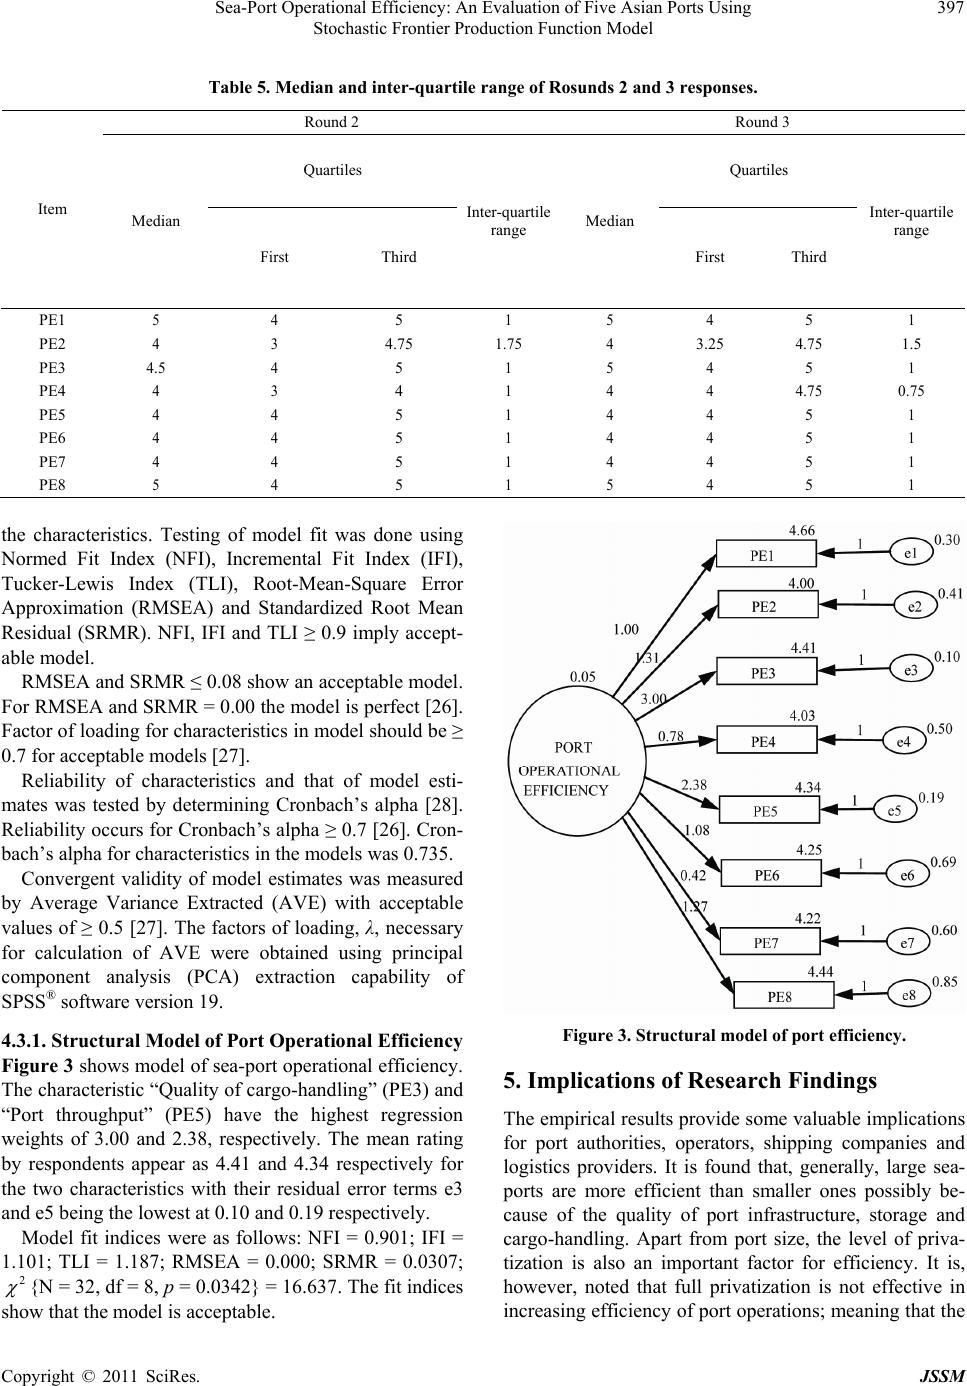 Sea-Port Operational Efficiency: An Evaluation of Five Asian Ports Using 397 Stochastic Frontier Production Function Model Table 5. Median and inter-quartile r a nge of Rosunds 2 and 3 responses. Round 2 Round 3 Quartiles Quartiles Item Median First Third Inter-quartile range Median First Third Inter-quartile range PE1 5 4 5 1 5 4 5 1 PE2 4 3 4.75 1.75 4 3.25 4.75 1.5 PE3 4.5 4 5 1 5 4 5 1 PE4 4 3 4 1 4 4 4.75 0.75 PE5 4 4 5 1 4 4 5 1 PE6 4 4 5 1 4 4 5 1 PE7 4 4 5 1 4 4 5 1 PE8 5 4 5 1 5 4 5 1 the characteristics. Testing of model fit was done using Normed Fit Index (NFI), Incremental Fit Index (IFI), Tucker-Lewis Index (TLI), Root-Mean-Square Error Approximation (RMSEA) and Standardized Root Mean Residual (SRMR). NFI, IFI and TLI ≥ 0.9 imply accept- able model. RMSEA and SRMR ≤ 0.08 show an acceptable model. For RMSEA and SRMR = 0.00 the model is perfect [26]. Factor of loading for characteristics in model should be ≥ 0.7 for acceptable models [27]. Reliability of characteristics and that of model esti- mates was tested by determining Cronbach’s alpha [28]. Reliability occurs for Cronbach’s alpha ≥ 0.7 [26]. Cron- bach’s alpha for characteristics in the models was 0.735. Convergent validity of model estimates was measured by Average Variance Extracted (AVE) with acceptable values of ≥ 0.5 [27]. The factors of loading, λ, necessary for calculation of AVE were obtained using principal component analysis (PCA) extraction capability of SPSS® software version 19. 4.3.1. Structu r al Model o f Po rt Operational Efficiency Figure 3 shows model of sea-port operational efficiency. The characteristic “Quality of cargo-handling” (PE3) and “Port throughput” (PE5) have the highest regression weights of 3.00 and 2.38, respectively. The mean rating by respondents appear as 4.41 and 4.34 respectively for the two characteristics with their residual error terms e3 and e5 being the lowest at 0.10 and 0.19 respectively. Model fit indices were as follows: NFI = 0.901; IFI = 1.101; TLI = 1.187; RMSEA = 0.000; SRMR = 0.0307; 2 {N = 32, df = 8, p = 0.0342} = 16.637. The fit indices show that the model is acceptable. Figure 3. Structural model of port efficiency. 5. Implications of Research Findings The empirical results provide some valuable implications for port authorities, operators, shipping companies and logistics providers. It is found that, generally, large sea- ports are more efficient than smaller ones possibly be- cause of the quality of port infrastructure, storage and cargo-handling. Apart from port size, the level of priva- tization is also an important factor for efficiency. It is, however, noted that full privatization is not effective in increasing efficiency of port operations; meaning that the Copyright © 2011 SciRes. JSSM 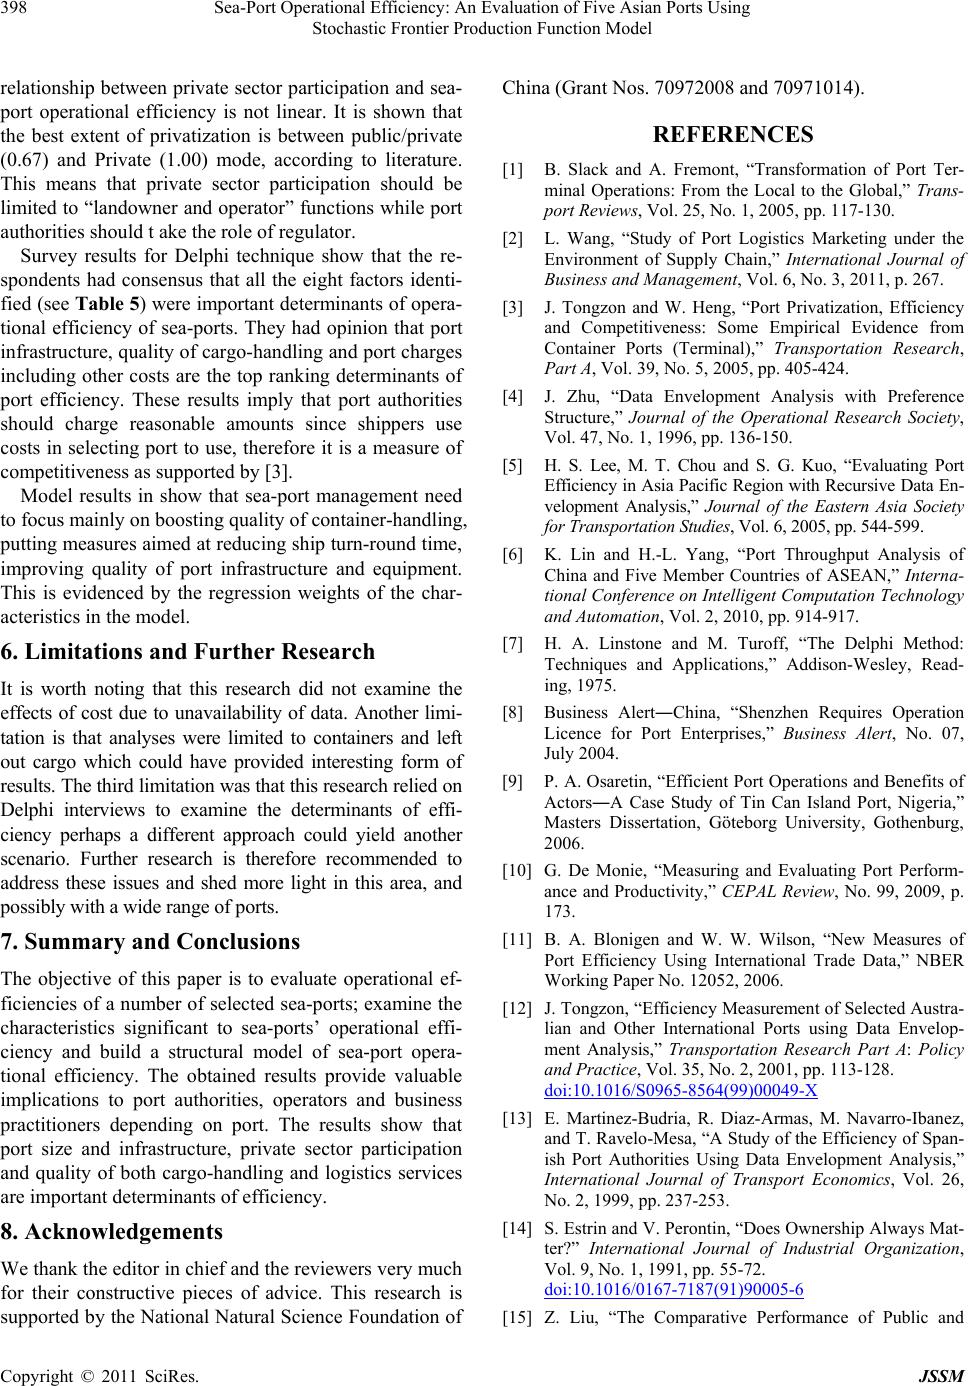 Sea-Port Operational Efficiency: An Evaluation of Five Asian Ports Using 398 Stochastic Frontier Production Function Model relationship between private sector participation and sea- port operational efficiency is not linear. It is shown that the best extent of privatization is between public/private (0.67) and Private (1.00) mode, according to literature. This means that private sector participation should be limited to “landowner and operator” functions while port authorities should t ake the role of regulator. Survey results for Delphi technique show that the re- spondents had consensus that all the eight factors identi- fied (see Table 5 ) were important determinants of opera- tional efficiency of sea-ports. They had opinion that port infrastructure, quality of cargo-handling and port charges including other costs are the top ranking determinants of port efficiency. These results imply that port authorities should charge reasonable amounts since shippers use costs in selecting port to use, therefore it is a measure of competitiveness as supported by [3]. Model results in show that sea-port management need to focus mainly on boosting quality of container-handling, putting measures aimed at reducing ship turn-round time, improving quality of port infrastructure and equipment. This is evidenced by the regression weights of the char- acteristics in the model. 6. Limitations and Further Research It is worth noting that this research did not examine the effects of cost due to unavailability of data. Another limi- tation is that analyses were limited to containers and left out cargo which could have provided interesting form of results. The third limitation was that this research relied on Delphi interviews to examine the determinants of effi- ciency perhaps a different approach could yield another scenario. Further research is therefore recommended to address these issues and shed more light in this area, and possibly with a wide range of ports. 7. Summary and Conclusions The objective of this paper is to evaluate operational ef- ficiencies of a number of selected sea-ports; examine the characteristics significant to sea-ports’ operational effi- ciency and build a structural model of sea-port opera- tional efficiency. The obtained results provide valuable implications to port authorities, operators and business practitioners depending on port. The results show that port size and infrastructure, private sector participation and quality of both cargo-handling and logistics services are important determinants of efficiency. 8. Acknowledgements We thank the editor in chief and the reviewers very much for their constructive pieces of advice. This research is supported by the National Natural Science Foundation of China (Grant Nos. 70972008 and 70971014). REFERENCES [1] B. Slack and A. Fremont, “Transformation of Port Ter- minal Operations: From the Local to the Global,” Trans- port Reviews, Vol. 25, No. 1, 2005, pp. 117-130. [2] L. Wang, “Study of Port Logistics Marketing under the Environment of Supply Chain,” International Journal of Business and Management, Vol. 6, No. 3, 2011, p. 267. [3] J. Tongzon and W. Heng, “Port Privatization, Efficiency and Competitiveness: Some Empirical Evidence from Container Ports (Terminal),” Transportation Research, Part A, Vol. 39, No. 5, 2005, pp. 405-424. [4] J. Zhu, “Data Envelopment Analysis with Preference Structure,” Journal of the Operational Research Society, Vol. 47, No. 1, 1996, pp. 136-150. [5] H. S. Lee, M. T. Chou and S. G. Kuo, “Evaluating Port Efficiency in Asia Pacific Region with Recursive Data En- velopment Analysis,” Journal of the Eastern Asia Society for Transportation Studies, Vol. 6, 2005, pp. 544-599. [6] K. Lin and H.-L. Yang, “Port Throughput Analysis of China and Five Member Countries of ASEAN,” Interna- tional Conference on Intelligent Computation Technology and Automation, Vol. 2, 2010, pp. 914-917. [7] H. A. Linstone and M. Turoff, “The Delphi Method: Techniques and Applications,” Addison-Wesley, Read- ing, 1975. [8] Business Alert―China, “Shenzhen Requires Operation Licence for Port Enterprises,” Business Alert, No. 07, July 2004. [9] P. A. Osaretin, “Efficient Port Operations and Benefits of Actors―A Case Study of Tin Can Island Port, Nigeria,” Masters Dissertation, Göteborg University, Gothenburg, 2006. [10] G. De Monie, “Measuring and Evaluating Port Perform- ance and Productivity,” CEPAL Review, No. 99, 2009, p. 173. [11] B. A. Blonigen and W. W. Wilson, “New Measures of Port Efficiency Using International Trade Data,” NBER Working Paper No. 12052, 2006. [12] J. Tongzon, “Efficiency Measurement of Selected Austra- lian and Other International Ports using Data Envelop- ment Analysis,” Transportation Research Part A: Policy and Practice, Vol. 35, No. 2, 2001, pp. 113-128. doi:10.1016/S0965-8564(99)00049-X [13] E. Martinez-Budria, R. Diaz-Armas, M. Navarro-Ibanez, and T. Ravelo-Mesa, “A Study of the Efficiency of Span- ish Port Authorities Using Data Envelopment Analysis,” International Journal of Transport Economics, Vol. 26, No. 2, 1999, pp. 237-253. [14] S. Estrin and V. Perontin, “Does Ownership Always Mat- ter?” International Journal of Industrial Organization, Vol. 9, No. 1, 1991, pp. 55-72. doi:10.1016/0167-7187(91)90005-6 [15] Z. Liu, “The Comparative Performance of Public and Copyright © 2011 SciRes. JSSM  Sea-Port Operational Efficiency: An Evaluation of Five Asian Ports Using Stochastic Frontier Production Function Model Copyright © 2011 SciRes. JSSM 399 Private Enterprises,” Journal of Transportation Econom- ics and Policy, Vol. 29, No. 3, 1995, pp. 263-274. [16] J. Van Den Broeck, G. Koop, J. Osiewalski and J. Steel, “Stochastic Frontier Models: A Bayesian Perspective,” Journal of Econometrics, Vol. 61, No. 2, 1994, pp. 273- 303. doi:10.1016/0304-4076(94)90087-6 [17] K. Cullinane, D. W. Song and R. Gray, “A Stochastic Frontier Model of the Efficiency of Major Container Terminals in Asia: Assessing the Influence of Adminis- trative and Ownership Structures,” Transportation Re- search, Part A, Vol. 36, No. 8, 2002, pp. 743-62. [18] T. Notteboom, C. Coeck, and J. Van Den Broeck, “Meas- uring and Explaining the Relative Efficiency of Container Terminals by Means of Bayesian Stochastic Frontier Models,” International Journal of Maritime Economics, Vol. 2, No. 2, 2000, pp. 83-106. [19] G. E. Battese and T. J. Coelli, “A Model for Technique Inefficiency Effects in a Stochastic Frontier Production Function for Panel Data,” Empirical Economics, Vol. 20, No. 2, 1995, pp. 325-332. doi:10.1007/BF01205442 [20] T. J. Coelli, D. S. P. Rao, C. J. O’Donnell and G. Battese, “An Introduction to Efficiency and Productivity Analy- sis,” 2nd Edition, Springer, Berlin, 2005. [21] C.-C. Hsu and B. A. Sandford, “The Delphi Technique: Making Sense of Consensus,” Practical Assessment Re- search & Evaluation, Vol. 12, No. 10, 2007, pp. 1-8. http://pareonline.net/ getvn.asp?v=12&n=10 [22] J. Ritchie and J. Lewis, “Qualitative Research Practice,” A Guide for Social Science Students. [23] T. J. Coelli, “Estimators and Hypothesis Tests for a Sto- chastic Frontier Function: A Monte Carlo Analysis,” Journal of Productivity Analysis, Vol. 6, No. 3, 1995, pp. 247-268. doi:10.1007/BF01076978 [24] D. A. Kodde and F. C. Palm, “Wald Criteria for Jointly Testing Equality and Inequality Restrictions,” Economet- rica, Vol. 54, No. 5, 1986, pp. 1243-1248. [25] N. Mogey, “So You Want to Use Likert Scale?” 1999. http://www.icbl.hw.ac.uk/ltdi/cookbook/info_likert_scale/ index.html [26] S. A. Mulaik, L. R. James, J. Van Alstine, N. Bennett, S. Lind and C. D. Stilwell, “Evaluation of Goodness-of-Fit Indices for Structural Equation Models,” Psychological Bulletin, Vol. 105, No. 3, 1989 pp. 430-445. doi:10.1037/0033-2909.105.3.430 [27] R. Zinbarg, W. Revelle, I. Yovel and W. Li, “Cronbach’s, Revelle’s and McDonald’s: Their Relations with Each other and Two Alternative Conceptualizations of Reliabil- ity,” Psychometrika, Vol. 70, No. 1, 2005, pp. 123-133.
|