Open Journal of Medicinal Chemistry, 2011, 1, 1-16
doi:10.4236/ojmc.2011.11001 Published Online September 2011 (http://www.SciRP.org/journal/ojmc)
Copyright © 2011 SciRes. OJMC
Multidimensional QSAR Modeling of Amprenavir
Derivatives as HIV-Protease Inhibitors
Sonal Dubey*, Gopi Gowtham
KLE Universitys College of Pharmacy, Karnataka, India
E-mail: *drsonaldubey@gmail.com
Received August 21, 2011; revised September 20, 2011; accepted September 21, 2011
Abstract
A computational study has been performed on a series of 55 compounds having (S)-N-(3-(N-(cyclopen-tyl-
methyl) substituted-phenylsulfonamido)-2-hydroxypropyl) acetamide backbone as HIV-1 protease inhibitors.
Various combinations of these specific inhibitors fragments were formed by breaking them at central ali-
cyclic single bonds, while retaining the core. Standard Topomer 3D models were automatically constructed
for each fragment, and a set of steric and electrostatic fields was generated for each set of topomers. The
models generated showed r2 of 0.811 and crossvalidated r2 (q2) of 0.608. The other method used were Quasar
and Raptor based on receptor-modelling concept (6D-QSAR) and this explicitly allows for the simulation of
the induced fit, that yielded r2 of 0.574, cross-validated r2 (q2) of 0.504 and predictive r2 (p2) of 0.895 aver-
aged over 200 models. This study has suggested the various type of substituent that can be attached to the
core. The information obtained from these 3-D contour maps can be used for the design of amprenavir ana-
logs possessing better protease inhibitory activity.
Keywords: 3D-QSAR, 5D-QSAR, 6D-QSAR, Topmer CoMFA, Quasar, Raptor, HIV-1 Protease Inhibitors
1. Introduction
Replication of the HIV virus requires processing of the
proteins encoded by the gag and gag-pol genes by a
virally encoded aspartyl protease (HIV-1 protease) [1-3].
As such, inhibition of HIV-1 protease offers an attractive
target for the treatment of acquired immunodeciency
syndrome (AIDS) [4-9]. Inhibition of HIV protease is a
target for drug design in a number of laboratories which
has become a strategically important and therapeutically
viable approach toward the control of HIV infection
[10,11]. Progress in the treatment of AIDS leading to an
active therapy has been slow, but recent results with new
AIDS drugs, notably the HIV-1 protease inhibitors (PI),
allow for cautious optimism. In 2009, ten protease in-
hibitors have reached the market where one protease
inhibitor, amprenavir, was withdrawn from the market in
2004 since fosamprenavir, its prodrug proved superior in
many aspects [12].
With increased frequency and duration of treatment,
however, the rate of resistance toward antiretroviral ag-
ents, including PI s, has risen alarmingly, fueling the
search for next-generation drugs with broad ecacy
again-st PI-resistant mutants [13].
A rational approach in this direction would be to opti-
mize lead structure by using sufficiently rapid automatic
and general QSAR analysis and application. In our pre-
sent study, we have pooled in fifty five compounds from
the literature on amprenavir derivatives; to generate a
database for QSAR studies. This study was taken into
consideration mainly to improvise on the already proven
potent amprenavir molecule. The main objective of this
work is to develop a useful QSAR model for PIs and also
to compare two softwares—Topomer CoMFA and Bi-
ografx suite.
Topomer CoMFA—In 2002 Richard D. Cramer intro-
duced the technology called as Topomer CoMFA method
used for generating an alignment of a structural fragment.
A structural fragment by definition contains a common
feature, the open valence or attachment bond. The topo-
mer methodology overlaps this common feature to pro-
vide an absolute orientation for any fragment. A single
fragment confirmation is then generated from a standar-
dize 3D module by rule based adjustments to a cyclic
single bond torsions and similarities. Previous applica-
tions of topomers then proceed to characterize and com-
pare aligned 3D formats by steric fields and by location
of pharmacophoric features. Here only 3D topomer
S. DUBEY ET AL.
2
structures themselves would be used [14].
Quasar—A quasi-atomistic receptor model refers to a
three-dimensional binding-site surrogate, represented by
a 3D surface surrounding a series of ligands (superim-
posed in their bioactive conformation) at van der Waals
distance and populated with atomistic properties (H-bond
donors, H-bond acceptors, H-bond flip-flop particles, salt
bridges, neutral and charged hydrophobic particles, vir-
tual solvent, void space) mapped onto it. Quasar is a 6D-
QSAR tool: the fourth dimension refers to the possibility
to represent each molecule by an ensemble of conforma-
tions, orientations, protonation states and tautomers—
thereby reducing the bias associated with the choice of
the bioactive conformation; the fifth dimension refers to
the possibility to consider an ensemble of different in-
duced-fit models; the sixth dimension allows for the si-
multaneous evaluation of different solvation models. In
addition, Quasar allows for the simulation of local in-
duced fit, H-bond flip-flop, and various solvation effects.
Ligand-receptor interactions are estimated based on a
directional force field. A family of quasi-atomistic rece-
ptor models is then generated using a genetic algorithm
combined with weighted cross-validation.
Raptor (Receptor as poly tier object representation)
—is a receptor-modeling approach based on multi- di-
mensional quantitative structure-activity relationships
(QSA-Rs). It aims to derive an intuitively interpretable
model of a protein binding site and to accurately predict
relative free energies of ligand binding.
2. Methodology
Study was performed on fifty five compounds having
(S)-N-(3-(N-(cyclopentylmethyl) substituted phenylsul-
fonamido)-2-hydroxypropyl)acetamide backbone depic-
ted in Tables 1-5 [15-19].
These were divided into training: test of 49:6. The test
compounds were selected manually such that the struc-
tural diversity and wide range of activity in the data set
were included. QSAR analysis was carried out using
Topo-mer CoMFA (Tripos Inc.) and; Quasar and Raptor
(Biographic Laboratory 3R). The hardware used was A-
pple/Macintosh: G4 computer systems, 2GB RAM,
360GB Hard Disk, Unix operating system. For all the in-
put structures in Biografx Suite energy minimization was
performed using MM2 force field and saved as *.mol2
files. Partial atomic charges were calculated using the
MOPAC.
Topomer CoMFA: all the compounds in each publica-
tion were inspected visually and selected for a common
core. Entry of structures was made by typing SLN repre-
sentations of each topomeric fragment (as a 2D structure)
into an ASCII file. After entering the structures R1 and
R2 fragments were defined for the structure cutting them
by alicyclic bond along the common core. The Ki values
were converted to the corresponding pKi (-logKi) and
used as dependent variables in the analysis. The pKi val-
ues span a range of 3-log units providing a broad and ho-
mogenous data set for 3D-QSAR study. The valence-
filled structures were modeled by Concord.
There are two main phases in topomer CoMFA, first
being the generation of the Topomer 3D model for each
of the side chain (i.e. R1 and R2), and the second
CoMFA analysis itself. Procedures for generating the
topomer conformation have been detailed elsewhere
[20,21], in brief:
Generating the topomer conformation involves-
o Attachment of structurally distinctive “cap to com-
plete structure.
o This model is oriented to superimpose the “cap” at-
tachment bond onto a vector fixed in Cartesian space.
o Proceeding away from this “root” attachment bond,
only as required to place the most important (typically
the largest) unprocessed group farthest from the root and
the next most important counterclockwise relative to the
largest looking along a vector pointing back to the root,
stereocenters are inverted and torsion angle adjusted.
o Removal of the cap completes the topomer confor-
mation.
Carrying out the automatic CoMFA analyses-
o Atomic charges were calculated by the MMFF94.
The non-bonded interaction calculation was set at cut off
of 8, and dielectric constant 1.
o The lattice is a 2 Å grid with its lowest valued cor-
ner at (–4, –12, –8) and its highest valued corner at (+14,
+6, +10). This “standard topomer” grid is indented as the
1000 points cube that is best positioned to contain a
topomer, with its root vector endpoint coordinates of (0,
0, 0), [1.5,0,0].
PLS method was used to linearly correlate the CoMFA
fields to biological activity values. The cross-validation
was performed using leave-one-out (LOO) method in
which one compound is removed from the dataset and its
activity is predicted using the model derived from the
rest of the molecules in the dataset. Equal weights for
CoMFA were assigned to steric and electrostatic fields.
The entire crossvalidated results were analyzed consid-
ering the fact that a value of q2 above 0.2 indicates that
probability of chance correlation is less than 5%.
Quasar—is based on 6D-QSAR and explicitly allows
for the simulation of induced fit. Quasar generates a fam-
ily of quasi-atomistic receptor surrogates that are opti-
mized [22,23]. By means of a genetic algorithm the hy-
pothetical receptor site is characterized by a three- di-
mensional surface which surrounds the ligand molecules
at van der Waals distance and which is populated with
Copyright © 2011 SciRes. OJMC
S. DUBEY ET AL.
Copyright © 2011 SciRes. OJMC
3
Table 1. Structure and inhibitory potencies of Amprenavir derivatives.
Code R Ki (nM) Code R Ki (nM) Code R Ki (nM)
A1A
20 B1A
15 C1A
2 × 10²
A2A
29 B2A
50 C2A
38
A3A
27 B3A
300 C3A 34 × 102
A4A
220 B4A
1400 C4A
> 10 × 103
A5A
680 B5A
104 C5A
21 × 102
A6A
66 B7A
125 C6A
> 20 × 103
A7A
76 B8A
20 C7A
> 10 × 103
A9A
40 B9A
173 D0A
43
B0A
65 C0A
17
S. DUBEY ET AL.
4
Table 2. Structure and inhibitory potencies of conformationally restricted HIV protease inhibitors as Amprenavir derivatives.
Code STRUCTURE Ki(nM)
D1A N
O N
O
N
OH
S
OCH3
O O
17
D3A
0.5
D4A
3 x10³
D7A
15
Copyright © 2011 SciRes. OJMC
5
S. DUBEY ET AL.
Table 3. Structure and inhibitory potencies of non-peptidal P2– ligand incorporating (R)–hydroxy ethylaninosulfonamide
isoester as protease inhibitor.
Code R X Ki(nM)Code R X Ki(nM)
H5A
OMe 2.5 I1A
NH2 2.1
H6A
NH2 1.5 I2A
OMe 1.1 ± 0.4
(n = 4)
H9A
OMe 1.5 I3A
CH3 1.2
I0A
NH2 1.6 I4A
OMe 2.2
Table 4. Structure and inhibitory potencies Spirocyclic ethers as nonpeptidal P2– ligand incorporating (R)-hydroxyethyl-
aminosulfonamide isoester as protease inhibitor.
CodeRXKi(nM)CodeRXKi(nM)
I5 A
OMe20 ± 3
(n = 3)I9A
OMe>1 × 10³
I6 A
OMe150J0A
OMe480
I8 A
OMe4 × 102J1A
OMe150
Copyright © 2011 SciRes. OJMC
S. DUBEY ET AL.
6
Table 5. Structure and inhibitory potencies of Non peptidic HIV protease inhibitors containing methyl-2-pyrolidinone and
methyloxazolidinone as P1'-ligand in Darunavir derivative.
Cod
e STRUCTURE Ki(nM)
J3A
0.85 ± 0.02
J4A
0.31 ± 0.03
J5A
0.28 ± 0.03
J6A
1.27 ± 0.15
J7A
0.12 ± 0.003
J8A
0.099 ± 0.003
Copyright © 2011 SciRes. OJMC
7
S. DUBEY ET AL.
J9A
0.85 ± 0.2
K0A
0.31 ± 0.03
K1A
0.28 ± 0.03
K2A
0.31 ± 0.03
K3A
0.035 ± 0.01
K4A
0.24 ± 0.03
Copyright © 2011 SciRes. OJMC
S. DUBEY ET AL.
Copyright © 2011 SciRes. OJMC
8
atomistic properties mapped onto it. The topology of this
surface mimics the three-dimensional shape of the bind-
ing site; the mapped properties represent other informa-
tion of interest, such as hydrophobicity, electrostatic po-
tential and hydrogen-bonding propensity. The fourth di-
mension refers to the possibility of representing each
ligand molecule as an ensemble of conformations, orien-
tations and protonation states, thereby reducing the bias
in identifying the bioactive conformation and orientation
(4D-QSAR). Within this ensemble, the contribution of an
individual entity to the total energy is determined by a
normalized Boltzmann weight. As manifestation and
magnitude of induced fit may vary for different molecu-
les binding to a target protein, the fifth dimension in Qu-
asar allows for the simultaneous evaluation of up to six
different induced-fit protocols (5D-QSAR). The six di-
mensions (6D-QSAR) allow the simultaneous considera-
tion of different solvation models. This can either be
achieved explicitly where parts of the surface area are
mapped with solvent properties whereby position and
size are optimized by the genetic algorithm, or implicitly.
Here, the solvation terms (ligand desolvation and solvent
stripping) are independently scaled for each different
model within the surrogate family, reflecting varying
solvent accessibility of the binding pocket. Like for the
fourth and fifth dimension, a modest ‘evolutionary pres-
sure’ is applied to achieve convergence. The detailed
methodology is given elsewhere [24,25], here it is de-
scribed in brief:
Receptor surface generated by induced fit may be
simulated by adapting van der Waals surface, generated
around all ligands (energy minimized) in training set, to
the toplology of each ligand molecule of training, test
and prediction set. The associated energy was calculated
from the corresponding rms values.
The initial family of parent structure was generated
by randomly populating the domains on the receptor
surface with atomistic properties.
The models then generated were evolved simulating
cross-over events. At each cross-over step, therer is a
small probability of (0.01 - 0.02) of a transcription error,
which is expressed in random mutation. Thereafter, those
two individuals of the population with the highest
lack-of-fit value are discarded. This process is repeated
till a target r2 (0.75 - 0.95) is reached.
The binding energy is calculated as follows:
blindingligand-receptorligand desolvation
ligand straininduced fit
=
EE E
TS EE

-
-- - (1)
where
ligand-receptorelectrostaticvan der Waals
hydrogen bondingpolarization
=
EEE
EE
+
++
The contributions of the individual entities within a
4D ensemble (conformer, orientiomer, protomer, and/or
tautomer) are normalized to unity using a Boltzmann
criterion:

binding, totalbinding, individual
binding, individualbinding, individual,maximal
exp
i
EE
wE E

(2)
The free energy (ΔG) of ligand binding is calculated
as:
pred binding
GE
b
(3)
The model family is validated by their ability to
predict relative free energies of ligand binding for an
external set of test ligand molecules, not used during
model construction.
The model family is subjected to scramble test [26].
The experimental binding data of the training set is ran-
domly scrambled, and simulation is repeated. If under
this condition, the ligands of the test set are still pre-
dicted correctly (r2 > 0.5), the model is worthless, as it
does not have sensitivity towards the biological data.
Raptor, an alternative technology [27] that explicitly
and anisotropically allows for induced fit by a dual-shell
representation of the receptor surrogate, mapped with
physicochemical properties (hydrophobic character and
hydrogen-bonding propensity) onto it. In Raptor, induced
fit is not limited to steric aspects but includes the simul-
taneous variation of the amino-acid domains which leads
to different physico-chemical fields along with it. The
inner layer maps the fields that a substance would feel to
fit snugly into the binding pocket, using the most potent
compound; and the outer layer models the field gener-
ated by the altered binding site, the other compounds
may have portions of matter located in the intrice be-
tween the two shells. The underlying scoring function for
evaluating ligand-receptor interactions includes direc-
tional terms for hydrogen bonding, hydrophobicity and
thereby treats solvation effects implicitly. This makes the
approach independent from a partial-charge model and,
as a consequence, allows to smoothly model ligand
molecules binding to the receptor with different net
charges. In Raptor, the binding energy is determined as
follows:
const
HO HOHBHB
IFIFT ST S
GG fGfG
fG fG

 
  (4)
ΔGconst is a contribution to the binding energy ration-
alizable as an overall loss of translational and rotational
entropy of the ligand or overall gain of entropy due to
desolvation of the binding pocket. fHO, fHB, fIF and fTΔS are
scaling factors which are inherent to a given receptor
model; they are optimized during the simulation (see
below) for each specific drug target and typically con-
strained to specific intervals (e.g. f HO. = 0.75 1.25).
9
S. DUBEY ET AL.
Raptor uses multi-step optimization protocol including
domain assignment and combining tabu search with local
protocol. A detailed technical aspect of it is given by Lill
et al. [28].
3. Results and Discussion
In search of a good computational model for HIV-1 PIs
we had used three computational technologies on fifty
five compounds. For our work we had divided the struc-
tures into 49 training compounds and 6 test compounds.
In Topomer CoMFA studies, a series of 49 input stru-
ctures were taken and fragmented along the central
acyclic single bonds into 2 fragments while removing the
core fragment structurally common to the entire series.
Statistical analysis by PLS was done using CoMFA de-
scriptors as independent variables and biological activity
in the form of pKi values as dependent variable. Stan-
dard topomer 3D maps were automatically constructed
for each fragment and a set of steric and electrostatic
fields also known as contour plots and CoMFA columns
were generated for each set of topomer. Figures 1 and 2
show these plots for the best R1 and R2 fragment con-
tributions respectively. The Leave-One-Out (LOO) me-
thod of cross-validation was used for initial assessment
of the predictive abilities of the models with the training
sets. The optimal number of components used in the final
QSAR models was that which gave the smallest standard
error of prediction. Table 6 shows the cross-validated r2
values using Topomer CoMFA analyses of protease re-
ceptor where the results depends on the template gener-
ated which gave an r2 of 0.811 and cross-validated r2 (q2)
of 0.608 with an intercept of 3.15. The graph of predicted
verses experimental activity is shown in Figure 3, the
linearity of plots shows good correlations for CoMFA
models developed in the study for binding affinities of
protease receptor. Reliability of the models was tested by
prediction of 6 compounds selected as an external test set
using factor analysis. The predicted and the actual activi-
ties are given in Table 7.
Figure 1. Contour plot of R1 fragment from Topomer CoMFA study.
Figure 2. Contour plot of R2 fragment from Topomer CoMFA study.
Copyright © 2011 SciRes. OJMC
S. DUBEY ET AL.
10
Table 6. Results of binding affinities at protease receptor.
Parameters Results
r2 0.811
r2 standard error 0.62
q2 0.608
q2 standard error 0.90
Intercept 3.15
Figure 3. Plot of predicted verses calculated activivity from
CoMFA.
Table 7. Predicted activity of the test set compounds using
CoMFA model.
Activity Compound
Code
Experimental
Va lu e
Calculated
Va lu e
A4A 2.3424 2.066
C1A 2.3044 2.077
C4A 4.000 2.150
I6A 2.1769 2.1769
J4A –0.5086 0.610
Log Ki value
K4A –0.6197 0.740
For Quasar study, the three-dimensional structures of
all ligand molecules (55 compounds in a series) were
generated using Macro Model 6.5 and optimized. An ex-
tensive search was performed for representation of bio-
active conformation(s), orientation(s) and protonation
state(s). The molecules and their various conformers
were aligned using Symposar (Figure 4) which serves as
input for Quasar. In Quasar, the internal strain of a ligand
is a component of the energy, which hampers the chance
of “high-energy” conformer to contribute to the Boltz-
mann-weighted ensemble. For each conformer, MNDO /
ESP charges were then calculated using MOPAC 2009. The
training set was manually selected from the whole data set
to obtain a maximal diversity based on the 2D substitution
pattern. First, all ligands were ranked according to their
experimental binding affinity. Then, the compounds were
randomly divided into test and training set (49:6).
The simulation reached an r2 of 0.574, cross-validated
r2 (q2) of 0.504 and predictive r2 (p2) of 0.895 averaged
over 200 models. The ratio of q2 /r2 was 0.877 and p2/q2
was 1.77 for test set. The receptor surrogate is depicted
in (Figure 5). The rms deviation of 49 ligand of training
set of 1.517 kcal/mol corresponds to factor 12.5 off in
the experimental Ki value. For six test compounds the
predictive r2 of 0.895 was obtained on an average the
predictive binding affinity of the test deviates by 0.7
kcal/mol (2.3 factor off) from the experiment. The ma-
ximum observed deviation was 1.385 kcal/mol (9.8 fac-
tor off from the experiment). The scramble test (mean r2
= 0.002 and q2 = –0.348) demonstrated the sensitivity of
model family towards biological data. Figure 6 experimental
Figure 4. Mono view using Symposar (4D alignment) of the
protease inhibitor series used for the study.
Copyright © 2011 SciRes. OJMC
11
S. DUBEY ET AL.
(a)
(b)
Figure 5. (a) Mono representation of the surrogates for the
series of protease inhibitors under study. The mapped
properties are colored as follows: pink, positive charge salt
bridge; green, H-bond donor; bright yellow, H-bond ac-
ceptor; dark yellow, positively charged hydrophobic; dark
brown, negatively charged hydrophobic; blue, neutral hy-
drophobic; (b) Mono representation of the surrogates in
wire meshes and point form.
(a)
(b)
Figure 6. (a) Comparison of experimental and predicted
binding affinities for the series of protease inhibitors: cor-
rect simulation; (b) Scramble test.
and predicted Ki value along with scramble test results.
All the values of ΔGexpt, of ΔGcal and ΔΔG etc. are given
in Table 8 and the comparison of cross validated r2 with
the predicted r2 and rms etc. is shown in Figure 7.
To identify potential sites and functionalities allowing
a further increase of the binding affinity, the individual
functional groups of both training and test set were ana-
lyzed for their contributions toward the free energy of
ligand binding, ΔG, which includes enthalpy (electrostatic,
Copyright © 2011 SciRes. OJMC
S. DUBEY ET AL.
Copyright © 2011 SciRes. OJMC
12
Table 8. Experimental and Calculated ΔG values for training set under study.
Ligands Confor
mers Ki(nM) ΔG
(exp.) ΔG(pred.) ΔΔG
(exp.-pred.)
ΔESD
(pred)
Ki
(exp.)
Ki
(pred.)
Factor of
f
in Ki
A1A 4 20 0000 –8.833 ± 0.148–8.833 0.1481.000 2.576 × 10 – 7 (± 6.96 × 10 – 8)388239
A2A 4 29 10.104 –9.637 ± 0.118 0.467 0.1182.900 × 10 – 8 6.466 × 10 – 8 (± 1.344 × 10 – 8)1.2
A3A 4 27 10.146 –9.565 ± 0.150 0.581 0.1502.68 × 10 – 8 7.31 × 10 – 8 (± 1.961 × 10 – 8)1.7
A5A 4 680 –8.267 –9.331 ± 0.167–1.064 0.1676.804 × 10 – 7 1.094 × 10 – 7 (± 3.317 × 10 – 7)5.2
A6A 4 66 –9.625 –7.864 ± 0.210 1.761 0.2106.602 × 10 – 8 1.359 × 10 – 6 (± 5.181 × 10 – 7)9.6
A7A 4 76 –9.543 –10.265 ± 0.163–.0.722 0.1637.601 × 10 – 8 2.200 × 10 – 8 (± 6.359 × 10 – 9)2.5
A9A 2 40 –9.917 –8.962 ± 0.157 0.955 0.1573.998 × 10 – 8 2.062 – 10 – 7 (± 6.308 × 10 – 8)4.2
B0A 4 65 –9.634 –9.915 ± 0.167–0.281 0.1676.501 × 10 – 8 4.012 × 10 – 8 (± 1.228 × 10 – 8)0.6
B1A 2 15 –10.488 –10.540 ± 0.138–0.052 0.1381.499 × 10 – 8 1.371 × 10 – 8 (± 3.453 × 10 – 9)0.1
B2A 3 50 –9.787 –8.117 ± 0.180 1.670 0.1804.999 × 10 – 8 8.804 × 10 – 7(± 2.725 × 10 – 7)16.6
B3A 2 300 –8.744 –9.992 ± 0.136–1.248 0.1362.999 × 10 – 7 3.513 × 10 – 8 (± 9.525 × 10 – 9)7.5
B4A 4 1400 –7.847 –6.402 ± 0.176 1.445 0.1761.400 × 10 – 6 1.674 × 10 – 5 (± 5.659 × 10 – 6)11
B5A 4 104 –9.360 –9.519 ± 0.126–0.159 0.1261.041 × 10 – 7 7.915 × 10 – 8 (± 1.749 × 10 – 8)0.3
B7A 4 125 –9.253 –9.834 ± 0.130–0.581 0.1301.251 × 10 – 7 4.609 × 10 – 8 (± 1.048 × 10 – 8)1.7
B8A 4 20 –10.320 –8.943 ± 0.118 1.377 0.1182.001 × 10 – 8 2.130 × 10 – 7 (± 4.430 × 10 – 8)9.6
B9A 4 173 –9.064 –9.018 ± 0.154 0.046 0.1541.731 × 10 – 7 1.874 × 10 – 7 (± 5.5015 × 10 – 8)0.1
C0A 4 17 –10.415 –9.228 ± 0.152 1.187 0.1521.700 × 10 – 8 1.306 × 10 – 7 (± 3.518 × 10 – 8)6.7
C2A 4 38 –9.947 –10.659 ± 0.152–0.712 0.1523.797 × 10 – 8 1.117 × 10 – 8 (± 2.921 × 10 – 9)2.4
C3A 4 3400 –7.330 –6.964 ± 0.168 0.366 0.1683.402 × 10 – 6 6.375 × 10 – 6 (± 1.948 × 10 – 6)0.9
C5A 5 2100 –7.611 –7.617 ± 0.212–0.006 0.2122.100 × 10 – 6 2.080 × 10 – 6 (± 8.952 × 10 – 7)0.0
C6A 4 >20000 –6.299 –6.420 ± 0.180–0.121 0.1801.999 × 10 – 5 1.624 × 10 – 5 (± 5.626 × 10 – 6)0.2
C7A 4 >10000 –6.702 6.977 ± 0.124 –0.275 0.1241.001 × 10 – 5 6.236 × 10 – 5 (± 1.416 × 10 – 6)0.6
D0A 4 43 –9.875 –10.804 ± 0.127–0.929 0.1274.297 × 10 – 8 8.720 × 10 – 9 (± 1.941 × 10 – 9)3.9
D1A 4 17 –10.415 –8.985 ± 0.195 1.430 0.1951.700 × 10 – 8 1.981 × 10 – 7 (± 6.842 × 10 – 8)10.7
D3A 4 0.5 –12.468 –11.843 ± 0.216 0.625 0.2164.998 × 10 – 101.462 × 10 – 9 (± 6.131 × 10 – 101.9
D4A 4 3000 –7.403 –7.718 ± 0.279–0.315 0.2793.001 × 10 – 6 1.746 × 10 – 6 (± 9.990 × 10 – 70.7
D7A 2 15 –10.488 –11.699 ± 0.214–1.211 0.2141.499 × 10 – 8 1.873 × 10 – 9 (± 7.925 × 10 – 10)7.0
H5A 4 2 –11.531 –10.395 ± 0.206 1.136 0.2062.499 × 10 – 9 1.759 × 10 – 8 (± 7.269 × 10 – 9)6
H6A 3 1.2 –11.958 –12.229 ± 0.212–0.271 0.2121.200 × 10 – 9 7.534 × 10 – 10 (± 3.07 × 10 – 10)0.6
H9A 4 1.5 –11.828 –11.784 ± 0.130 0.044 0.1301.501 × 10 – 9 1.617 × 10 – 9 (± 3.641 × 10 – 10)0.1
I0A 1 1.6 –11.791 –11.648 ± 0.127 0.143 0.1271.599 × 10 – 9 2.043 × 10 – 9 (± 4.656 × 10 – 10)0.3
I1A 1 2.1 –11.632 –11.647 ± 0.162–0.015 0.1622.101 × 10 – 9 2.049 × 10 – 9 (± 6.321 × 10 – 10)0.0
I2A 3 1.1 ± 0.4 –12.009 –11936 ± 0.167 0.073 0.1671.100 × 10 – 9 1.247 × 10 – 9 (± 3.923 × 10 – 10)0.1
I3A 2 1.2 –11.958 –11.696 ± 0.153 0.262 0.1531.200 × 10 – 9 1.883 × 10 – 9 (± 5.323 × 10 – 10)0.6
I4A 4 2.2 –11.605 –10.237 ± .266 1.368 0.2662.201 × 10 – 9 2.306 × 10 – 8 (± 1.437 × 10 – 8)9.5
I5A 4 20±3 –10.320 –9.557 ± 0.220 0.763 0.2202.001 × 10 – 8 7.423 × 10 – 8 (± 2.955 × 10 – 82.7
I8A 2 400 –8.576 –9.866 ± 0.175–1.290 0.1754.002 × 10 – 7 4.362 × 10 – 8 (± 1.427 × 10 – 8)8.2
I9A 4 >1000 –8.043 –8.287 ± 0.188–0.244 0.1889.997 × 10 – 7 6.578 × 10 – 7 (± 2.217 × 10 – 7)0.5
J0A 4 480 –8.470 –8.253 ± 0.172 0.217 0.1724.801 × 10 – 7 6.968 × 10 – 7 (± 2.915 × 10 – 70.5
J1A 4 150 –9.147 –11.041 ± 0.152–1.894 0.1521.501 × 10 – 7 5.801 × 10 – 9 (± 1.570 × 10 – 9)24.9
J3A 1 0.85 –12.159 –11.504 ± 0.124 0.655 0.1248.498 × 10 – 102.617 × 10 – 9 (± 5.871 × 10 – 10)2.1
J5A 1 0.28 –12.805 –12.073 ± 0.121 0.732 0.1212.802 × 10 – 109.855 × 10 – 10 (± 2.18 × 10 – 10)2.5
J6A 1 1.27 –11.925 –11.878 ± 0.196 0.047 0.1961.270 × 10 – 9 1.378 × 10 – 9 (± 5.282 × 10 – 10)0.1
J7A 2 0.12 –13.299 –12.398 ± 0.105 0.901 0.1051.199 × 10 – 105.638 × 10 – 10 (± 1.06 × 10 – 10)3.7
J9A 2 0.85 –12.159 –12.184 ± 0.141–0.025 0.1418.498 × 10 – 9 8.138 × 10 – 10 (± 2.05 × 10 – 10)0.0
K0A 4 0.31 –12.746 –12.452 ± 0.210 0.294 0.2103.100 × 10 – 105.140 × 10 – 10 (± 2.07 × 10 – 10)0.7
K1A 1 0.28 –12.805 –12460 ± 0.103 0.345 0.1032.802 × 10 – 105.064 × 10 – 10 (± 9.35 × 10 – 11)0.8
K2A 2 0.31 –12.746 –12.599 ± 0.111 0.147 0.1113.100 × 10 – 103.989 × 10 – 10 (± 7.874 × 10 – 11)0.3
K3A 1 0.035 –14.016 –12.804 ± 0.148 1.212 0.1483.499 × 10 – 112.808 × 10 – 10 (± 7.359 × 10 – 11)7
Ligands
(Test)
Cofor
mers Ki(nM) ΔG
(exp.)
ΔG (pred.)
ΔESD
(pred.)
Ki
(e × p.)
Ki
(pred.)
Factor
off Ki
A4A 4 220 –8.924 –0.9781 0.135 –0.857 0.1352.201 × 10 – 7 5.052 × 10 – 8 (1.230 × 10 – 8)3.4
C1A 4 200 –8.980 –8.907 0.147 0.073 0.1471.999 × 10 – 7 2.265 × 10 – 7 (5.664 × 10 – 8)0.1
C4A 1 >10,000 –6.702 –6.990 0.184 –0.288 0.1841.001 × 10 – 5 6.101 × 10 – 6 (2.055 × 10 – 6)0.6
I6A 4 150 –9.147 –9.393 0.184 –0.246 0.1841.501 × 10 – 7 9.833 × 10 – 8 (3.188 × 10 – 8)0.5
J4A 4 0.31 –12.746 –11.361 0.205 1.385 0.2053.100 × 10 – 103.347 × 10 – 9 (1.320 × 10 – 9)9.8
K4A 1 0.24 –12.895 –12.519 0.137 0.376 0.1372.400 × 10 – 104.578 × 10 – 10 (1.136 × 10 – 10)0.9
13
S. DUBEY ET AL.
Figure 7. Scatter plot of the model for the series of protease
inhibitors under study.
van der Waals, H-bond, and polarization terms), entropic,
salvation and induced fit contributions towards calcu-
lated binding affinity.
In Raptor study, the surrogate family included 10 in-
dependent receptor models and was evolved over 1500
optimization cycles. The simulation converged at cross-
validated r2 of 0.94 and a predictive r2 of 0.745. A com-
parison between predicted and experimental Ki value is
given as a graphical representation in Figure 8 and a
representation of receptor surrogate is depicted in Figure
9.
Comparison of the binding site at the true biological
receptor (3EKV from PDB) Figure 10 with surrogate
family receptor models obtained by multi dimensional
QSAR (Figures 5 and 9) showed the similarity in their
shapes. The characteristic property like hydrogen bond
acceptor mimicking amino acids and H-bond donor
mimicking amino acids and hydrophobic pocket etc. are
well identified by model when compared to the actual
receptor. The receptor and the models are bean shaped
which can be best described as a predominantly hydro-
phobic pocket in the upper half of the region with dis-
tinct “V” shape. The hydrophilic regions, on the periph-
ery may be characterized as H-bond acceptor rich area
and also accommodates a positive salt bridge mainly in
the form of terminal aromatic ring. A prominent H-bond
acceptor region lies in the centre depression of the bean
shaped structures of the inhibitors. The similar substitu-
tion analogy can be considered for Darunavir, sine both
of them hold structure similarity.
Figure 8. Comparison of experimental and predicted in-
hibitory constant value for the series of protease inhibitors
under study.
Figure 9. Dual-shell representation of a Raptor model for
the series of protease inhibitors under study. The inner
shell is depicted as wireframe and outer shell depicted as
surface filled model. The color coding of points is same as in
Figure 5.
Based on the present QSAR studies obtained from
Topomer CoMFA, Quasar and Raptor hypothetical bind-
ing model of these ligand molecules with HIV protease can
be proposed (Figure 10). In the anionic/hydrophilic site,
Copyright © 2011 SciRes. OJMC
S. DUBEY ET AL.
14
Figure 10. Proposed substitution on Amprenavir molecule based on the study.
ligands may form hydrogen bonds with the active sites of
the receptor. In the flat hydrophobic linker region, the
aromatic rings may have π-π interactions with the recep-
tor where the absolute planarity in the ligand structure is
essential. This is the most important region of ligand
molecules, which can be explored to design potent pro-
tease inhibitors. The large hydrophobic region/binding
site may play a significant role in the selectivity of
ligands over the counterparts of the protease.
4. Conclusions
The generation of contour plots in Topomer CoMFA
studies provided significant correlation of steric and
electrostatic fields with biological activity values. The
good prediction of activity of the test compounds has
shown that the models are useful and can be utilized for
prediction of PI activity bearing similar kind of frag-
ments. The new molecules can be designed by taking
clue from the electrostatic and steric fields around the
fragments. One of the advantages of topomer CoMFA is
it represents identically the contributions of fragments
that are structurally identical throughout a series, like a
common core and it is much faster in calculations in
comparison to CoMFA and CoMSIA.
The receptor modeling by Quasar and Raptor is based
on 6D QSAR which explicitly allows for the simulation
of induced fit and dual shell representation. To determine
the ligand receptor interactions, the scoring function
makes use of a directional force field. Ligand-binding
free energies are then derived based on ligand receptor
interactions, desolvation, entropy, internal strains, induce
fit and H-bond flip-flop. The QSAR models gave good
statistical results in terms of q2 and r2 values.
On comparing the models generated by Topomer
CoMFA, Quasar and Raptor we can see similarity in r2
and q2 values. Thus, we can conclude that the models
generated by these two technologies are similar to each
other even though they vary highly conceptually. The
power of the prediction lies with a low rate of false-
positive prediction. Even though these two technologies
are conceptually different but they have shown the simi-
larity in predictive powers. Both have certain pros and
cons which have been described in detail by their devel-
opers in their manuals (available online) and in certain
publications. The information obtained in this study pro-
vides a methodology for predicting the affinity of am-
prenavir related compounds for guiding structural design
of novel yet potent PIs.
5. Acknowledgements
We wish to express our gratitude to Department of Sci-
ence and Technology and All India Council for Techni-
cal Education, Govt. of India, New Delhi, India, for their
financial assistance. Support from Tripos Inc., USA and
Biographics Laboratory 3R, Switzerland is also grate-
fully acknowledged.
6. References
[1] H. Mitsuya, R. Yarchoan and S. Broder, “Molecular Tar-
gets for AIDS Therapy,” Science, Vol. 249, No. 4976,
1990, pp. 1533-1544. doi:10.1126/science.1699273
[2] R. Yarchoan, H. Mitsuya and S. Broder, “Challenges in
the Therapy of HIV Infection,” Trends in Pharmacologi-
cal Science, Vol. 14, No. 5, 1993, pp. 196-202.
do i:1 0. 10 16 /01 65 - 61 47 (93 ) 90 20 8-2
[3] C. U. Hellen, H. G. Krausslich and E. Wimmer, “Prote-
olytic Processing of Polyproteins in the Replication of
RNA Viruses,” Biochemistry, Vol. 28, No. 26, 1989, pp.
9881-9890. doi:10.1021/bi00452a001
Copyright © 2011 SciRes. OJMC
15
S. DUBEY ET AL.
[4] J. Vondrasek and A. Wlodawer, “A Database of the
Structures of Human Immunodeficiency Virus Protease,”
Proteins, Vol. 49, No. 4, 2002, pp. 429-431.
doi:10.1002/prot.10246
[5] M. L. West and D. P. Fairlie, “Targeting HIV-1 Protease:
A Test of Drug-Design Methodologies,” Trends in Phar-
macologi c al Sc i e nc e , Vol. 16, No. 2, 1995, pp. 67-75.
doi:10.1016/S0165-6147(00)88980-4
[6] T. D. Meek, “Inhibitors of HIV-1 Protease,” Enzyme
Inhibition, Vol. 6, No. 1, 1992, pp. 65-98.
doi:10.3109/14756369209041357
[7] C. Merry, M. G. Barry, F. Mulcahy, K. L. Halifax and D.
J. Back, “Saquinavir Pharmacokinetics Alone and In
Combination with Nelfinavir in HIV-Infected Patients,”
AIDS, Vol. 11, No. 15, 1997, pp. F117-F120.
do i:1 0. 10 97 /00 00 20 30 - 19 97 15 000 -00 00 1
[8] E. L. Ellsworth, J. Domagala, J. V. Prasad, S. Hagen, D.
Ferguson, T. Holler, D. Hupe, N. Graham, C. Nouhan, P.
J. Tummino, G. Zeikus and E. A. Lunney, “4-Hydroxy-
5,6-dihydro-2H-pyran-2-ones.3. Bicyclic and Hetero-Ar-
omatic Ring Systems as 3-Position Scaffolds to Bind to
S1' and S2' of the HIV-1 Protease Enzyme,” Bioorganic
& Medicinal Chemistry Letters, Vol. 9, No. 14, 1999, pp.
2019-2024. doi:10.1016/S0960-894X(99)00332-7
[9] A. K. Patick, K. E. Potts, “Protease Inhibitors as Antiviral
Agents,” Clinical Microbiology Reviews, Vol. 11, No. 4,
1998, pp. 614-627.
[10] J. R. Huff, “HIV Protease: A Novel Chemotherapeutic
Target for AIDS,” Journal of Medicinal Chemistry, Vol.
34, No. 8, 1991, pp. 2305-2312.
doi:10.1021/jm00112a001
[11] N. E. Kohl, E. A. Emini, W. A. Schleif, L. J. Davis, J. C.
Heimbach, R. A. Dixon, E. M. Scolnick and I. Sigal,
“Active Human Immunodeficiency Virus Protease is Re-
quired for Viral,” Proceedings of the National Academy
of Science USA, Vol. 85, No. 3, 1988, pp. 4686-4690.
doi :1 0. 1073 / pn as. 8 5.13 . 46 86
[12] E. T. Brower, U. M. Bacha, Y. Kawasaki and E. Freire,
“Inhibition of HIV-2 Protease by HIV-1 Protease Inhibi-
tors in Clinical Use,” Chemical Biology and Drug Design,
Vol. 71, No. 4, 2008, pp. 298-305.
doi:10.1111/j.1747-0285.2008.00647.x
[13] G. Bold, H. G. Capraro, R. Cozens, T. Klimkait, J. Laz-
dins, J. Mestan, B. Poncioni, J. Rosel, V. Stover, M. Tin-
telnot-Blomley, F. Acemoglu, W. Beck, B. Boss, M.
Eschbachm, T. Hurlimann, E. Masso, S. Roussel, K. Uc-
ciStoll, D. Wyss and M. Lang, “New Aza-Dipeptide
Analogues as Potent and Orally Absorbed HIV-1 Protease
Inhibitors: Candidates for Clinical Development,” Journal of
Medicinal Che mistry, Vol. 41, No. 18, 1998, pp. 3387-3401.
doi:10.1021/jm970873c
[14] D. C. Richard, “Topomer CoMFA: A Design Methodol-
ogy for Rapid Lead Optimization,” Journal of Medicinal
Chemistry, Vol. 46, No. 3, 2003, pp. 374-388.
doi:10.1021/jm020194o
[15] F. G. Salituro, C. T. Baker, J. J. Court, D. D. Deininger, E.
E. Kim and B. Li, “Design and Synthesis of Novel Con-
formationally Restricted HIV Protease Inhibitors,” Bio-
organic Medicinal Chemistry Letters, Vol. 8, No. 24,
1998, pp. 3637-3642.
doi:10.1016/S0960-894X(98)00670-2
[16] C. T. Baker, F. G. Salituro, J. J. Court, D. D. Deininger, E.
E. Kim, B. Li, P. M. Novak, B. G. Rao, S. Pazhanisamy,
W. C. Schairer and R. D. Tung, “Design, Synthesis and
Conformational Analysis of a Novel Series of HIV Pro-
tease Inhibitor,” Bioorganic Medicinal Chemistry Letters,
Vol. 8, No. 24, 1998, pp. 3631-3636.
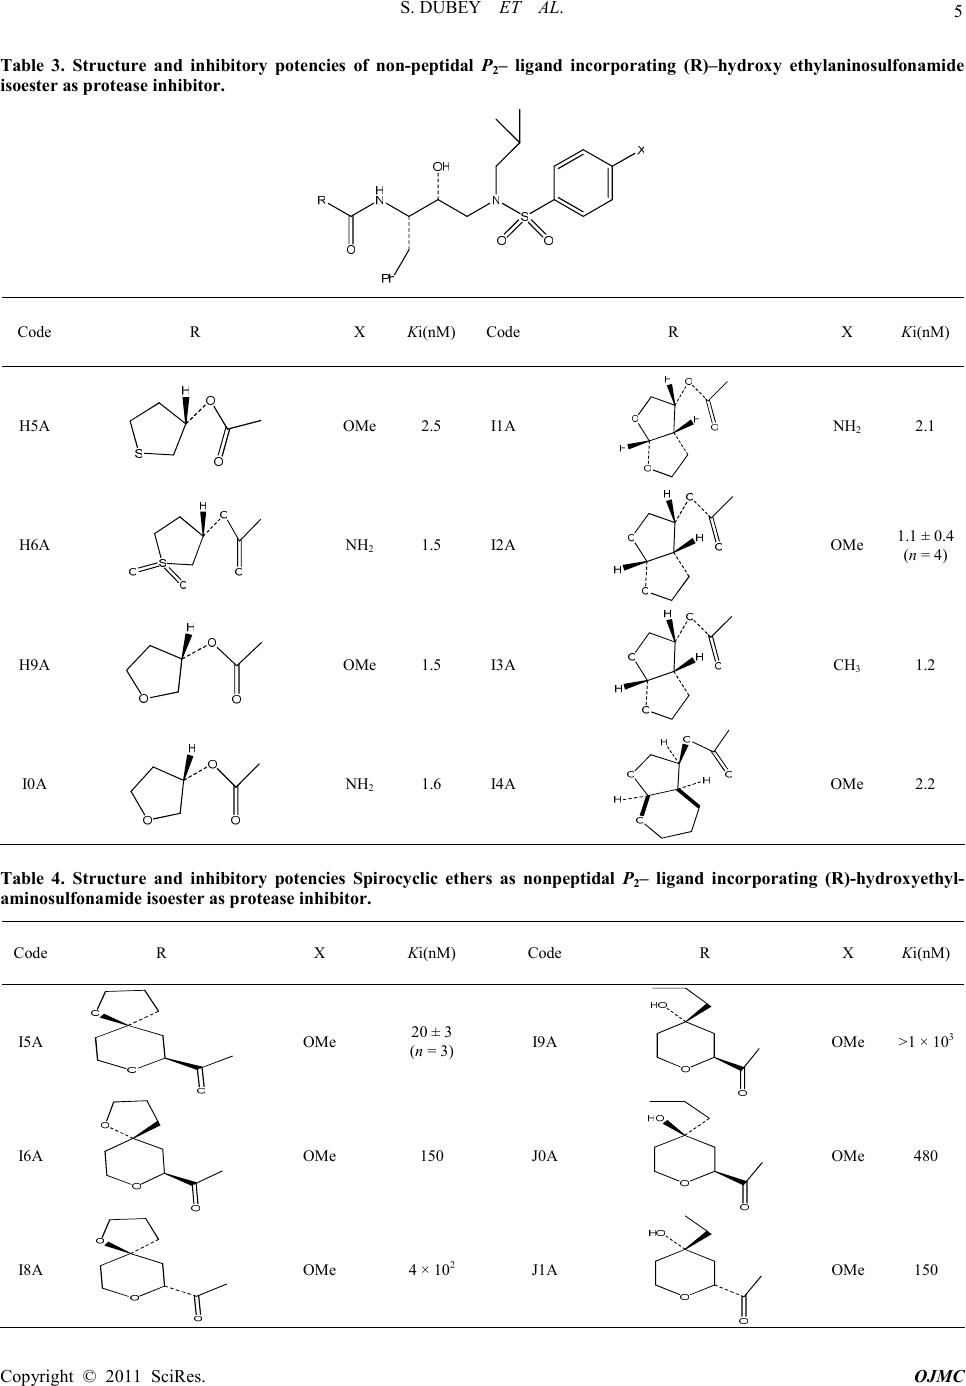
[17] A. K. Ghosh, J. F. Kincaid, W. Cho, D. E. Walters, K.
Krishnan, K. A. Hussain, Y. Koo, H. Cho, C. Rudall, L.
Holland and J. Buthod, “Potent HIV Protease Inhibitors
Incorporating High-Affinity P2-Ligands and (R)-(Hyd-
roxyethylamino)Sulfonamide Isoesters,” Bioorganic Me-
dicinal Chemistry Letters, Vol. 8, No. 6, 1998, pp. 687-
690.
[18] A. K. Ghosh, J. F. Kincaid, W. Cho, D. E. Walters, H.
Cho, Y. Koo, J. Trevino, L. Holland and J. Buthod,
“Structure Based Design: Novel Spirocyclic Ethers as
Nonpeptidal P2-Ligands for HIV Protease Inhibitors,”
Bioorganic Medicinal Chemistry Letters, Vol. 8, No. 8,
1998, pp. 979-982. doi:10.1016/S0960-894X(98)00139-5
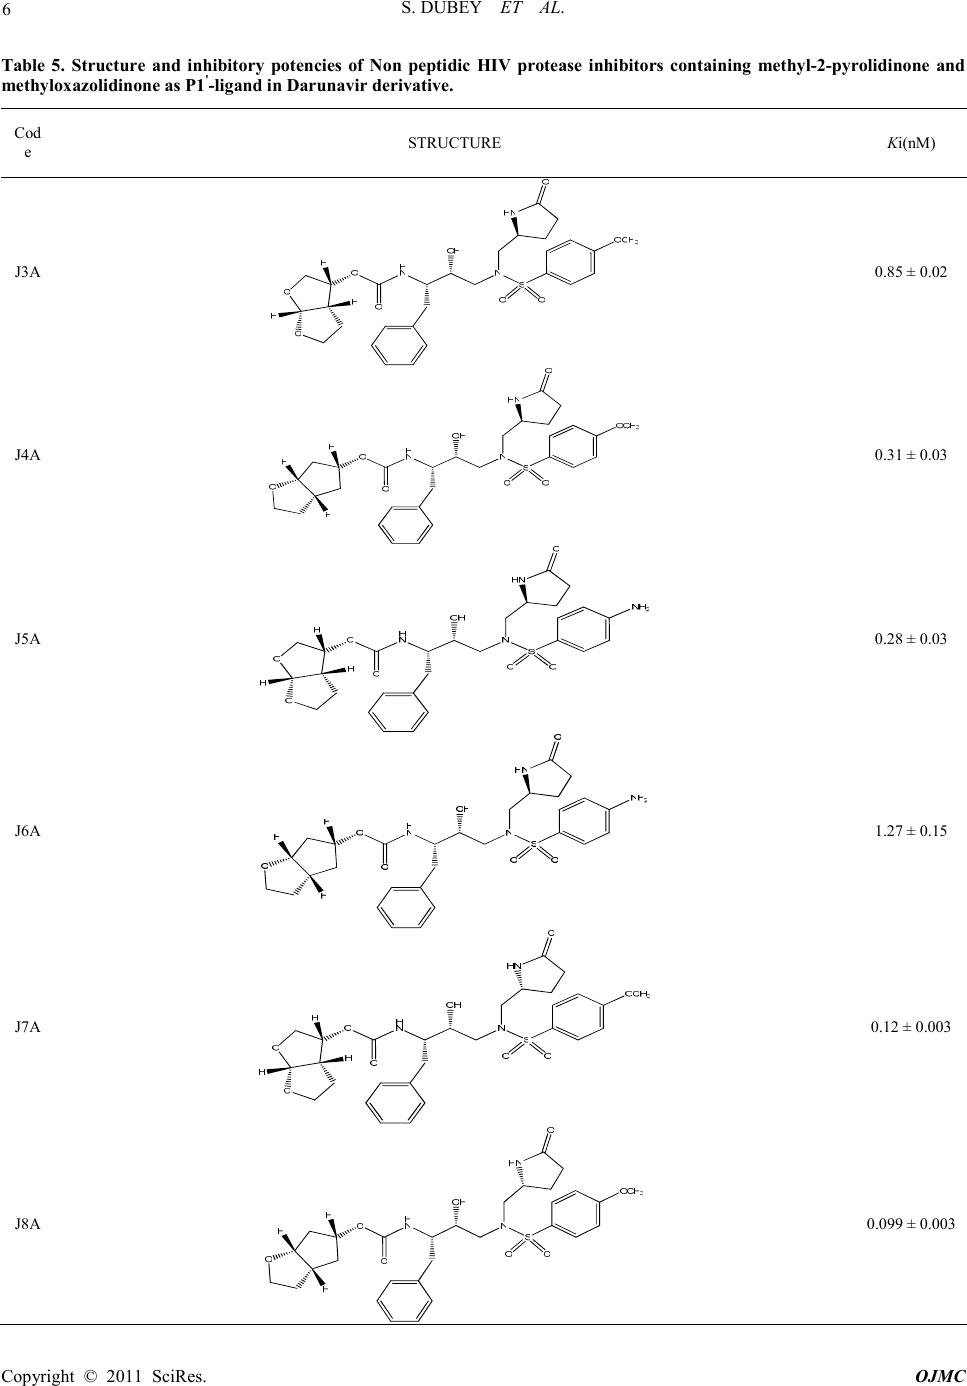
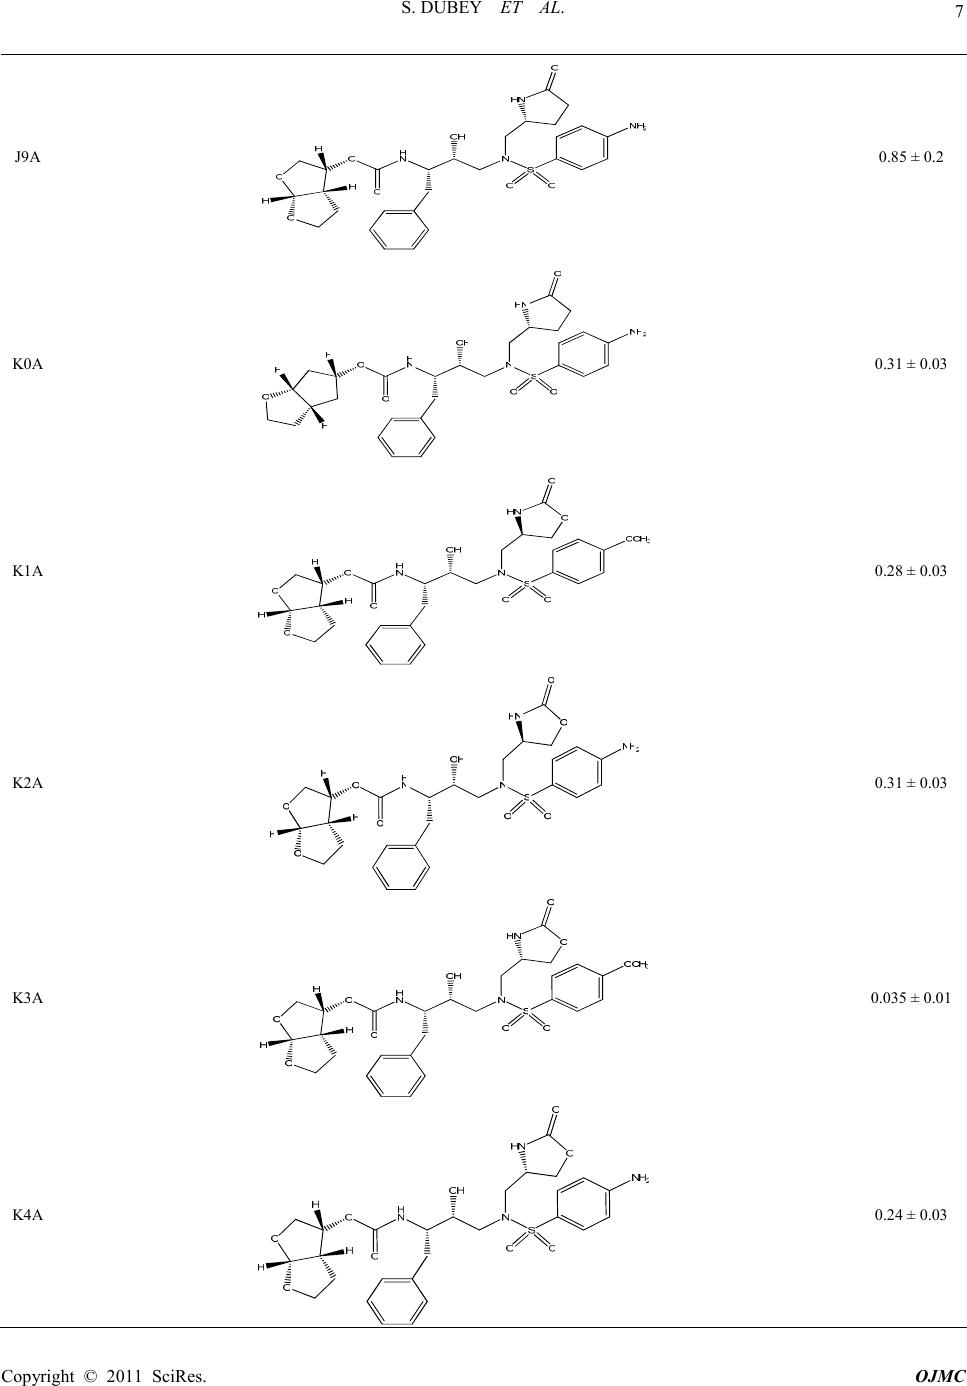
[19] A. K. Ghosh, S. Leshchenko-Yashchuk, D. D. Anderson,
A. Baldridge, M. Noetzel, H. B. Miller, Y. Tie, Y. F.
Wang, Y. Koh, I. T. Weber and H. Mitsuya, “Design of
HIV-1 Protease Inhibitors with Pyrrolidinones and Oxa-
zolidinones as Novel P1'-Ligands to Enhance Backbone-
Binding Interactions with Protease: Synthesis, Biological
Evaluation and Protien-Ligand X-Ray Studies,” Journal
of Medicinal Chemistry, Vol. 52, No. 13, 2009, pp. 3902-
3914. doi:10.1021/jm900303m
[20] R. D. Cramer, “Topomer CoMFA: A Design Methodol-
ogy for Rapid Lead Optimization,” Journal of Medicinal
Chemistry, Vol. 46, No. 3, 2003, pp. 374-388.
doi:10.1021/jm020194o
[21] R. D. Cramer, R. J. Jilek and K. M. Andrews, “Topomer
Similarity Searching of Conventional Databases,” Jour-
nal of Molecular Graphics and Modeling, Vol. 20, No. 6,
2002, pp. 447-462. doi:10.1016/S1093-3263(01)00146-2
[22] A. Vedani and M. Dobler, “5D-QSAR: the Key for
Simulating Induced Fit?” Journal of Medicinal Chemistry,
Vol. 45, No. 11, 2002, pp. 2139-2149.
doi:10.1021/jm011005p
[23] A. Vedani, M. Dobler and M. A. Lill, “Combining Pro-
tein Modeling and 6D-QSAR. Simulating the Binding of
Structurally Diverse Ligands to the Estrogen Receptor,” Jou r-
nal of Medicinal Chemistry, Vol. 48, No. 11, 2005, pp. 3700-
3703. doi:10.1021/jm050185q
[24] A. Vedani, M. Dobler, H. Dollinger, M. Hasselbach Kai,
F. Birke and M. A. Lill, “Novel Ligands for the
Chemokine Receptor-3 (CCR3): A Receptor-Modelling
Study Based on 5D-QSAR,” Journal of Medicinal Chem-
istry, Vol. 48, No. 5, 2005, pp. 1515-1527.
doi:10.1021/jm040827u
[25] A. Vedani, “QSAR: Prediction Beyond the Fourth Di-
mension,” Drug Discovery and Development, 2005.
http://www.dddmag.com/qsar-prediction-beyond-the-four
th.aspx.
Copyright © 2011 SciRes. OJMC
S. DUBEY ET AL.
Copyright © 2011 SciRes. OJMC
16
[26] D. Rogers and A. J. Hopfinger, “Genetic Function Ap-
proximation to Generate a Family of QSAR Equations
Using Genetic Algorithms,” Journal of Chemical Infor-
mation and Modeling, Vol. 34, 1994, pp. 854-866.
[27] A. Vedani, M. Dobler and M. A. Lill, “In Silico Predic-
tion of Harmful Effects Triggered by Drugs and Chemi-
cals,” Toxicology and Applied Pharmacology, Vol. 207,
No. 2, 2005, pp. S398-S407.
do i:1 0. 10 16 /j . taap .2 00 5. 01 . 05 5
[28] M. A. Lill, A. Vedani and M. Dobler, “Raptor Combining
Dual Shell Representation, Induced-Fit Simulation and
Hydrophobicity Scoring in Receptor-Modeling: Applica-
tion towards the Simulation of Structutrally Diverse
Ligand Sets,” Journal of Medicinal Chemistry, Vol. 47,
No. 25, 2004, pp. 6174-6186.