Paper Menu >>
Journal Menu >>
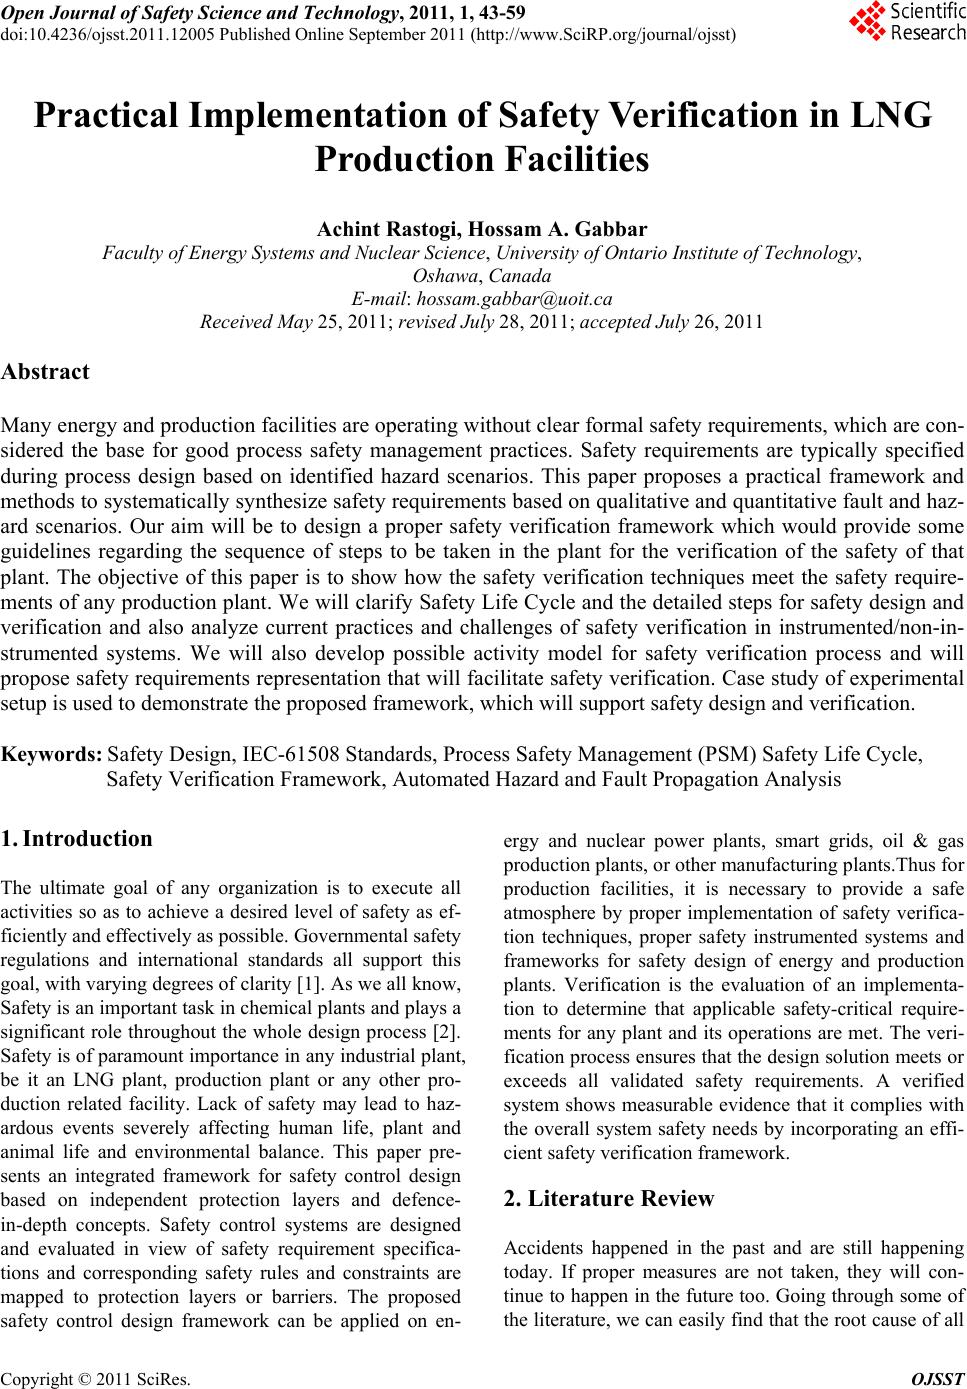 Open Journal of Safety Science and Technology, 2011, 1, 43 -59 doi:10.4236/ojsst.2011.12005 Published Online September 2011 (http://www.SciRP.org/journal/ojsst) Copyright © 2011 SciRes. OJSST Practical Implementation of Safety Verification in LNG Production Facilities Achint Rastogi, Hossam A. Gabbar Faculty of Energy Systems and Nuclear Science, University of Ontario Institute of Technology, Oshawa, Canada E-mail: hossam.gabbar@uoit.ca Received May 25, 2011; revised July 28, 2011; accept ed July 26, 2011 Abstract Many energy and production facilities are operating without clear formal safety requirements, which are con- sidered the base for good process safety management practices. Safety requirements are typically specified during process design based on identified hazard scenarios. This paper proposes a practical framework and methods to systematically synthesize safety requirements based on qualitative and quantitative fault and haz- ard scenarios. Our aim will be to design a proper safety verification framework which would provide some guidelines regarding the sequence of steps to be taken in the plant for the verification of the safety of that plant. The objective of this paper is to show how the safety verification techniques meet the safety require- ments of any production plant. We will clarify Safety Life Cycle and the detailed steps for safety design and verification and also analyze current practices and challenges of safety verification in instrumented/non-in- strumented systems. We will also develop possible activity model for safety verification process and will propose safety requirements representation that will facilitate safety verification. Case study of experimental setup is used to demonstrate the proposed framework, which will support safety design and verification. Keywords: Safety Design, IEC-61508 Standards, Process Safety Management (PSM) Safety Life Cycle, Safety Verification Framework, Automated Hazard and Fault Propagation Analysis 1. Introduction The ultimate goal of any organization is to execute all activities so as to achieve a desired level of safety as ef- ficiently and effectively as possible. Governmental safety regulations and international standards all support this goal, with varying degrees of clarity [1]. As we all know, Safety is an important task in chemical plants and plays a significant role throughout the whole design process [2]. Safety is of paramount importance in any industrial plant, be it an LNG plant, production plant or any other pro- duction related facility. Lack of safety may lead to haz- ardous events severely affecting human life, plant and animal life and environmental balance. This paper pre- sents an integrated framework for safety control design based on independent protection layers and defence- in-depth concepts. Safety control systems are designed and evaluated in view of safety requirement specifica- tions and corresponding safety rules and constraints are mapped to protection layers or barriers. The proposed safety control design framework can be applied on en- ergy and nuclear power plants, smart grids, oil & gas production plants, or other manufacturing plants.Thus for production facilities, it is necessary to provide a safe atmosphere by proper implementation of safety verifica- tion techniques, proper safety instrumented systems and frameworks for safety design of energy and production plants. Verification is the evaluation of an implementa- tion to determine that applicable safety-critical require- ments for any plant and its operations are met. The veri- fication process ensures that the design solution meets or exceeds all validated safety requirements. A verified system shows measurable evidence that it complies with the overall system safety needs by incorporating an effi- cient safety verification framework. 2. Literature Review Accidents happened in the past and are still happening today. If proper measures are not taken, they will con- tinue to happen in the future too. Going through some of the literature, we can easily find that the root cause of all 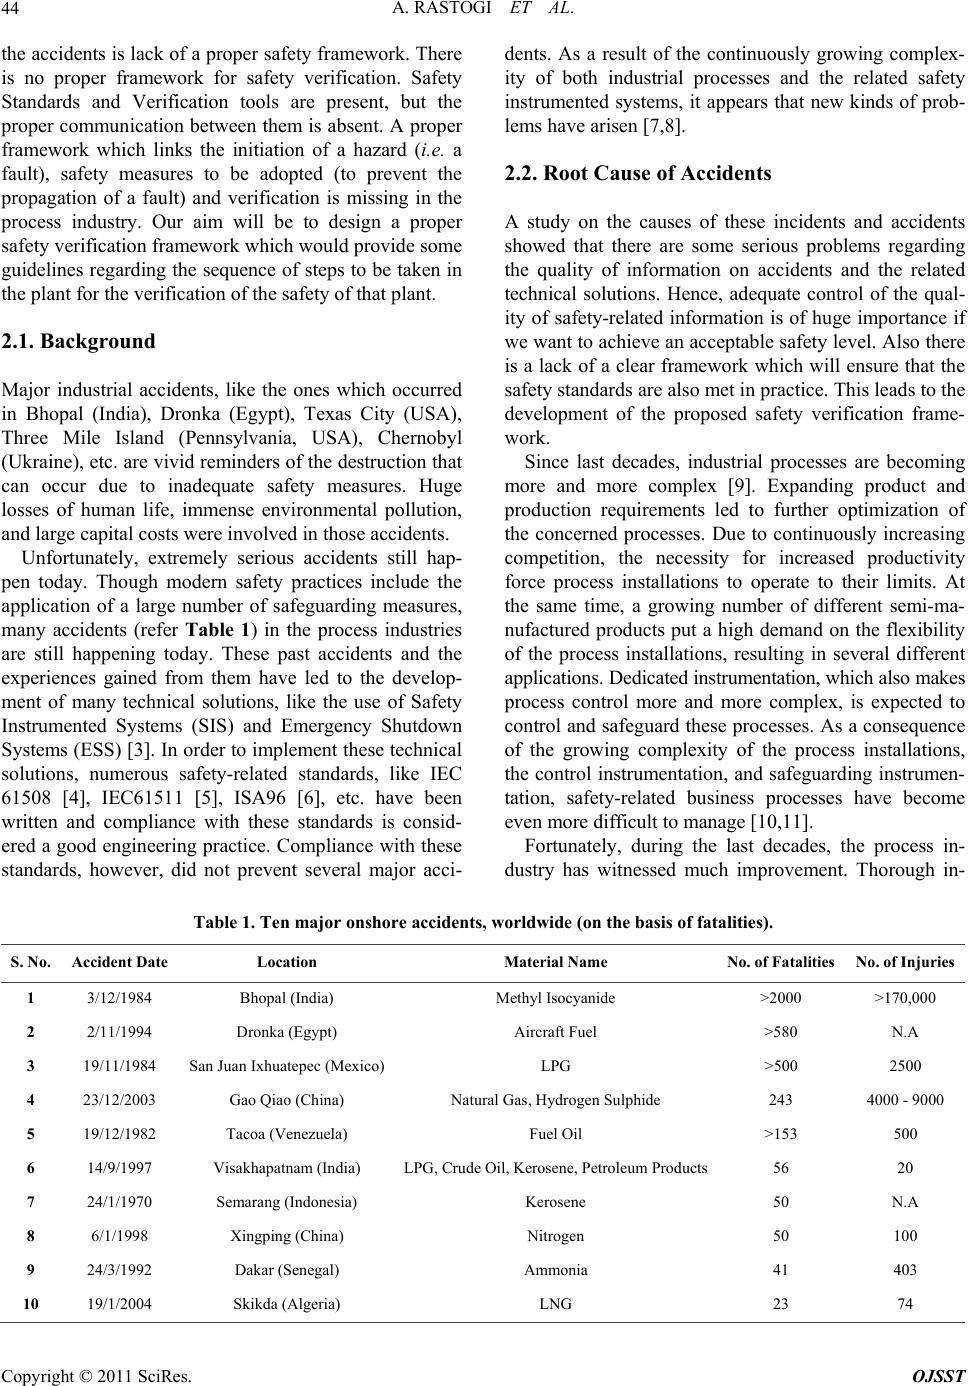 A. RASTOGI ET AL. 44 the accidents is lack of a proper safety framework. There is no proper framework for safety verification. Safety Standards and Verification tools are present, but the proper communication between them is absent. A proper framework which links the initiation of a hazard (i.e. a fault), safety measures to be adopted (to prevent the propagation of a fault) and verification is missing in the process industry. Our aim will be to design a proper safety verification framework which would provide some guidelines regarding the sequence of steps to be taken in the plant for the verification of the safety of that plant. 2.1. Background Major industrial accidents, like the ones which occurred in Bhopal (India), Dronka (Egypt), Texas City (USA), Three Mile Island (Pennsylvania, USA), Chernobyl (Ukraine), etc. are vivid reminders of the destruction that can occur due to inadequate safety measures. Huge losses of human life, immense environmental pollution, and large capital costs were involved in those accidents. Unfortunately, extremely serious accidents still hap- pen today. Though modern safety practices include the application of a large number of safeguarding measures, many accidents (refer Table 1) in the process industries are still happening today. These past accidents and the experiences gained from them have led to the develop- ment of many technical solutions, like the use of Safety Instrumented Systems (SIS) and Emergency Shutdown Systems (ESS) [3]. In order to implement these technical solutions, numerous safety-related standards, like IEC 61508 [4], IEC61511 [5], ISA96 [6], etc. have been written and compliance with these standards is consid- ered a good engineering practice. Compliance with these standards, however, did not prevent several major acci- dents. As a result of the continuously growing complex- ity of both industrial processes and the related safety instrumented systems, it appears that new kinds of prob- lems have arisen [7,8]. 2.2. Root Cause of Accidents A study on the causes of these incidents and accidents showed that there are some serious problems regarding the quality of information on accidents and the related technical solutions. Hence, adequate control of the qual- ity of safety-related information is of huge importance if we want to achieve an acceptable safety level. Also there is a lack of a clear framework which will ensure that the safety standards are also met in practice. This leads to the development of the proposed safety verification frame- work. Since last decades, industrial processes are becoming more and more complex [9]. Expanding product and production requirements led to further optimization of the concerned processes. Due to continuously increasing competition, the necessity for increased productivity force process installations to operate to their limits. At the same time, a growing number of different semi-ma- nufactured products put a high demand on the flexibility of the process installations, resulting in several different applications. Dedicated instrumentation, which also makes process control more and more complex, is expected to control and safeguard these processes. As a consequence of the growing complexity of the process installations, the control instrumentation, and safeguarding instrumen- tation, safety-related business processes have become even more difficult to manage [10,11]. Fortunately, during the last decades, the process in- dustry has witnessed much improvement. Thorough in- Table 1. Ten major onshore accidents, worldwide (on the basis of fatalities). S. No. Accident Date Location Material Name No. of Fatalities No. of Injuries 1 3/12/1984 Bhopal (India) Methyl Isocyanide >2000 >170,000 2 2/11/1994 Dronka (Egypt) Aircraft Fuel >580 N.A 3 19/11/1984 San Juan Ixhuatepec (Mexico)LPG >500 2500 4 23/12/2003 Gao Qiao (China) Natural Gas, Hydrogen Sulphide 243 4000 - 9000 5 19/12/1982 Tacoa (Venezuela) Fuel Oil >153 500 6 14/9/1997 Visakhapatnam (India) LPG, Crude Oil, Kerosene, Petroleum Products56 20 7 24/1/1970 Semarang (Indonesia) Kerosene 50 N.A 8 6/1/1998 Xingping (China) Nitrogen 50 100 9 24/3/1992 Dakar (Senegal) Ammonia 41 403 10 19/1/2004 Skikda (Algeria) LNG 23 74 Copyright © 2011 SciRes. OJSST  A. RASTOGI ET AL. Copyright © 2011 SciRes. OJSST 45 vestigations of accidents have resulted in specific haz- ardous event prevention with regard to process installa- tions. Consequently, many new safeguarding measures have been developed and are implemented. However, at the same time it has become extremely difficult to ac- quire a comprehensive view of the entire processes, in- strumentation and installations. Due to this growing complexity and an ever-expanding process capacity, the potential for serious accidents have heavily increased. Process Safety Management (PSM) is term frequently used to cover the set of safety-related operational activi- ties and processes, which results in a specific safety per- formance of a process installation. The British Health and Safety Executive (HSE) performed a comprehensive study and clearly illustrated that inadequate process safety management is the most essential factor that con- tributes to the number of hazardous events [12]. The ex- tent to which failures contributed to explosions in gas-fired plants in 1997 were investigated by the HSE. These failures were categorized into four groups (see Figure 1): Equipment-related failures, such as a manufacturing failure, design faults, or incorrect specification. The lack of equipment and equipment, which should have been fitted to the plant, but was not. Poor maintenance and incidents resulting directly from poor maintenance/ commissioning. Inadequate process safety management. Other examples of the causes of major industrial inci- dents are illustrated by Bradley [13]. He found out that 10% of all the investigated failures are contributed by manufacturing and equipment failures. Operating errors, management errors, design/specification errors, and main- tenance errors are the remaining contributing factors. Figure 1. Contribution of failures to explosions in gas-fired plant [HSE97]. “The overwhelming contributing factor that resulted in the explosions was inadequate PSM. A detailed analysis revealed that this deficient PSM was due to a lack of training, poor managerial supervision, and insufficient procedures” [HSE97: Health and Safety Executive, clause 6.2 of Contract Research Report 139/1997, “Explosions in gas-fired plant” United Kingdom 1997]. The HSE [14], as part of another study, investigated 34 incidents occurred in the UK, which were the result of control system failures. This study showed that the pri- mary causes of the control system failure were specifica- tion failures, installation and commissioning failures, failures to due changes after commissioning, design and implementation failures and operation/maintenance fail- ures. Another major finding of the study was that the failures appeared to occur during all phases throughout the lifetime of the control system. The task of the safety management system is to prevent these failures from occurring. Another study, in the similar field, was performed by the American Environmental Protection Agency (EPA). The EPA reviewed a large number of investigations of chemical plant accidents, over a period of several years and the EPA’s Chemical Emergency Preparedness and Prevention Office found, among other things, that op- erator errors were rarely the sole or even primary cause of an accident [15,16]. The majority of accidents in the process industry are not particularly the result of failure of the equipment or installation, but rather the result of inadequate safety management. Therefore, control and improvement of the safety performance should not be attempted in the area of technological improvements of the equipment, but rather in the area of safety management. The focus and atten- tion should be to enhance the control and organization of the safety-related business processes. As mentioned earlier, the growing complexity of in- dustrial processes has led to new kind of safety-related problems. These problems concern the management and control of the safety-related processes. Based on hazard investigation reports it appears that the basis of these accidents is very often the result of problems with com- munication and information exchange [15,16]. In other words, it can be said that the accidents occur due to the lack of adequacy of the safety framework used or im- proper sequence of steps evolved and safety actions taken. It can also be concluded from these studies that the safety framework used in the facilities, where acci- dents took place, was lacking proper verification of the safety management plan and that there were some loop holes like improper specifications, inadequate or insuffi- cient safety measures and improper operating limits. Hence the problem which lies in front of the process industry is to have a proper framework of safety verifica- tion which will ensure that all the inadequacies of exist- ing safety related frameworks have been removed and that reliability should be the prime feature of such a framework. In order to incorporate any safety verifica- tion techniques in a system, it is required to have a proper framework. The use of the term verification is in  A. RASTOGI ET AL. 46 line with the common definition of “verification”, as answering the question “are we building the system right?” [17]. Process of verification of a new production system does not stop when production starts, but contin- ues throughout the productive stage of its lifecycle. The basic requirements for Verification set forth in the stan- dards are summarized as 1) Verification procedures should be performed and the results should be well documented in an auditable manner; 2) Verification should be performed by a team or personnel independent from the design and manufacturing team; 3) Verification should cover all steps in system design and manufactur- ing from design to final test; and 4) A Safety Verification plan should be prepared and the process of verification should be carried out on that basis [18]. Automatic and formal verification methods can guarantee that all possi- ble situations and scenarios leading to a failure are con- sidered in the analysis [19]. The proposed framework consists of a system of interrelation of various processes and has a set of prerequisites. These prerequisites must be clarified before the framework is incorporated and specifications should be noted. The specifications are used as guides in identifying the key behavior of the controlled process. The specifications are created from quality, operability, and safety issues that concern proc- ess engineers [20]. Before describing the proposed safety verification framework, IEC 61508 standards and the safety life cycle of a plant are explained, as illustrated in the following sections. 2.3. Safety Standards IEC 61508 [21] published in 2000 has been adopted by many countries as their national standard and is being updated. Two significant concepts, safety life cycle and safety integrity level (SIL) [21-23], appeared in IEC 61508. A necessary procedure of safety life cycle is SIL verification, which verifies whether the average prob- ability of failure on demand (PFDavg) of designed safety related systems (SRS) meets the required failure measure. IEC 61508 is an international standard of rules applied in industry. It is titled “Functional safety of electrical/elec- tronic/programmable electronic safety-related systems”. IEC 61508 is intended to be a basic functional safety standard applicable to all kinds of industry. It defines functional safety as: “part of the overall safety relating to the EUC (Equipment under Control) and the EUC con- trol system which depends on the correct functioning of the E/E/PE safety-related systems, other technology safety-related systems and external risk reduction facili- ties.” The first premise of the standard is that there is equipment intended to provide a Function (the EUC), there is a system which controls it, and between them they pose a risk. The control system may be integrated with the EUC as, say, a microprocessor, or remote from it. The threat is shown in Figure 2 as a “risk of misdi- rected energy”. The standard’s second premise is that “safety func- tions” are to be provided to reduce the risks posed by the EUC and its control system (see Figure 2). Safety func- tions may be provided in one or more “protection sys- tems” as well as within the control system itself. Any systems which are ‘designated to implement the required safety functions necessary to achieve a safe state for the EUC’ are classified as “safety-related” systems. It is to these that the standard applies. The standard gives guidance on good practice. It offers recommendations but does not absolve its users of re- sponsibility for safety. Recognising that safety cannot be based on retrospective proof but must be demonstrated in advance, and that there can never be perfect safety (zero risk), the recommendations are not restricted to technical affairs but include the planning, documentation and as- sessment of all activities. Thus, IEC 61508 is not a sys- tem development standard but a standard for the man- agement of safety throughout the entire life of a system (safety life cycle), from conception to decommissioning. It brings safety management to system management and, in respect of the development of safety-related systems, it brings safety engineering to software engineering. 3. Proposed Safety Verification Framework Safety analysis is a crucial part of the design and opera- tion of chemical plants. While traditional approaches have relied heavily on qualitative analysis and expert knowledge to identify hazards, some quantitative meth- odologies have recently emerged [25]. As mentioned earlier, most of the LNG plants are working without clear safety frameworks. Those of them having safety features have old and obsolete frameworks. The pro- posed Safety Verification framework is new and accept- able to both new as well as existing plants. This frame- work is superior to other frameworks as it is based on the Figure 2. Control systems and safety functions for EUC. Copyright © 2011 SciRes. OJSST  A. RASTOGI ET AL. Copyright © 2011 SciRes. OJSST 47 concept of safety limits rather than control limits. In- volvement of safety limits extends the band of operating ranges beyond control limits which means that even if the process goes beyond the control limits, it can still be operated under constant monitoring for some more time (till it is within the safety limits). Thus, this framework delays the shutdown of a process by some time. Another very essential feature of this framework is the concept of “plant specific safety requirements”. The LNG plants differ from other industrial and power plants and require a superior safety framework as they are more prone to hazardous accidents [26]. This safety framework can be considered as a dedicated LNG Plant safety Framework and employs the adequate safety measures required in the LNG plants. The proposed framework is also different from the other present frameworks. While other frameworks have strict shutdown conditions, this framework provides flexibility in the shutdown of the plant. Not every ab- normal condition requires a shutdown and this thought has been kept in mind while designing this framework. This feature provides additional flexibility to the safe operation of the LNG Plants. The use of an integrated network of DCS and other digital control techniques en- sure that every fault causing event is taken care of and that no abnormal conditions goes unmonitored. These special features give the proposed framework, clearly an upper hand. Now we should be discussing about the framework in detail. 3.1. Activity Modeling The proposed safety verification framework works with good effect in New Plants as well as in Existing Plants. In New Plants this framework is required to be incorpo- rated during the Design phase of the plant while in Ex- isting plants this framework can be incorporated by slight modification of the initial design. These changes, in the initial design, depend upon the existing level of safety in the plant and the level of safety desired. After considering these two factors the modification required in the plant design can be estimated (see Figure 3). As mentioned earlier, this framework consists of a sys- tem of interrelation of various processes and has a set of prerequisites. These prerequisites must be clarified be- fore the framework is incorporated. Some of the general process prerequisites are general plant safety require- ments, general recipe for recovery, symptoms of failure mode etc. The first process is the hazard scenario analy- sis and then, the second process is to have a safety man- Figure 3. Safety verification framework.  A. RASTOGI ET AL. Copyright © 2011 SciRes. OJSST 48 agement plan for the safe operation of LNG facility. Then keeping in view the general safety requirements of the plant, general recipe of recovery and failure of mode, we verify and the safety requirements. The third process is the verification of the safety management plan once the safety requirements are chalked out. This process of verification is to verify the complete safe operation of the plant according to the general LNG Safety Regulations and LNG Design Safety Requirements Guidelines. The complete framework and all of its processes and sub-processes are designed to work in accordance with IEC 61508. It is a generic international standard entitled to achieve safety of the system, as mentioned in section 2.3 of the paper. In order to understand the framework, it is essential to understand its processes and sub-processes which can be broadly classified as Hazard Scenario Analysis, Safety Management, and Verification (and Testing). These are described in more details in the fol- lowing sections. 3.2. Hazard Scenario Analysis Hazard Scenario Analysis is the most basic and funda- mental block of any safety related framework (see Fig- ure 4). Without proper identification of a hazard scenario, we cannot control the operation of any process in a plant. Also, without it, talking about safety or safe operation would be baseless. Unless and until the hazard scenarios are analyzed, one cannot determine the ranges in which a particular equipment or process should operate, and the ranges beyond which a particular process or equipment is uncontrollable and unsafe to operate [27]. From this dis- cussion, we can conclude that limits estimation is an in- tegral part of hazard scenario analysis and further we can conclude that hazard scenario analysis and then deter- mining the limits forms the first block of activity model- ing for any framework. In order to estimate the limits, we require the process parameters, variables and units. Process parameters such as design parameters, control parameters and safety pa- rameters are essential to be known before limit estima- tion. Variables needed to be known are the process vari- ables and control variables. Similarly, process units and functional units of a process are required. Another very important thing which should be placed at desk before calculating the limits is the historical data of the process. With this data, we come to know about the behavior of the process in past and we can make changes to our cal- culations accordingly. Also some specifications, known as Control Specifications, should be known as a process is required to operate within these specifications. With all the above things at hand, viz. the parameters, the historical data and the units, the variables and the control specifications, one determines the limits of safe operation and identifies the unsafe zones while an equipment or process is in operation. Along with the limits estimation, we are keenly interested in the propa- gation of a fault. If the propagation of a fault is closely monitored, the fault itself can be suppressed in its initial stages. Events like component failure and abnormal con- ditions also lead to fault propagation. Thus fault detec- tion, as early as possible, acts as a useful tool in analyz- ing the hazard scenario. The analysis of hazard scenario means calculating the control limits (the limits of operation within which the process is safe and controllable and is most desired to work), the safety limits (the limits beyond the control limits domain, where the process is uncontrollable but safe to operate for a short time before it can be restored back to the control limits domain) and the design limits. Also a fault id recipe is generated. These three limits together with the fault id recipe, when determined and Figure 4. Pictorial representation of hazard scenario analysis block of the framework.  A. RASTOGI ET AL. Copyright © 2011 SciRes. OJSST 49 estimated, form the input for the safety management plan, which is the second block of the framework. 3.3. Safety Management Safety Management is the second block of the frame- work (see Figure 5). This more of a plan than a block which is required to manage all the essential safety needs for any plant in general including the LNG plants. This plan deals with the procedures of establishing the safety requirements and modes of failure prevention for a plant. In order to have such a plan, the most important prereq- uisites are the safety requirements, the limits of operation and the modes of preventing failure [28]. In order to comprehend the plan, we must, at the be- ginning, be familiar with the safety requirements. These safety requirements are plant specific. For instance, an LNG plant may have a different set of safety require- ments than a nuclear power plant or a thermal power plant. To have these plant specific safety requirements we must know the general safety requirements and the recovery requirements. The general safety requirements are the requirements which are needed in the normal op- eration of a plant whereas the recovery requirements are needed, in case, when the process conditions remain no longer safe and a recovery to the safe mode is required. These are “backup requirements”, but are important from the perspective of safe operation of a plant. Then we need the limits, whose estimation we have already dis- cussed in the previous section. Operating a plant in safe mode means operating it within these predetermined lim- its, regular monitoring the process parameters and taking necessary recovery actions when needed. Next important thing needed for a safety management plan are the modes of failure prevention. Just by incor- porating the recovery requirements whenever a plant goes into the unsafe zone, does not solve the purpose. In fact, incorporating the recovery requirements should be the last step, before shut down, whereas the failure pre- vention modes must be running when the plant is oper- ating even at normal conditions. This is to ensure that a plant operates at in the safe zone and a need to incorpo- rate recovery requirements must not arrive. These in- clude complete constant monitoring of the abnormal conditions and the symptoms of component failure. Once an abnormal condition is identified, it must be indicated to the operator, who must take the necessary actions to maintain normalcy again. It is worth making note of that not all the abnormal conditions lead to system failure. So it must be identified whether an abnormal condition would lead to a system failure or not, from the past ex- periences, and take necessary corrective measures ac- cordingly. This is the most decisive step in order to pre- vent accidents in any industrial plant. As we know, the slightest of risk may lead to a hazard; therefore past ex- periences should be taken into account only if the opera- tor is surely certain. The last, but not the least, prerequisite are the safety systems which include the safety integrated systems, shutdown systems and other similar systems which are designed for the last step to be taken, in maintaining the normalcy of the plant. Once we have the above men- tioned units, we can say that the safety management plan is comprehended correctly and our plant is safe to oper- ate. 3.4. Safety Verification Verification and testing forms the third block of the pro- posed framework (Figure 6). No safety management Figure 5. Pictorial representation of the saty management block of the framework. fe  A. RASTOGI ET AL. 50 rategy is trustwo scenario of a plant we re- qu ndard operating pro- ce of tre ing of the trends es the ve to id . Detailed Safety Verification Algorithm Flowchart Algorithm for the proposed framework is st rthy unless verified. Thus a good and analyzed for detailed understand safety management plan is one which can be duly veri- fied and tested in various different situations. Thus Veri- fication and Testing can be regarded as the most impor- tant block of the framework. To properly verify a safety ire certain tools, guidelines and trends of performance (of the process/equipment or parameters). Tools are the techniques used for proper verification. These can be the verification and troubleshooting methods, tools for test- ing the time domain and frequency domain response of a particular process or a group of processes, as desired, tools for testing the stability using known methods like bode plot, nyquisyt plot, etc., using MATLAB and tools for testing input output signals. The tools can be operated on various platforms like MATLAB, SIMULINK, MA- PLE SIM, etc. for testing purposes. We also need to verify some sta dures and safe operating conditions. For these we need a set of guidelines which can be corporate control guide- lines or those of the process design knowledge base. Certain charts and diagrams like the P&ID and process diagrams, FBD (functional block diagram) and control charts are also helpful during the verification phase. Another important necessity is the availability nds for various parameters and process variables. These are the behavior of the parameters with respect to time in a certain given conditions. These can be plotted which they follow. It is an important aspect of safety verification as these provide the inside knowledge of the things happening in a process. Analyzing the market trends is also a good practice during verification. Thus to summarize, the verification block includ rification of safety measures and makes sure that the readings obtained after the verification of safety proce- dures are valid as per the standards set by the industry. There are many regulations, requirements, guidelines and specifications which must be verified before deeming any plant safe. The most common ones which must al- ways be verified are General LNG Safety Regulations, LNG Design Safety Regulations, Corporate Control Guidelines, IEC 61508 Guidelines, IEC 61511 Guide- lines, ISAS84.01 Guidelines and others. The verification code is generated at the end of the verification phase. Once we have studied the framework, we need entify a hazard scenario for proper case study and mapping of the hazard scenario to the safety and verifi- cation framework proposed above. We need to obtain data so that we can study trends occurring during our case study. The next section deals with the case study, results and discussions (see Figure 7). 4 A Figure 6. Pictorial representation of the verification and testing block of the framework. Copyright © 2011 SciRes. OJSST  A. RASTOGI ET AL.51 Figure 7. Flow of process as per the safety verificatio own below (Figures 8 and 9): . Solution Implementation .1. Case Study order to illustrate the proposed idea, a case study is io in which there wn by the red bo leading to a haz- d is High Flow in the tank (Figure 12). If the Safety Sa the magnitude of risk which will lead an onset of n framework. sh 5 5 In proposed using experimental plant called G-Plant, which was developed in IGPS group in Okayama University as part of industrial collaboration project in Okayama, Ja- pan [29]. G-Plant is an experimental plant that consists of two stainless steel tanks, one with heaters to increase the temperature of the water to a predefined set point. DCS Centum CS3000 from Yokogawa is installed [30]. The P & ID of the constructed experimental plant is shown in Figure 10. Cold water is circulated from the tank TANK-2 to the heat exchanger HEX1 and then back to the tank TANK-2. Similarly, hot water is circulated from tank TANK-3 to heat exchanger HEX1 and then back to tank TANK-3. Hot water is used to heat cold water in tank TANK-2 where temperature increase is monitored in real time basis within DCS. Similarly, other process variables (sensors) are monitored within DCS for process control and safety. Flow rate of the cold water circulation is controlled using control valve CV3. Heat exchanger level is monitored to avoid overflow. Levels in TANK-1 and TANK-2 are monitored to avoid over- flow. Temperature in TANK-2 is controlled to avoid overheating. Alarms are defined for all critical set points in G-Plant. For example, alarm is generated when tem- perature in TANK-2 exceeds a predefined set point. The experimental plant is used to simulate and diagnose process faults. For example and in order to simulate leak in heat exchanger HEX1, downstream valve is slightly opened during the circulation of cold water. Readings are obtained for four process variables: TC1 (temperature in the cold water circulation loop), TC2 (temperature in the inlet of hot water), TK2 (temperature in tank TANK-2) and TK3 (temperature in tank TANK-3). is a high flow of liquid in the TANK-2 (sho For Hazard Analysis we take a scenar ld lines in the P&ID) which eventually leads to over- flow. This high flow of fluid may cause vibrations in the tank and also offer some blockage to the outflow of the fluid. A detailed cause-effect study and the propagation of fault leading to a hazard, is shown in the Figure 11. Primary causes, such as high/low temperature, high/low flow, overflow, impurities, etc. lead to the initiation of the hazard. They have a Low Qualitative Hazard Magni- tude (QHM) as the probability of their occurring in any process is high and the probabilistic risk associated with them is quite low. Though the QHM associated with them is low, they cannot be neglected as they lead to the initiation of a hazard. Strong monitoring is needed and proper action (implementation of safety measures) should be taken depending upon the behaviour of these parameters. Primary causes lead to primary events, which may be vibrations in the tank or blockage due to uneven flow in this case. These primary events form the secondary causes of the fault propagation. These secon- dary causes have a medium QHM and a high probabilis- tic risk associated with them. These secondary causes lead to secondary events or tertiary causes, which may be corrosion of the tank material. Tertiary causes lead to tertiary events (or quaternary/fourth degree causes) like leak or reduced mechanical strength. The fourth degree causes the most dangerous ones with an extremely high QHM and a very large probabilistic risk associated with them. These eventually lead to hazard which may be fire, intoxication of air or explosion in this case. Thus we should implement appropriate safety measures at each level of fault propagation (Figure 12). 5.2. Quantitative Hazard Analysis Let us assume that that initializing event ar Measure-1 employed to check the flow rate of the tank fails, this high flow will lead to Vibrations and/or Block- age. Again if Safety Measure-2 fails to perform its task, these Vibrations and Blockage may cause Corrosion. And if Safety Measure-3 also fails, this Corrosion may lead to Leak or Reduced Mechanical Strength which may lead to fire, intoxication or even explosion of the tank. This is how a fault propagates and ultimately leads to a hazard. Risk associated with Safety Measure is directly related to the Probability of Failure on Demand (PFD) of that fety Measure. Now our aim is to find out whether our system is safe or not. For this we will take individual fault propagation events into consideration and calculate the total risk associated. This “total risk associated” is Copyright © 2011 SciRes. OJSST 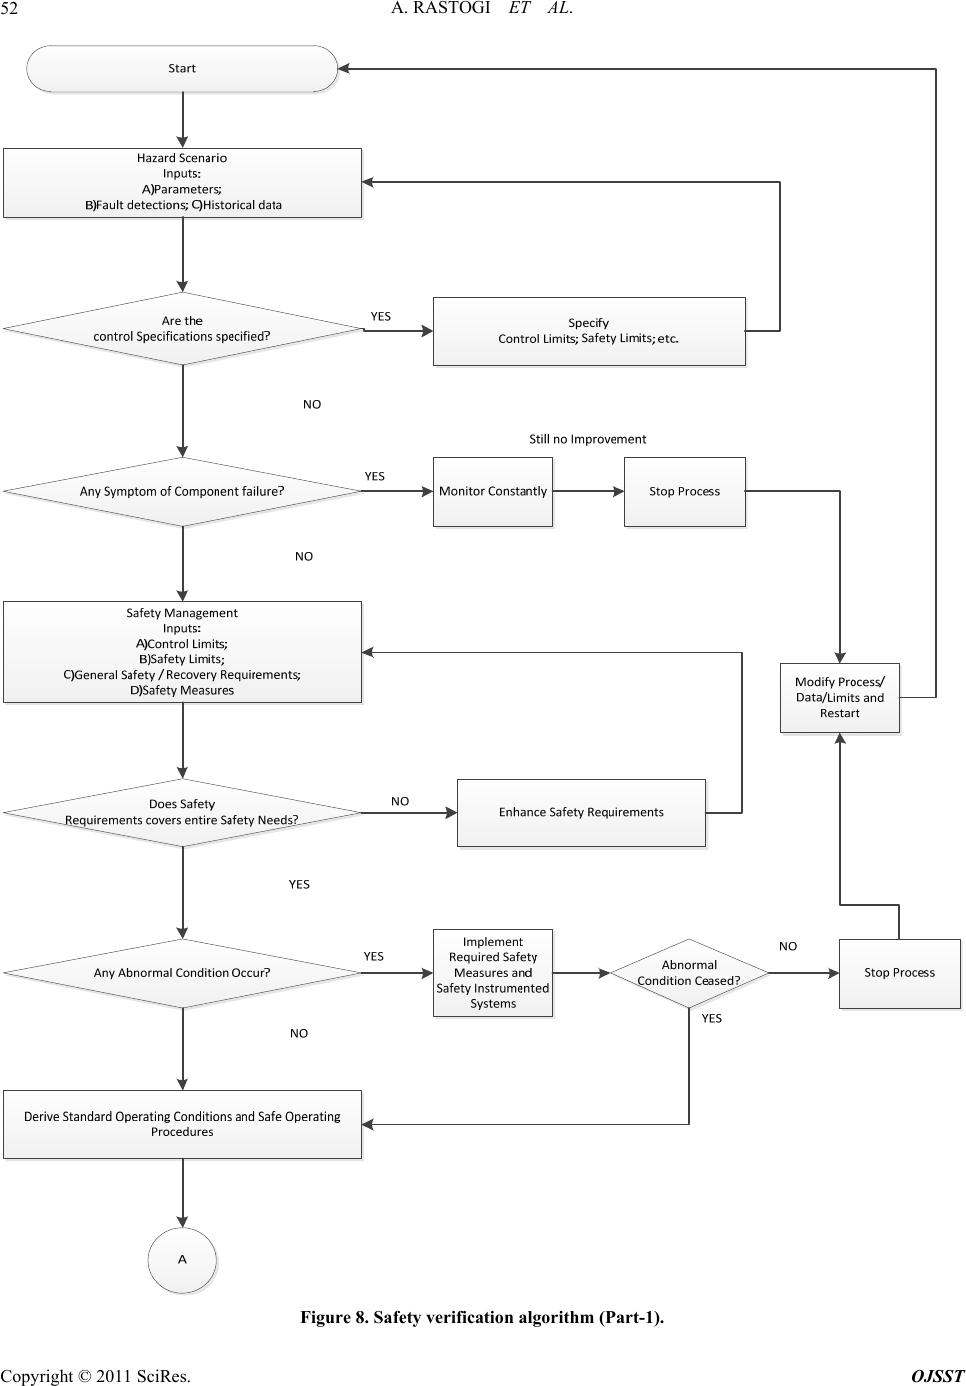 A. RASTOGI ET AL. 52 Figure 8. Safety verification algorithm (Part-1). Copyright © 2011 SciRes. OJSST  A. RASTOGI ET AL.53 Figure 9. Safety verification algorithm (Part-2). a fault to the hazard. 5.3. Analysis of Individual Fault Propagation Events Let us assume that the magnitude of failure be a constant. This magnitude of failure is actually given by the com- pany based on the historical data of accidents and the consequences occurred per event. We are assuming it to be a constant because it is a number which can be later substituted to get more correct information. Thus assum- ing magnitude of failure to be a constant, we can now Copyright © 2011 SciRes. OJSST 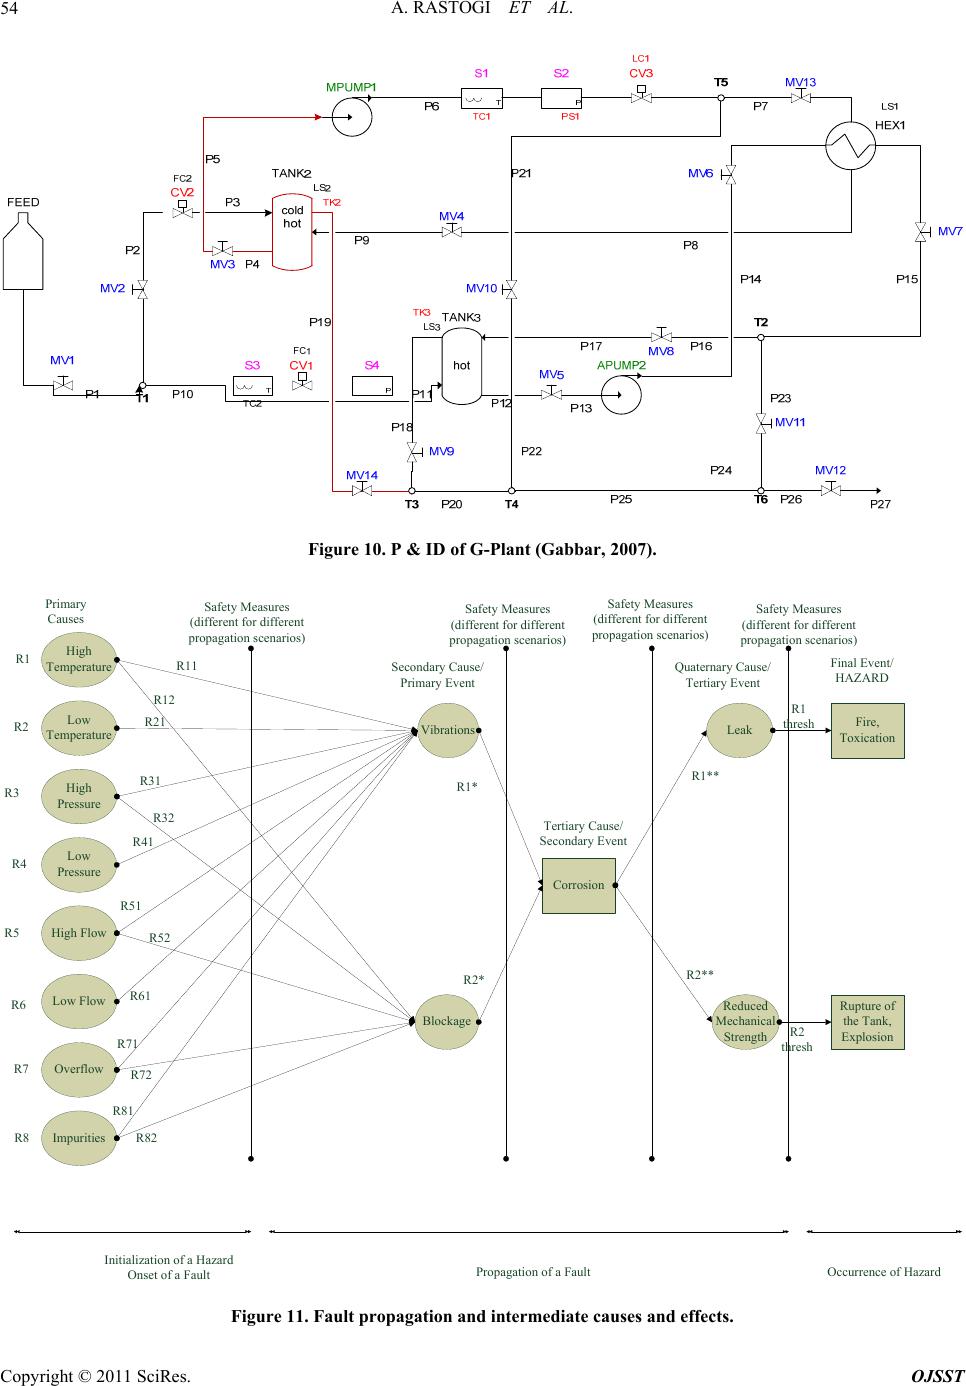 A. RASTOGI ET AL. 54 Figure 10. P & ID of G-Plant (Gabbar, 2007). Vibrations Blockage Corrosion Leak High Temperature High Pressure Reduced Mechanical Strength Low Temperature Low Pressure High Flow Fire, Toxication Rupture of the Tank, Explosio n Low Flow Overflow Impurities Primary Causes Safety Measures (different for different propagation scenarios) Secondary Cause/ Primary Event Safety Measures (different for different propagation scenarios) Tertiary Cause/ Secondary Event Quaternary Cause/ Tertiary Event Final Event/ HAZARD Initialization of a Hazard Onset of a FaultProp R1 R2 R3 R4 R5 R6 R7 R8 R11 R12 R21 R31 R32 R41 R51 R52 R61 R71 R72 R81 R82 R1* R2* R1** R2** R1 thresh R2 thresh Safety Measures (different for different propagation scenarios) Safety Measures (different for different propagation scenarios) Figure 11. Fault propagation and in agation of a FaultOccurrence of Hazard termediate causes and effects. Copyright © 2011 SciRes. OJSST 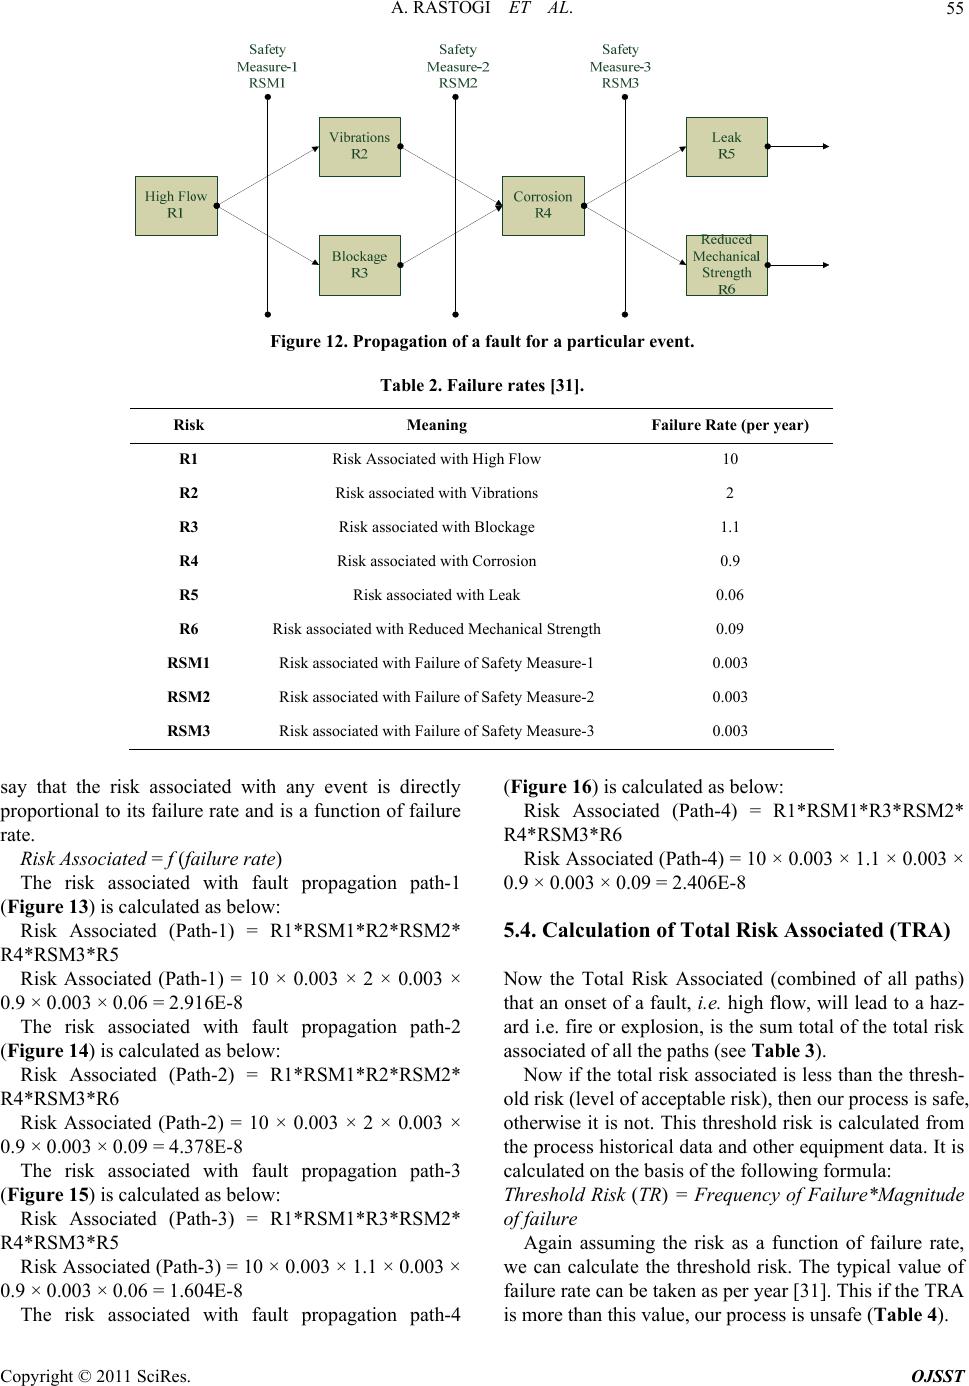 A. RASTOGI ET AL.55 Figure 12. Propagation of a fault for a particular event. Table 2. Failure rates [31]. Risk Meaning Failure Rate (per year) R1 Risk Associated with High Flow 10 R2 Risk associated with Vibrations 2 R3 Risk associated with Blockage 1.1 R4 Risk associated with Corrosion 0.9 R5 0.06 R6 Risk associated with Reduced Mechanical Strength 0.09 RSM1 Risk associated with Failure of Safety Measure-1 0.003 RSM2 Risk associated with Failure of Safety Measure-2 0.003 RSM3 Risk associated with Failure of Safety Measure-3 0.003 Risk associated with Leak say that the risk associated with any event is directly proportional to its failure rate and is a function of failure rate. Risk Associated = f (failure rate) The risk associated with fault propagation path-1 (Figure 13) is calculated as below: Risk Associated (Path-1) = R1*RSM1*R2*RSM2* R4*RSM3*R5 Risk Associated (Path-1) = 10 × 0.003 × 2 × 0.003 × 0.9 × 0.003 × 0.06 = 2.916E-8 The risk associated with fault propagation path-2 (Figure 14) is calculated as below: Risk Associated (Path-2) = R1*RSM1*R2*RSM2* R4*RSM3*R6 Risk Associated (Path-2) = 10 × 0.003 × 2 × 0.003 × 0.9 × 0.003 × 0.09 = 4.378E-8 The risk associated with fault propagation path-3 (Figure 15) is calculated as below: Risk Associated (Path-3) = R1*RSM1*R3*RSM2* R4*RSM3*R5 Risk Associated (Path-3) = 10 × 0.003 × 1.1 × 0.003 × 0.9 × 0.003 × 0.06 = 1.604E-8 The risk associated with fault propagation path-4 (Figure 16) is calculated as below: Risk Associated (Path-4) = R1*RSM1*R3*RSM2* R4*RSM3*R6 Risk Associated (Path-4) = 10 × 0.003 × 1.1 × 0.003 × 0.9 × 0.003 × 0.09 = 2.406E-8 5.4. Calculation of Total Risk Associated (TRA) Now the Total Risk Associated (combined of all paths) that an onset of a fault, i.e. high flow, will lead to a haz- ard i.e. fire or explosion, is the sum total of the total risk associated of all the paths (see Table 3). Now if the total risk associated is less than the thresh- old risk (level of acceptable risk), then our process is safe, otherwise it is not. This threshold risk is calculated from the process historical data and other equipment data. It is calculated on the basis of the following formula: Threshold Risk (TR) = Frequency of Failure*Magnitude of failure Again assuming the risk as a function of failure rate, we can calculate the threshold risk. The typical value of failure rate can be taken as per year [31]. This if the TRA is more than this value, our process is unsafe (Table 4). Copyright © 2011 SciRes. OJSST 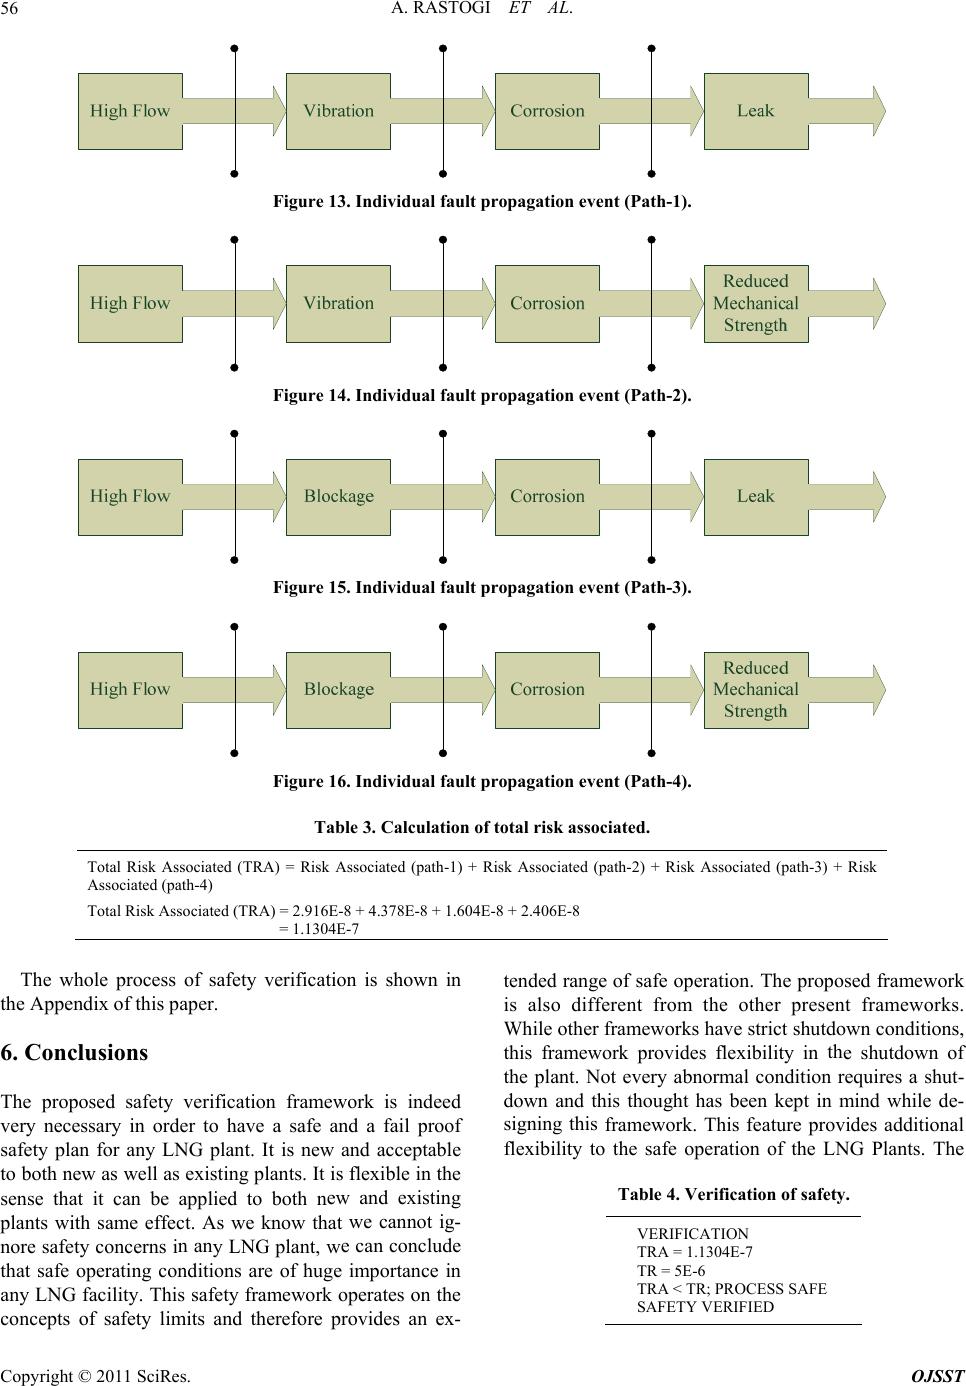 A. RASTOGI ET AL. 56 Figure 13. Individual fault propagation event (Path-1). Figure 14. Individual fault propagation event (Path-2). Figure 15. Individual fault propagation event (Path-3). Figure 16. Individual fault propagation event (Path-4). Table 3. Calculation of total risk associated. Total Risk Associated (TRA) = Risk Associated (path-1) + Risk Associated (path-2) + Risk Associated (path-3) + Risk Associated (path-4) Total Risk Associated (TRA) = 2.916E-8 + 4.378E-8 + 1.604E-8 + 2.406E-8 = 1.1304E-7 The whole process of safety verification is shown in the Appendix of this paper. 6. Conclusions he proposed safety verification framework is indeed very necessary in order to have a safe and a safety plan for any LNG plant. It is new and acceptable to both new as well ating plants. It is flexibl sense that it can be applied to both n plants with same effect. As we know that nore safety concerns iy LNG plant, w that safe operating coions are of hug any LNG facility. This safety framework concepts of safety limd therefore p tended range of safe operation. The proposed framework is also different from the other present frameworks. While other frameworks have strict shutdown conditions, this framework provides flexibility in e shutdown of rmal condition requires a shut- been kept in mind while de- framework. This feature provides additional flexibility to the safe operation of the LNG Plants. The Table 4. Verification of safety. VERIFICATION TRA = 1.1304E-7 TR = 5E-6 TRA < TR; PRESS SAFE SAFETY VIED T fail proof signing this s exise in the ew and existing we cannot ig- e can conclude n an ndite importance in operates on the rovides an ex-its an th the plant. Not every abno down and this thought has OC ERIF Copyright © 2011 SciRes. OJSST  A. RASTOGI ET AL.57 use of an integrated ork of DCS and control techniques ensuat ev is taken care of and no ab unmonitored. These featu framework, clearly er hand said that this safety fram work can dedicated Process I Safety loys the adequate safety measures required in the LNG [1] 3, Supplement 1, 1999, pp. ork for Safety Control ol. 240, No. 10, 2010, pp. 3550-3558. netw other digital re th that ery fault causing event normal conditions goes specialres give the proposed an upp e . At the last, it can be be considered as a ndustry Framework and em- p plants. 7. References R. Ali, “Safety Life Cycle—Implementation Benefits and Impact on Field Devices,” ISA-Expo 2005, Chicago, 25-27 October 2005. [2] G. Holger and S. T. Henner, “Process Hazard Identification during Plant Design by Qualitative Modelling, Simulation and Analysis,” European Symposium on Computer Aided Process Engineering, Vol. 2 S59-S62. [3] H. A. Gabbar, “Integrated Framew Design of Nuclear Power Plants,” Nuclear Engineering and Design, V doi:10.1016/j.nucengdes.2010.07.024 [4] IEC 61508, Functional Safety of Electrical/Electronic/ f IEC 61508 and IEC 61511 d. [8] B. Knegtering, “Safety Lifecycle Management,” Automa- tion in Petro Chemicals Industry Conference, University of Ontario Institute of Technology, 2000 Simcoe St. N, Oshawa, Canada. [9] F. P. Lees, “Loss prevention in the process industries,” 2nd, Edition, Butterworth-Heinemann, Oxford, 1996. [10] B. Knegtering, “Application of Quantitative Safety Assessment to Determine Safety In- tegrity Levels,” ISA-Expo, Houston, 19-23 October 1998. [11] B. Knegtering and A. C. Brombacher, “A Method to Pre- vent Excessive Numbers of Markov States in Markov Models for Quantitative Safety and Reliability,” ISA-Transactions, Vol. 39, No. 3, 2000, pp. 363-369. doi:10.1016/S0019-0578(99)00041-5 Programmable Electronic Safety-Related Systems, 1998/ 2000. [5] IEC 61511, Functional Safety: Safety-Instrumented Sys- tems for the Process Industry Sector, Draft version 1999. [6] ANSI/ISA S84.01, Research Triangle Park, 1996. [7] B. Knegtering, “The Impact o on Dutch Industry Epigram,” Official Journal of Core In- terest User, Group of Programmable Electronic Systems, London, Autumn 2000, unpublishe Micro Markov Models for [12] Health and Safety Executive, plant,” Clause 6.2 of Contract R UK, 1997. [13] Bradley, “The Reliability Challenge,” Presentation hand- outs Conference, London, 1999. [14] Health and Safety Executive, “Out of Control HSE Books,” United Kingdom 1995. [15] B. Felton, “Safety study IDs Leading Causes of Acci- dents,” InTech, Morn Hill, 2001, p. 77. “Chemical Ant Risks in US Industry―A ary Analysis ocident Risk Data,” US Haz- hemical Facilities EPA, September 2000. . Everdij, H. Blom, J. J. Scholte, J. W. and B. Kraanveloping a Framework for alidation of Multi-Stakeholder Changes in Air Transport Operations,” Safety Science, Vol. 47, No. 3, 2009, pp. 405-420. T. Yokomura, “A Verification and Valida- lants,” Nuclear Engineering and Design, Vol. 183, No. 1-2, 1998, pp. 117-132. cation of Safety Interlock Systems for Industrial Proc- “Explosions in gas-fired esearch Report 139/1997, [16] J. Belke, Prelimin ccide f Ac ardous C [17] M. H. C Nollet A. P. , “De Safety V [18] A. Fukumoto, T. Hayashi, H. Nishikawa, H. Sakamoto, T. Tomizawa and tion Method and Its Application to Digital Safety Systems in ABWR Nuclear Power P [19] S. H. Yang, L. S. Tan and C. H. He, “Automatic Verifi- esses,” Journal of Loss Prevention in the Process Indus- tries, Vol. 14, No. 5, 2001, pp. 379-386. doi:10.1016/S0950-4230(01)00014-6 [20] S. Brown, “Overview of IEC 61508: Functional Safety of Electrical/Electronic/Programmable Electronic Safety-Re- lated Systems,” Computing and Cont rol Engineering Jour- nal, Vol. 11, 2000, p. 11. [21] P. Stavrianidis and K. Bhimavarapu, “Performance-Based Standards: Safety Instrumented Functions and Safety In- tegrity Levels,” Journal of Hazardous Materials, Vol. 71, 61508, Functional Safety of Electrical/Electro- 61508,” Journal of the System Safety Society, Vol. 35, No. 1, 1999, pp. 21-25. [24] C. S. Adjiman, “Safety Verification in Chemical Plants: A New Quantitative Approach,” Computers & Chemical Engineering, Vo. 23, Supplement 1, 1999, pp. S581-S584. doi:10.1016/S0098-1354(99)80143-4 No. 1-3, 2000, pp. 449-465. [22] IEC nic/Programmable Electronic Safety-Related Systems, International Electro Technical Commission, Reference: IEC 61508-3 ed 2.0. 23] F. Redmill, “An Introduction to the Safety Standard IEC[ [25] H. A. Gabbar and P. Sauer, “Knowledgebase and Acqui- sition System for Failure and Accident Analy of Gas ,” International Workshoon Real ntation & Control, Oshawa, 25-26 June, 2010. [26] H. A. Gabbar and R. Bedard, “Hazard Analysis and Ac- cident Prediction for LNG Plants,” International Work- shop on Real Time Measurement, Instrumentation & Control, Oshawa, 25-26 June, 2010. [27] Y. Shimada and T. Kitajima, “Framework for Safety- Management Activity to Realize OSHA/PSM,” Interna- eal Time Measure ment, Inst ru menta- a, 25-26 June, 2010. [28] H. A. Gabbar, H. E. Sayed, A. S. Osunleke and H. Ma- sanobu, “Analytical Process and System Design of Inte- grated Fault Diagnostic System,” International Journal of Process Systems Engineering, Vol. 1, No. 1, 2009, pp. 66-81. [29] E. Nasimi and H. A. Gabbar, “Development of Support sis p Processing Facilities Time Measurement, Instrume tional Workshop on R tion & Control, Oshaw Copyright © 2011 SciRes. OJSST  A. RASTOGI ET AL. Copyright © 2011 SciRes. OJSST 58 Tool for Control Design of Nuclear Power Plant Using Hierarchical Control Chart (HCC),” Journal of Process Systems Engineering, Vol. 1, No. 2, 2010, pp. 150-168. [30] H. A. Gabbar, H. E. Sayed, A. S. Osunleke and H. Ma- sanobu, “Design of Fault Simulator,” Journal of Reliabil- ity Engineering and System Safety, Vol. 94, No. 8, 2009, pp. 1289-1298. doi:10.1016/j.ress.2009.01.006 [31] A. Blanchard, “Savannah River Site Generic Data Base Development,” Westinghouse Savannah River Company, Aiken, NTIS Order No. 29808.  A. RASTOGI ET AL.59 named as G1, G2, G3 and study chosen and shown Appendix Steps to follow to implement the Proposed Framework Each Block of the proposed framework has been broken down into various sub blocks G4 where G1 is the hazard scenario analysis block, G2 is the safety management block and G3 is the verification and testing block. Each block of the proposed framework is mapped according to the case below. START TAKE ONE PROCESS Initiation of a fault: HIGH INFLOW IN TANK-2 G1: HAZARD SCENARIO ANALYSIS 1) Input Parameters (TK3, LS3, TK2, TC1, PS1, LC1, FLOW RATE IN, F 2) Detect for any initial faults. 3) Obtain Data for TC1, TC2, TK2, and TK3, as shown above in Tab eck whether the CONTROL SPECIFICAT LOW RATE OUT). 2 and Figures 8-10. y are not, SPECIFY them using TOOLS like CONTOL CHATRS, HIS- le ymptoms of component failure, constantly MONITOR t 4) ChIONS are specified. If the TORICAL DATA and TRENDS. ELSE PROCEED. 5) Check for any SYMPTOMS OF COMPONENT FAILURE like high If there are any s /low temperatures, high/low flow of fluid, overflow of fluid, impurities, etc. hem and apply corresponding SAFETY MEASURES. If still the condi- tions prevail, STOP the process. ELSE PROCEED. G2: SAFETY MANAGEMENT 1) Using Trend Data above specify CONTROL LIMITS and SAFETY L the Lower Control Limit (LCL) for the first 200 seconds should be 51 for the next 200 seconds, the UCL and IMITS. For example: in case of TK3, the Upper Control Limit (UCL) and LCL should be 50. OVERY REQUIRE eding i ˚C and 46˚C respectively as seen from the data chart and graph. Similarly 5˚C and 48.5˚C respectively. Similar calculations can be made to calculate Upper MENTS and adequate SAFETY MEASURES. These are a set of rules which and LCL. Safety Limits (USL) and Lower Safety Limits (LSL). 2) Similarly specify the GENERAL SAFETY/REC must be employed in the event of temperature TK3 exceeding its UCL 3) Check whether the Safety Requirements cover the entire safety needs SAFETY REQUIREMENTS with SAFETY MEASURES. ELSE PR 4) Check for any ABNORMAL CONDITIONS like TK3 exce . If they do not, ENHANCE SAFETY REQUIREMENTS by MATCHING OCEED. ts usual value or TC2 dropping down to any unusual value, etc. If there are, sts, STOP the process. ELSE PROCEED. APPLY CORRESPONDING SAFETY MEASURES and if they persi G3: VERIFICATION 1) Check whether CONTROL GUIDELINES are verified. If they are no they are verified. ELSE PROCEED. 2) Check whether CONTRO t, MODIFY PROCESS SAFETY by applying SAFETY MEASURES till hat whether UCL and LCL obtained in the actual process are in accordance OL PARAMETERS by taking TREND DATA and using TOOLS like AB, etc. ELSE PROCEED L CHARTS are verified. By this we mean t . ED. If the . so as to match Corpor FIED. If they are not, CHARTS with desired values. If they are not, MODIFY PROCESS CONTR PFD/PBD, CONTROL CHARTS and STABILITY TOOLS in MATL 3) Check whether TRENDS obtained are in accordance with desired tren in accordance with the desired trends. 4) VERIFY SAFETY STATUS using QUANTITATIVE HAZARD ANA 5) Check whether General LNG Safety Regulations are VERIFI ds. This is again the verification of the trends obtained so as to match them LYSIS METHOD. y are not, MODIFY PROCESS using TOOLS like PFD/PBD, CONTROL General LNG Safety Regulations. ELSE PROCEED. CHARTS and STABILITY TOOLS in MATLAB, etc. so as to match 6) Check whether LNG Design Safety Requirements are VERIFIED. TROL CHARTS and STABILITY TOOLS in MATLAB, etc. so as to 7) Check whether Corporate Control Guidelines are VERIFIED. If the CHARTS and STABILITY TOOLS in MATLAB, etc 8) Check whether IEC 61508 Guidelines are VERI If they are not, MODIFY PROCESS using TOOLS like PFD/PBD, CON- match LNG Design Safety Requirements. ELSE PROCEED. y are not, MODIFY PROCESS using TOOLS like PFD/PBD, CONTROL ate Control Guidelines. ELSE PROCEED. MODIFY PROCESS using TOOLS like PFD/PBD, CONTROL and STABILITY TOOLS in MATLAB, etc. so as to match IEC 61508 9) VERIFICATION phase COMPLETED. Develop a VERIFICATION C Guidelines. ELSE PROCEED. ODE. PROCESS VERIFIED.TAKE ANOTHER PROCESS AND APPLY THE FRAMEWORK TILL THE WHOLE PLANT WITH ALL ITS PROC- ESSES, SUB-PROCESSES AND EQUIPMENTS ARE SAFELY MANAGED AND VERIFIED. Copyright © 2011 SciRes. OJSST |