 Journal of Environmental Protection, 2011, 2, 982-995 doi:10.4236/jep.2011.27113 Published Online September 2011 (http://www.SciRP.org/journal/jep) Copyright © 2011 SciRes. JEP Downstream Changes on a Tropical Fish Community Structure by Effluent from Wood Processing Factory Benedict Obeten Offem*, Irom Bassey, Gabriel Ujong Ikpi Department of Fisheries and Aquatic Sciences, Cross River University of Technology, Cross River State, Nigeria. Email: *benbeff06@yahoo.com Received June 1st, 2011; revised July 6th, 2011; accepted August 5th, 2011. ABSTRACT In order to plan a management programme for ensuring maximum production of fish in Cross River, impacted down- stream changes in the fish community structure by effluents from wood processing industry, six years after establish- ment, was examined. Monthly samples were collected between January and December each year from 2000 to 2006 in three reaches (Upriver: I, Mid-river: II and Downriver: III) along the length of Cross River. Representatives of the fish families Osteoglossidae (i.e. Heterotis niloticus), Cichlida e (Tilapia melonopleura) and Characidae (Bryocinus nurse), Clupeidae (Cynothrissa sp), Mormyridae (Mormyrus deliciosus), Clariidae (Clarias gariepinus), Bagridae (Bagrus bayad) and Cyprinidae (Barbus occidentalis) were found to have declin ed in their impo rta n ce co mpa red to p re-indu stry period. On the other hand, Bagridae (Chrysichthys nigrodigitatus), Cichlidaae (Orechromis niloticus), Claridae (Clarias anguillaris) and Mochokidae (Synodontis clarias) have currently emerged as most important. Estimated value of growth co efficient (b) of the length-weight relationship changed from isometry (b approx. = 3) to negative allometry (b ≤ 3), condition factor values decreased from range between 0.53 and 1.30 to range between 0.22 and 0.62. Main feeding groups of fish ; planktivores, carnivores and insectivores declined in numbers while omnivores and detritivores increased, resulting in dominance of benthic and semi-pelagic omnivores. Values of fecundity distribution varied from 56,012 ± 5234 eggs, mode 12,500 and median 58,345 to m ean val u e 23,122 ± 232 eggs, mode 2500 and median 20,349, egg size from mean valu e; 1.82 ± 0.07 mm, mode 2.2, and median; 1.8 to va lues of 0.8 ± 0.04 mm, mode; 1.3 and me- dian 1.1 and Gonadosoma tic inde x from 20.5 ± 3.2, mode 19.1 ± 2.2 and median 21.4 to values o f 12.4 ± 2.3, mod e 4.5 and median 9.5 respectively. Three species found to have appeared in the river were Tilapia monody, Chrysichthys maurus and Synodontis violaceus. The appearance of these species and disappearance of 36 others indicates the re- structuring of the fish community of the Cross River by effluents from the wood processing industry. Keywords: Fish Community, Fish Composition and Abundance, Diet Changes, Len gth-Weight Relationship, Reproductive Biology 1. Introduction In Africa, a large proportion of both rural and urban populations live in vicinity of inland or coastal waters. Examples are Cairo on River Nile, Khartoun at Conflu- ence of blue and white nile, Kampala (Lake Victoria), Kinshasa and Brazaville (River Zarie/Congo), Banjul (River Gambia), Niamey and Bamako (River Niger) and some national capitals located along the coast e.g Abid- jan, Dakar, Rabat, Da Es Salam and Luanda [1]. Settle- ments close to natural waters offer man’s greatest hopes for livelihood and material supplies. Egypt’s Delta Lakes supply 50% of annual fish consumption [2]. Large basins in Africa: Niger, Benue, Sokoto, Ouema, Shire, Barotse, Kafu flats, Massili & Okarango have at least 100 species each [3]. However, Potential annual yield of small sys- tems is about 2 million metric tons [4]. In some coastal cities: Zaire, Ethiopia, Keyna, Madagascar and Tazania freshwater fish are more important than marine fish and may contribute up to 90% of the total landings [4,5]. Ni- gerian inland water bodies are primarily used for fishing and the fisheries, is private sector driven and operates mainly in remote rural areas [6]. It contributes 86% of domestic fish production [7]. It is source of employment and provides income and nutrition for about 3 millions 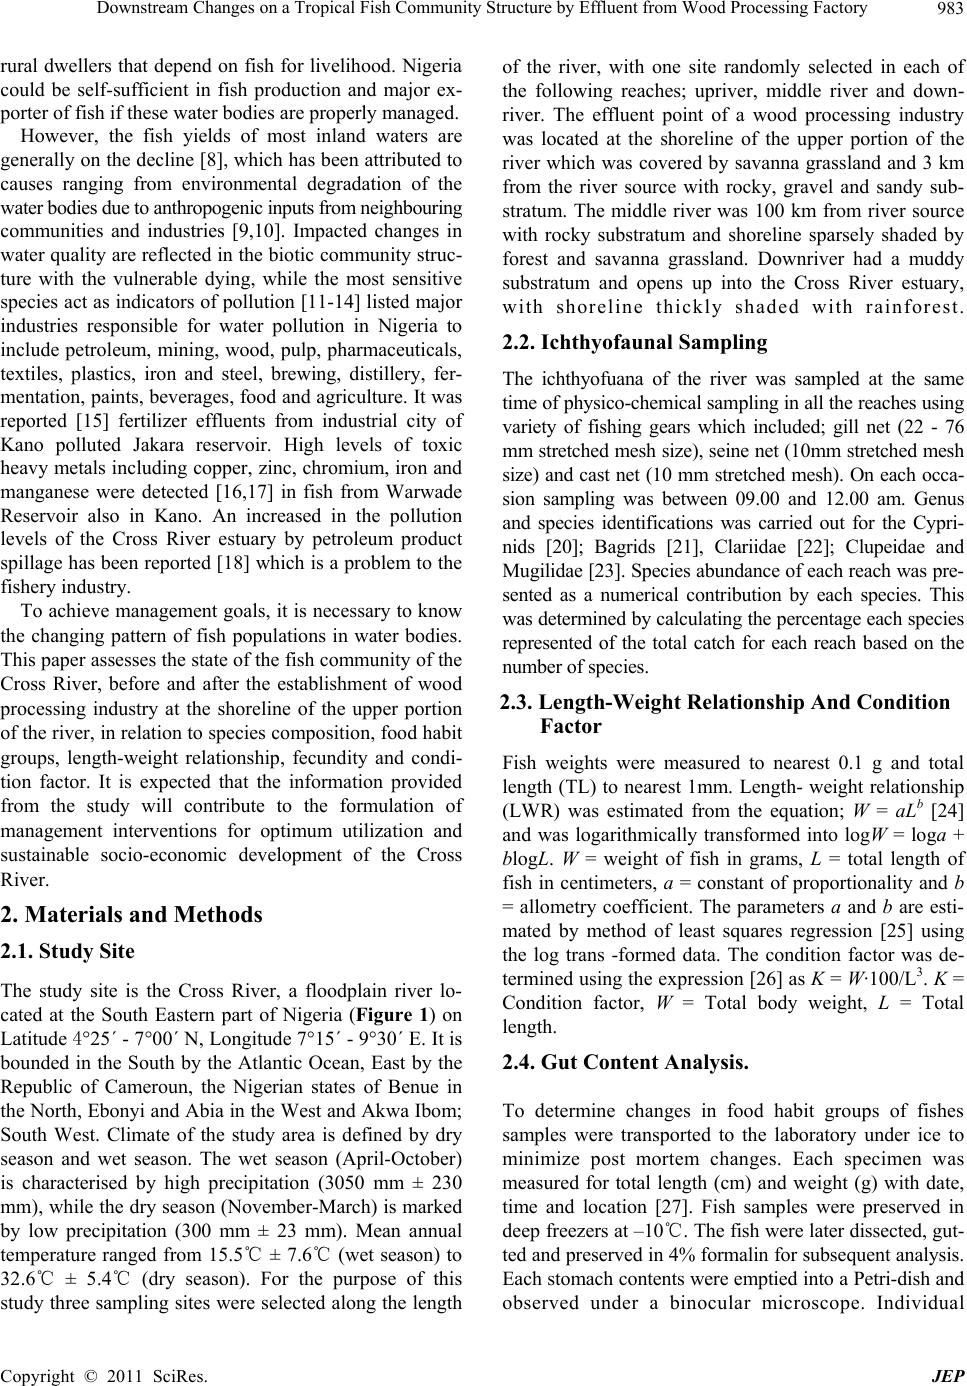 Downstream Changes on a Tropical Fish Community Structure by Effluent from Wood Processing Factory983 rural dwellers that depend on fish for livelihood. Nigeria could be self-sufficient in fish production and major ex- porter of fish if these water bodies are properly managed. However, the fish yields of most inland waters are generally on the decline [8], which has been attributed to causes ranging from environmental degradation of the water bodies due to anthropogenic inputs from neighbouring communities and industries [9,10]. Impacted changes in water quality are reflected in the biotic community struc- ture with the vulnerable dying, while the most sensitive species act as indicators of pollution [11-14] listed major industries responsible for water pollution in Nigeria to include petroleum, mining, wood, pulp, pharmaceuticals, textiles, plastics, iron and steel, brewing, distillery, fer- mentation, paints, beverages, food and agriculture. It was reported [15] fertilizer effluents from industrial city of Kano polluted Jakara reservoir. High levels of toxic heavy metals including copper, zinc, chromium, iron and manganese were detected [16,17] in fish from Warwade Reservoir also in Kano. An increased in the pollution levels of the Cross River estuary by petroleum product spillage has been reported [18] which is a problem to the fishery industry. To achieve management goals, it is necessary to know the changing pattern of fish populations in water bodies. This paper assesses the state of the fish community of the Cross River, before and after the establishment of wood processing industry at the shoreline of the upper portion of the river, in relation to species composition, food habit groups, length-weight relationship, fecundity and condi- tion factor. It is expected that the information provided from the study will contribute to the formulation of management interventions for optimum utilization and sustainable socio-economic development of the Cross River. 2. Materials and Methods 2.1. Study Site The study site is the Cross River, a floodplain river lo- cated at the South Eastern part of Nigeria (Figure 1) on Latitude 4°25´ - 7°00´ N, Longitude 7°15´ - 9°30´ E. It is bounded in the South by the Atlantic Ocean, East by the Republic of Cameroun, the Nigerian states of Benue in the North, Ebonyi and Abia in the West and Akwa Ibom; South West. Climate of the study area is defined by dry season and wet season. The wet season (April-October) is characterised by high precipitation (3050 mm ± 230 mm), while the dry season (November-March) is marked by low precipitation (300 mm ± 23 mm). Mean annual temperature ranged from 15.5℃ ± 7.6℃ (wet season) to 32.6℃ ± 5.4℃ (dry season). For the purpose of this study three sampling sites were selected along the length of the river, with one site randomly selected in each of the following reaches; upriver, middle river and down- river. The effluent point of a wood processing industry was located at the shoreline of the upper portion of the river which was covered by savanna grassland and 3 km from the river source with rocky, gravel and sandy sub- stratum. The middle river was 100 km from river source with rocky substratum and shoreline sparsely shaded by forest and savanna grassland. Downriver had a muddy substratum and opens up into the Cross River estuary, with shoreline thickly shaded with rainforest. 2.2. Ichthyofaunal Sampling The ichthyofuana of the river was sampled at the same time of physico-chemical sampling in all the reaches using variety of fishing gears which included; gill net (22 - 76 mm stretched mesh size), seine net (10mm stretched mesh size) and cast net (10 mm stretched mesh). On each occa- sion sampling was between 09.00 and 12.00 am. Genus and species identifications was carried out for the Cypri- nids [20]; Bagrids [21], Clariidae [22]; Clupeidae and Mugilidae [23]. Species abundance of each reach was pre- sented as a numerical contribution by each species. This was determined by calculating the percentage each species represented of the total catch for each reach based on the number of species. 2.3. Length-Weight Relationship And Condition Factor Fish weights were measured to nearest 0.1 g and total length (TL) to nearest 1mm. Length- weight relationship (LWR) was estimated from the equation; W = aLb [24] and was logarithmically transformed into logW = loga + blogL. W = weight of fish in grams, L = total length of fish in centimeters, a = constant of proportionality and b = allometry coefficient. The parameters a and b are esti- mated by method of least squares regression [25] using the log trans -formed data. The condition factor was de- termined using the expression [26] as K = W·100/L3. K = Condition factor, W = Total body weight, L = Total length. 2.4. Gut Content Analysis. To determine changes in food habit groups of fishes samples were transported to the laboratory under ice to minimize post mortem changes. Each specimen was measured for total length (cm) and weight (g) with date, time and location [27]. Fish samples were preserved in deep freezers at –10℃. The fish were later dissected, gut- ted and preserved in 4% formalin for subsequent analysis. Each stomach contents were emptied into a Petri-dish and observed under a binocular microscope. Individual Copyright © 2011 SciRes. JEP 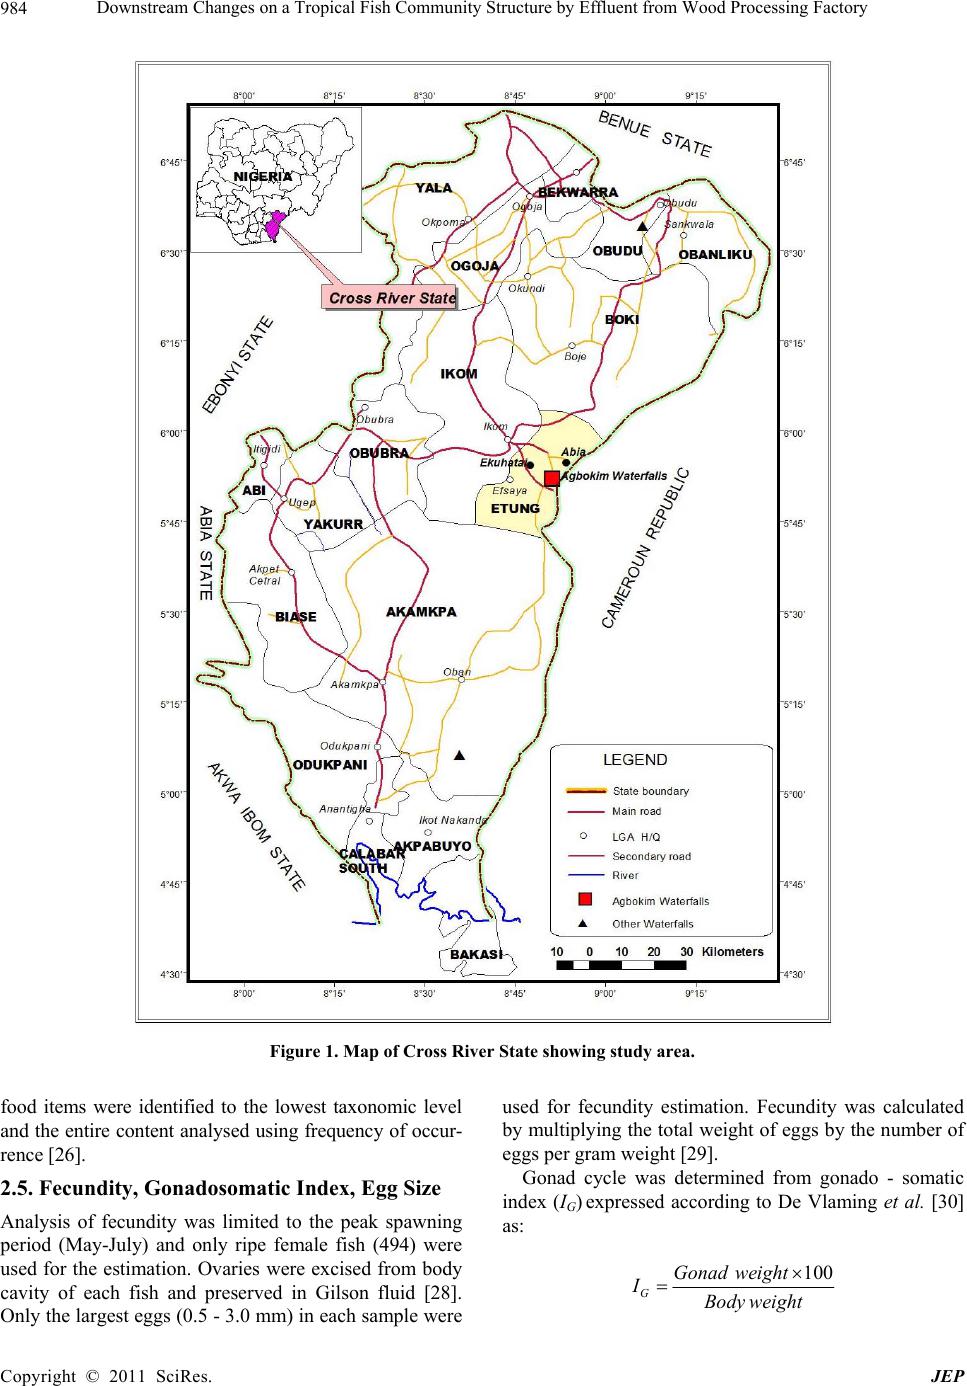 Downstream Changes on a Tropical Fish Community Structure by Effluent from Wood Processing Factory 984 Figure 1. Map of Cross River State showing study area. food items were identified to the lowest taxonomic level and the entire content analysed using frequency of occur- rence [26]. 2.5. Fecundity, Gonadosomatic Index, Egg Size Analysis of fecundity was limited to the peak spawning period (May-July) and only ripe female fish (494) were used for the estimation. Ovaries were excised from body cavity of each fish and preserved in Gilson fluid [28]. Only the largest eggs (0.5 - 3.0 mm) in each sample were used for fecundity estimation. Fecundity was calculated by multiplying the total weight of eggs by the number of eggs per gram weight [29]. Gonad cycle was determined from gonado - somatic index (IG) expressed according to De Vlaming et al. [30] as: 100 GGonadweight IBody weight Copyright © 2011 SciRes. JEP  Downstream Changes on a Tropical Fish Community Structure by Effluent from Wood Processing Factory985 IG was used to follow seasonal changes in the gonads. Egg diameter was measured from samples collected from different parts of the ovary (anterior, middle and posterior parts) using ocular micrometer mounted on a binocular microscope Imevbore [31]. 2.6. Data treatment and analysis The mean and standard deviation of each of the phys- ico-chemical parameters were calculated. Analysis of variance (ANOVA) was used to test for statistical differ- ences between the means of the physical and chemical parameters of the sampling years. Presence – absence data (quantitative scale issue) was used as a measure of com- munity composition. Based on the information obtained, fish species were qualitatively categorized as follows: Disappeared: Species not sampled in all subsequent studies after first appearance. Declined: Species that are either absent or present in relatively low numbers or observed in commercial catches but not encountered in later years. Appeared: Species not present in all pre-impoundment and post-impoundment studies except after establishment of wood processing industry. Valuable: Species present in the river and contributing at least 10% to sampled fish in terms of weight and numbers. Permanent: Species present in all pre-impoundment and post-impoundment studies conducted on the river. 3. Results 3.1. Fish Species Composition and Status Table 1 presents all fish species identified in both pre-industry (2000) and post-industry (2001-2006) estab- lishment studies undertaken on the Cross river. Important freshwater species categorised as ‘disappeared’ include Sarotherodon melanopleura, H.fasciatus, (Cichlidae); Mormyrus rume, Mormyrus tapirus, M. anguilloides, P. bovei, G. cyprinoides, G. senegalensis, H. occidentalis, M. isidori (Mormyridae); Hydrocyanus vittatus, Bricynus macrolepidotus, Bricynus chaperi (Characidae); Polyp- terus senegalensis, Polypterus endlicheri, Cala- moichthys calabaricus (Polypteridae) (Table 2). while three species namely Synodontis violaceus (Mochokidae); Chrysichthys maurus (Bagridae) and Tilapia monody (Cichlidae) appeared in the Cross River for the first time. These species are grouped as ‘appeared’ in this study. Table 1. List of species identified in Cross River during the 13 years of study. Family/species 1997 2000 2003 2006 2010 Cichlidae Oreochromis niloticus *** *** * * ** Tilapia galilaeus ** ** * * ** Tilapia mariae * * * * * Tilapia zilli ** ** * * * Tilapia monody * * Sarotherodon galilaeus ** ** * * * Sarotherodon melanopleura * * * Sarotherodon melanotheron ** * * * * Hemichromis fasciatus * * * Hemichromis bimaculatus * * * * Protopteridae Protopterus annectens ** ** * Polypteridae Polypterus senegalus * * Polypterus endlicheri * * Calamoichthys calabaricus ** ** Denticeptidae Denticeps clupeoides ** * * Copyright © 2011 SciRes. JEP  Downstream Changes on a Tropical Fish Community Structure by Effluent from Wood Processing Factory 986 Distichodontidae Distichodus rostratus * * * * * Clupeidae Cynothrissa sp ** ** * * * Pellonula vorax * ** Osteoglossidae Heterotis niloticus ** ** * * ** Mormyridae Mormyrus rume ** ** * ** Mormyrus deliciosus ** ** * * * Mormyrus tapirus * * * * Mormyrops anguilloides * * Petrocephalus bovei ** ** ** Petrocephalus. Ansorgii ** ** * * * Gnathonemus cyprinoides * * * Gnathonemus senegalensis * Hyperopisus occidentalis * * * Marcusenius isidori * * Marcusenius psittacus * Hepsetidae Hepsetus odoe * ** * Characidae Hydrocyanus vittatus * * * Bricynus nurse ** ** * * * Brycinus chaperi ** * Bricynus macrolepidotus * ** * * Clariidae Clarias anguillaris *** *** ** ** ** Clarias cameronensis ** ** ** ** ** Clarias gariepinus ** ** ** ** ** Clarias pachynema * * Clarias aboinensis * * * * * Heterobrachus longifilis ** ** * * * Heterobranchus bidorsalis * * * * * Bagridae Bagrus docmak * * * * Bagrus bayad ** ** * * * Chrysichthys auratus *** *** * * ** Chrysichthys nigrodigitatus *** *** * * ** Chrysichthys walker * * * * * Copyright © 2011 SciRes. JEP  Downstream Changes on a Tropical Fish Community Structure by Effluent from Wood Processing Factory987 Chrysichthys furcatus * * * * * Chrysichthys maurus * * * Chrysichthys filamentosus ** ** * Mochokidae Synodontis membranaceus *** ** * Synodontis omias * * * Synodontis rabbianus * * * * Synodontis nigrita * * * * * Synodontis schall *** *** ** Synodontis obesus ** ** * * * Synodontis courteti * * * Synodontis eupterus * * * Synodontis gambiensis * Synodontis ocellifer * * Synodontis velifer * * Synodontis sorex * * * Synodontis violaceus * * * Malapteruridae Malapterus electricus * * * * * Cyprinidae Barbus occidentalis ** ** * * * Barilius senegalensis * * * Barbus macrops * Barilius loati * * Labeo coubie * * * * * Labeo senegalensis * * * * * Labeo parvus * * * * * Schilbeidae Eutropius niloticus ** ** * * * Eutropius micropogon ** ** * * * Schilbe mystus ** * * * * Schilbe intermedius * * * Charanidae Parachanna obscura * * * * * Centropomidae Lates niloticus * * * * Icthyoboridae Phago loricatus * * *: Scarce, **: Common, ***: Abundant. Copyright © 2011 SciRes. JEP 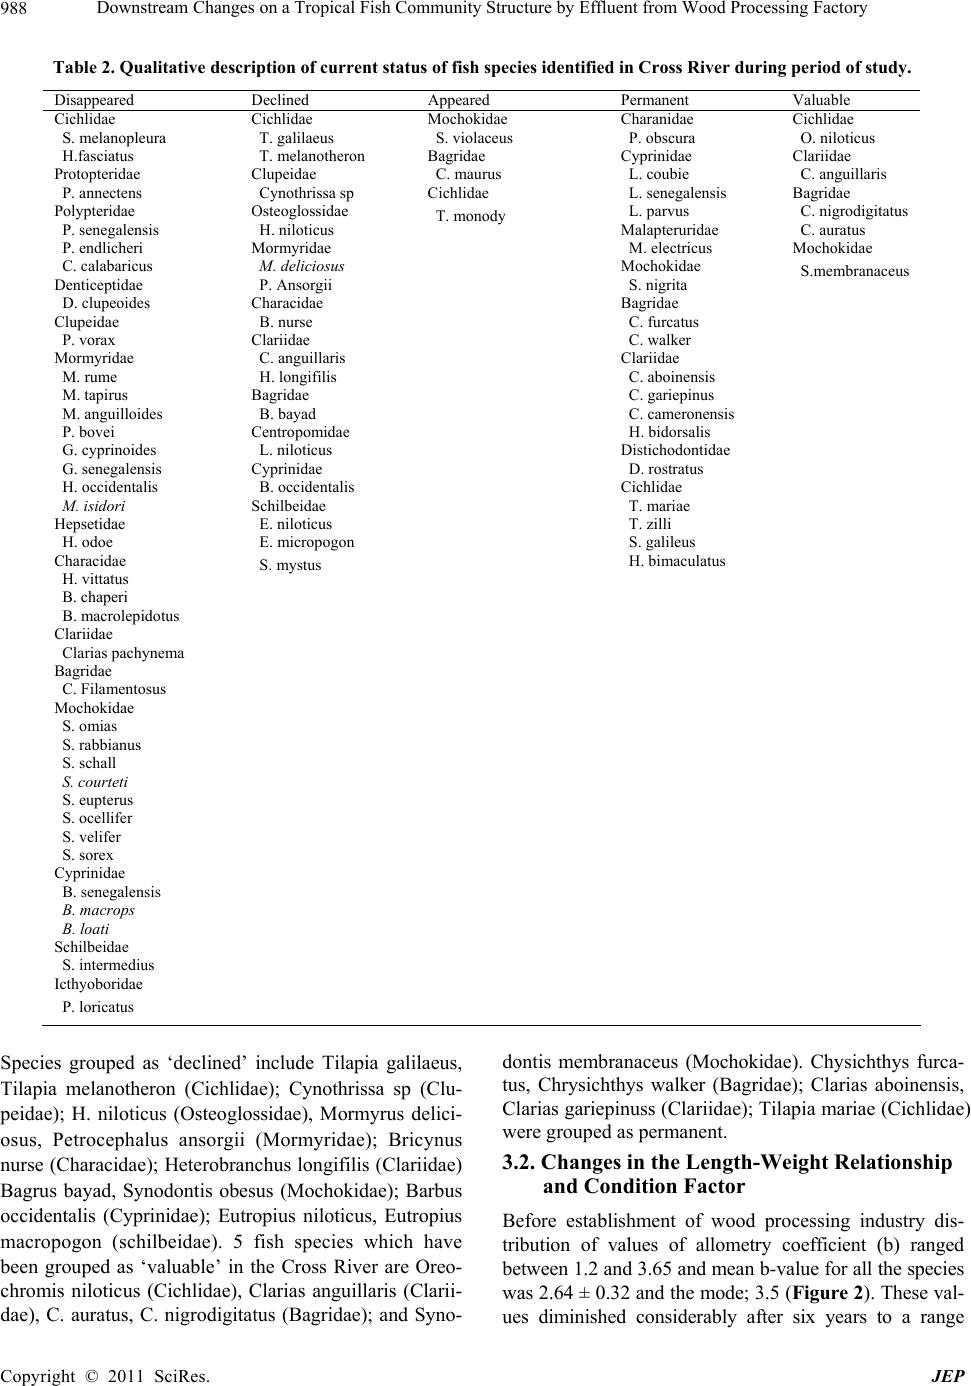 Downstream Changes on a Tropical Fish Community Structure by Effluent from Wood Processing Factory Copyright © 2011 SciRes. JEP 988 Table 2. Qualitative description of current status of fish species identified in Cross River during period of study. Disappeared Declined Appeared Permanent Valuable Cichlidae S. melanopleura H.fasciatus Protopteridae P. annectens Polypteridae P. senegalensis P. endlicheri C. calabaricus Denticeptidae D. clupeoides Clupeidae P. vorax Mormyridae M. rume M. tapirus M. anguilloides P. bovei G. cyprinoides G. senegalensis H. occidentalis M. isidori Hepsetidae H. odoe Characidae H. vittatus B. chaperi B. macrolepidotus Clariidae Clarias pachynema Bagridae C. Filamentosus Mochokidae S. omias S. rabbianus S. schall S. courteti S. eupterus S. ocellifer S. velifer S. sorex Cyprinidae B. senegalensis B. macrops B. loati Schilbeidae S. intermedius Icthyoboridae P. loricatus Cichlidae T. galilaeus T. melanotheron Clupeidae Cynothrissa sp Osteoglossidae H. niloticus Mormyridae M. deliciosus P. Ansorgii Characidae B. nurse Clariidae C. anguillaris H. longifilis Bagridae B. bayad Centropomidae L. niloticus Cyprinidae B. occidentalis Schilbeidae E. niloticus E. micropogon S. mystus Mochokidae S. violaceus Bagridae C. maurus Cichlidae T. monody Charanidae P. obscura Cyprinidae L. coubie L. senegalensis L. parvus Malapteruridae M. electricus Mochokidae S. nigrita Bagridae C. furcatus C. walker Clariidae C. aboinensis C. gariepinus C. cameronensis H. bidorsalis Distichodontidae D. rostratus Cichlidae T. mariae T. zilli S. galileus H. bimaculatus Cichlidae O. niloticus Clariidae C. anguillaris Bagridae C. nigrodigitatus C. auratus Mochokidae S.membranaceus Species grouped as ‘declined’ include Tilapia galilaeus, Tilapia melanotheron (Cichlidae); Cynothrissa sp (Clu- peidae); H. niloticus (Osteoglossidae), Mormyrus delici- osus, Petrocephalus ansorgii (Mormyridae); Bricynus nurse (Characidae); Heterobranchus longifilis (Clariidae) Bagrus bayad, Synodontis obesus (Mochokidae); Barbus occidentalis (Cyprinidae); Eutropius niloticus, Eutropius macropogon (schilbeidae). 5 fish species which have been grouped as ‘valuable’ in the Cross River are Oreo- chromis niloticus (Cichlidae), Clarias anguillaris (Clarii- dae), C. auratus, C. nigrodigitatus (Bagridae); and Syno- dontis membranaceus (Mochokidae). Chysichthys furca- tus, Chrysichthys walker (Bagridae); Clarias aboinensis, Clarias gariepinuss (Clariidae); Tilapia mariae (Cichlidae) were grouped as permanent. 3.2. Changes in the Length-Weight Relationship and Condition Factor Before establishment of wood processing industry dis- tribution of values of allometry coefficient (b) ranged between 1.2 and 3.65 and mean b-value for all the species was 2.64 ± 0.32 and the mode; 3.5 (Figure 2). These val- ues diminished considerably after six years to a range 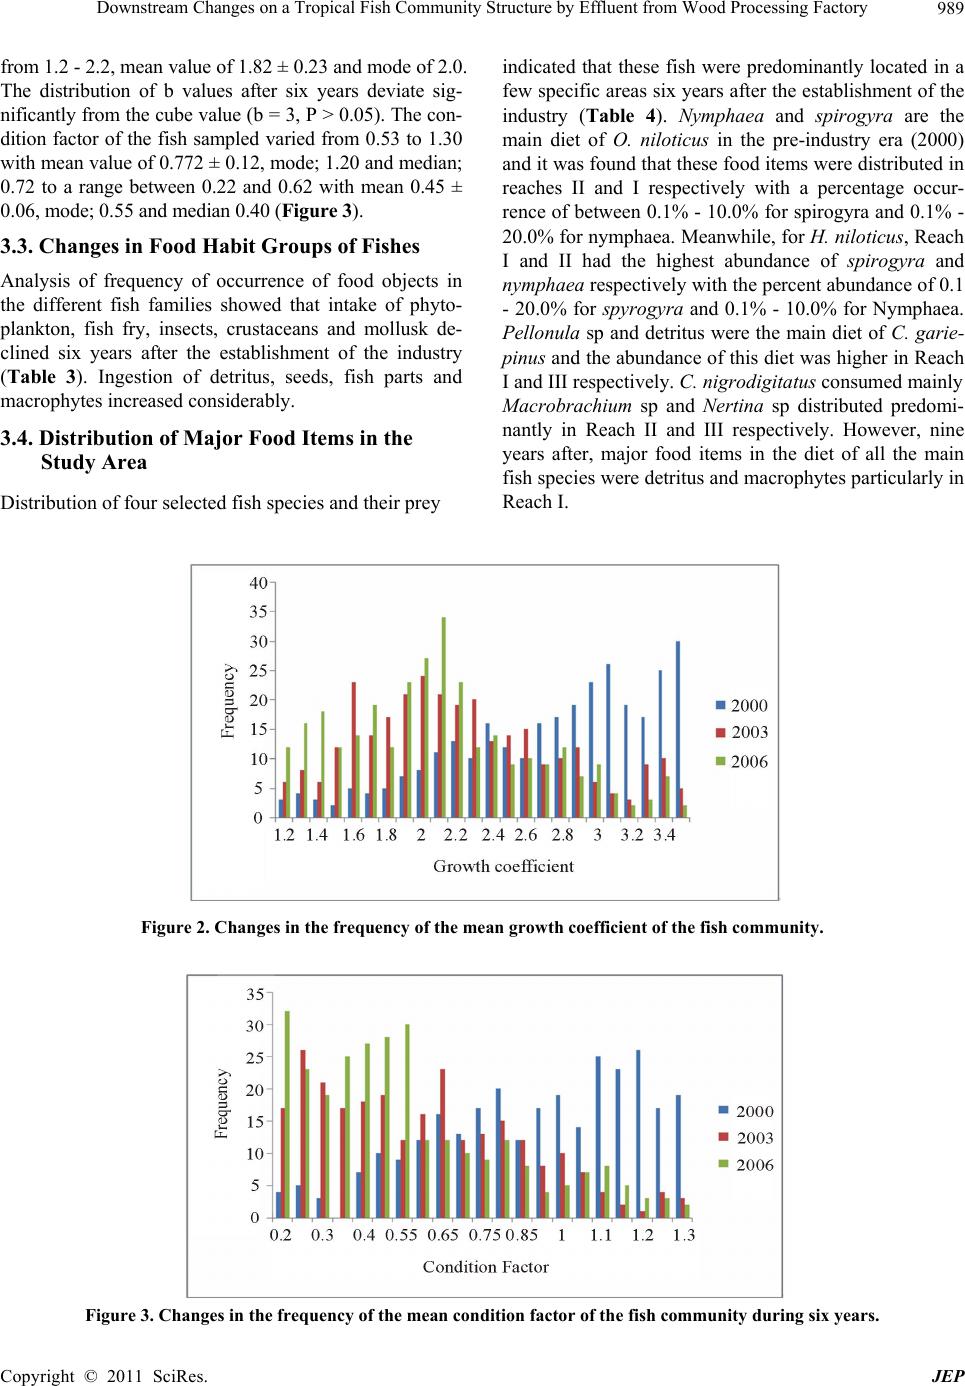 Downstream Changes on a Tropical Fish Community Structure by Effluent from Wood Processing Factory989 from 1.2 - 2.2, mean value of 1.82 ± 0.23 and mode of 2.0. The distribution of b values after six years deviate sig- nificantly from the cube value (b = 3, P > 0.05). The con- dition factor of the fish sampled varied from 0.53 to 1.30 with mean value of 0.772 ± 0.12, mode; 1.20 and median; 0.72 to a range between 0.22 and 0.62 with mean 0.45 ± 0.06, mode; 0.55 and median 0.40 (Figure 3). 3.3. Changes in Food Habit Groups of Fishes Analysis of frequency of occurrence of food objects in the different fish families showed that intake of phyto- plankton, fish fry, insects, crustaceans and mollusk de- clined six years after the establishment of the industry (Table 3). Ingestion of detritus, seeds, fish parts and macrophytes increased considerably. 3.4. Distribution of Major Food Items in the Study Area Distribution of four selected fish species and their prey indicated that these fish were predominantly located in a few specific areas six years after the establishment of the industry (Table 4). Nymphaea and spirogyra are the main diet of O. niloticus in the pre-industry era (2000) and it was found that these food items were distributed in reaches II and I respectively with a percentage occur- rence of between 0.1% - 10.0% for spirogyra and 0.1% - 20.0% for nymphaea. Meanwhile, for H. niloticus, Reach I and II had the highest abundance of spirogyra and nymphaea respectively with the percent abundance of 0.1 - 20.0% for spyrogyra and 0.1% - 10.0% for Nymphaea. Pellonula sp and detritus were the main diet of C. garie- pinus and the abundance of this diet was higher in Reach I and III respectively. C. nigrodigitatus consumed mainly Macrobrachium sp and Nertina sp distributed predomi- nantly in Reach II and III respectively. However, nine years after, major food items in the diet of all the main fish species were detritus and macrophytes particularly in Reach I. Figure 2. Changes in the frequency of the mean growth coefficient of the fish community. Figure 3. Changes in the frequency of the mean condition factor of the fish community during six years. Copyright © 2011 SciRes. JEP 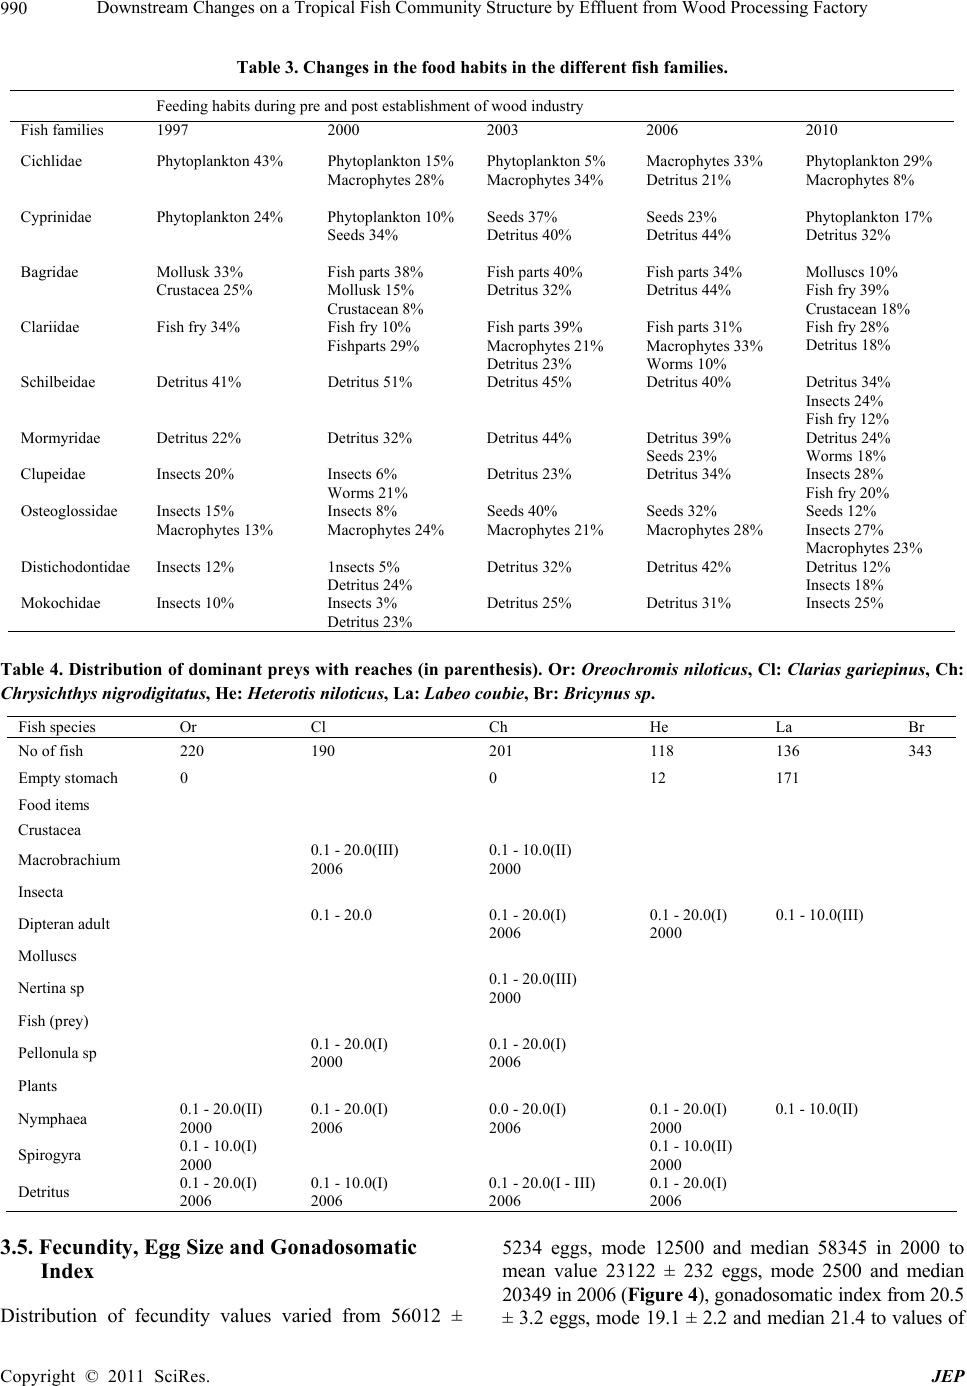 Downstream Changes on a Tropical Fish Community Structure by Effluent from Wood Processing Factory 990 Table 3. Changes in the food habits in the different fish families. Feeding habits during pre and post establishment of wood industry Fish families 1997 2000 2003 2006 2010 Cichlidae Phytoplankton 43% Phytoplankton 15% Macrophytes 28% Phytoplankton 5% Macrophytes 34% Macrophytes 33% Detritus 21% Phytoplankton 29% Macrophytes 8% Cyprinidae Phytoplankton 24% Phytoplankton 10% Seeds 34% Seeds 37% Detritus 40% Seeds 23% Detritus 44% Phytoplankton 17% Detritus 32% Bagridae Mollusk 33% Crustacea 25% Fish parts 38% Mollusk 15% Crustacean 8% Fish parts 40% Detritus 32% Fish parts 34% Detritus 44% Molluscs 10% Fish fry 39% Crustacean 18% Clariidae Fish fry 34% Fish fry 10% Fishparts 29% Fish parts 39% Macrophytes 21% Detritus 23% Fish parts 31% Macrophytes 33% Worms 10% Fish fry 28% Detritus 18% Schilbeidae Detritus 41% Detritus 51% Detritus 45% Detritus 40% Detritus 34% Insects 24% Fish fry 12% Mormyridae Detritus 22% Detritus 32% Detritus 44% Detritus 39% Seeds 23% Detritus 24% Worms 18% Clupeidae Insects 20% Insects 6% Worms 21% Detritus 23% Detritus 34% Insects 28% Fish fry 20% Osteoglossidae Insects 15% Macrophytes 13% Insects 8% Macrophytes 24% Seeds 40% Macrophytes 21% Seeds 32% Macrophytes 28% Seeds 12% Insects 27% Macrophytes 23% Distichodontidae Insects 12% 1nsects 5% Detritus 24% Detritus 32% Detritus 42% Detritus 12% Insects 18% Mokochidae Insects 10% Insects 3% Detritus 23% Detritus 25% Detritus 31% Insects 25% Table 4. Distribution of dominant preys with reaches (in parenthesis). Or: Oreochromis niloticus, Cl: Clarias gariepinus, Ch: Chrysichthys nigrodigitatus, He: Heterotis niloticus, La: Labeo coubie, Br: Bricynus sp. Fish species Or Cl Ch He La Br No of fish 220 190 201 118 136 343 Empty stomach 0 0 12 171 Food items Crustacea Macrobrachium 0.1 - 20.0(III) 2006 0.1 - 10.0(II) 2000 Insecta Dipteran adult 0.1 - 20.0 0.1 - 20.0(I) 2006 0.1 - 20.0(I) 2000 0.1 - 10.0(III) Molluscs Nertina sp 0.1 - 20.0(III) 2000 Fish (prey) Pellonula sp 0.1 - 20.0(I) 2000 0.1 - 20.0(I) 2006 Plants Nymphaea 0.1 - 20.0(II) 2000 0.1 - 20.0(I) 2006 0.0 - 20.0(I) 2006 0.1 - 20.0(I) 2000 0.1 - 10.0(II) Spirogyra 0.1 - 10.0(I) 2000 0.1 - 10.0(II) 2000 Detritus 0.1 - 20.0(I) 2006 0.1 - 10.0(I) 2006 0.1 - 20.0(I - III) 2006 0.1 - 20.0(I) 2006 3.5. Fecundity, Egg Size and Gonadosomatic Index Distribution of fecundity values varied from 56012 ± 5234 eggs, mode 12500 and median 58345 in 2000 to mean value 23122 ± 232 eggs, mode 2500 and median 20349 in 2006 (Figure 4), gonadosomatic index from 20.5 ± 3.2 eggs, mode 19.1 ± 2.2 and median 21.4 to values of Copyright © 2011 SciRes. JEP  Downstream Changes on a Tropical Fish Community Structure by Effluent from Wood Processing Factory991 12.4 ± 2.3, mode 4.5 and median 9.5 (Figure 5) and egg size from mean value; 1.82 mm ± 0.07 mm, mode 2.2, and median; 1.8 to values of 0.8 mm ± 0.04 mm, mode; 1.3 and median 1.1 (Figure 6) and respectively. Figure 4. Changes in the frequency distr i bution of fec undity of the fish species during the six years. Figure 5. Changes in the frequency distribution of the gonadosomatic index of fish species during the six years. Egg size (mm) Figure 6. Changes in the frequency distribution of egg sizes of fish species during the six years. Copyright © 2011 SciRes. JEP 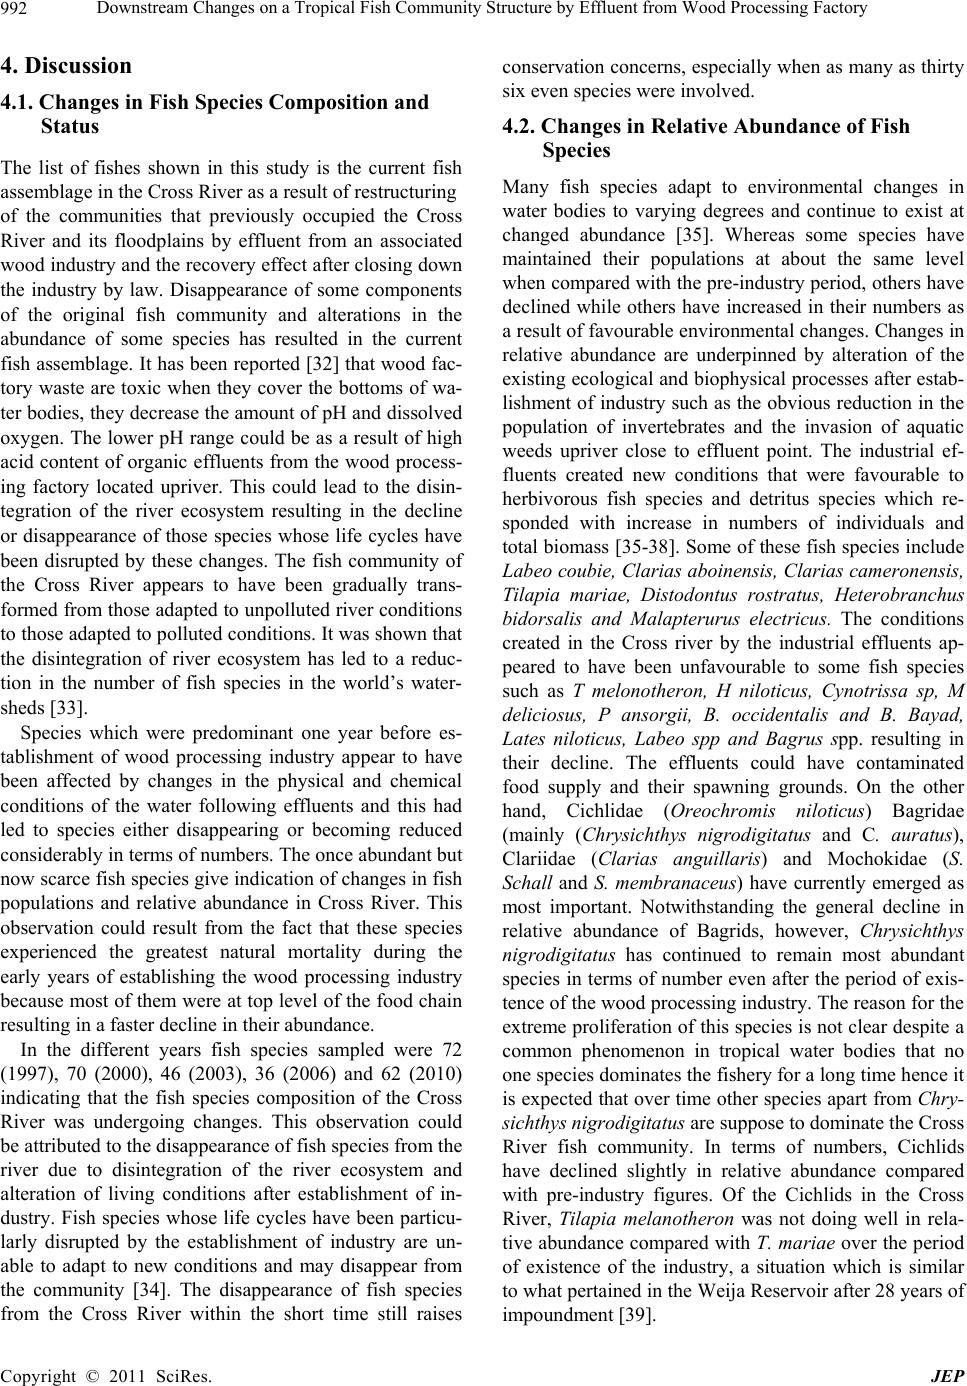 Downstream Changes on a Tropical Fish Community Structure by Effluent from Wood Processing Factory 992 4. Discussion 4.1. Changes in Fish Species Composition and Status The list of fishes shown in this study is the current fish assemblage in the Cross River as a result of restructuring of the communities that previously occupied the Cross River and its floodplains by effluent from an associated wood industry and the recovery effect after closing down the industry by law. Disappearance of some components of the original fish community and alterations in the abundance of some species has resulted in the current fish assemblage. It has been reported [32] that wood fac- tory waste are toxic when they cover the bottoms of wa- ter bodies, they decrease the amount of pH and dissolved oxygen. The lower pH range could be as a result of high acid content of organic effluents from the wood process- ing factory located upriver. This could lead to the disin- tegration of the river ecosystem resulting in the decline or disappearance of those species whose life cycles have been disrupted by these changes. The fish community of the Cross River appears to have been gradually trans- formed from those adapted to unpolluted river conditions to those adapted to polluted conditions. It was shown that the disintegration of river ecosystem has led to a reduc- tion in the number of fish species in the world’s water- sheds [33]. Species which were predominant one year before es- tablishment of wood processing industry appear to have been affected by changes in the physical and chemical conditions of the water following effluents and this had led to species either disappearing or becoming reduced considerably in terms of numbers. The once abundant but now scarce fish species give indication of changes in fish populations and relative abundance in Cross River. This observation could result from the fact that these species experienced the greatest natural mortality during the early years of establishing the wood processing industry because most of them were at top level of the food chain resulting in a faster decline in their abundance. In the different years fish species sampled were 72 (1997), 70 (2000), 46 (2003), 36 (2006) and 62 (2010) indicating that the fish species composition of the Cross River was undergoing changes. This observation could be attributed to the disappearance of fish species from the river due to disintegration of the river ecosystem and alteration of living conditions after establishment of in- dustry. Fish species whose life cycles have been particu- larly disrupted by the establishment of industry are un- able to adapt to new conditions and may disappear from the community [34]. The disappearance of fish species from the Cross River within the short time still raises conservation concerns, especially when as many as thirty six even species were involved. 4.2. Changes in Relative Abundance of Fish Species Many fish species adapt to environmental changes in water bodies to varying degrees and continue to exist at changed abundance [35]. Whereas some species have maintained their populations at about the same level when compared with the pre-industry period, others have declined while others have increased in their numbers as a result of favourable environmental changes. Changes in relative abundance are underpinned by alteration of the existing ecological and biophysical processes after estab- lishment of industry such as the obvious reduction in the population of invertebrates and the invasion of aquatic weeds upriver close to effluent point. The industrial ef- fluents created new conditions that were favourable to herbivorous fish species and detritus species which re- sponded with increase in numbers of individuals and total biomass [35-38]. Some of these fish species include Labeo coubie, Clarias aboinensis, Clarias cameronensis, Tilapia mariae, Distodontus rostratus, Heterobranchus bidorsalis and Malapterurus electricus. The conditions created in the Cross river by the industrial effluents ap- peared to have been unfavourable to some fish species such as T melonotheron, H niloticus, Cynotrissa sp, M deliciosus, P ansorgii, B. occidentalis and B. Bayad, Lates niloticus, Labeo spp and Bagrus spp. resulting in their decline. The effluents could have contaminated food supply and their spawning grounds. On the other hand, Cichlidae (Oreochromis niloticus) Bagridae (mainly (Chrysichthys nigrodigitatus and C. auratus), Clariidae (Clarias anguillaris) and Mochokidae (S. Schall and S. membranaceus) have currently emerged as most important. Notwithstanding the general decline in relative abundance of Bagrids, however, Chrysichthys nigrodigitatus has continued to remain most abundant species in terms of number even after the period of exis- tence of the wood processing industry. The reason for the extreme proliferation of this species is not clear despite a common phenomenon in tropical water bodies that no one species dominates the fishery for a long time hence it is expected that over time other species apart from Chry- sichthys nigrodigitatus are suppose to dominate the Cross River fish community. In terms of numbers, Cichlids have declined slightly in relative abundance compared with pre-industry figures. Of the Cichlids in the Cross River, Tilapia melanotheron was not doing well in rela- tive abundance compared with T. mariae over the period of existence of the industry, a situation which is similar to what pertained in the Weija Reservoir after 28 years of impoundment [39]. Copyright © 2011 SciRes. JEP  Downstream Changes on a Tropical Fish Community Structure by Effluent from Wood Processing Factory993 4.3. Changes in the Length-Weight Relationship and Condition Factor Seventy six percent of the species presented in this study exhibited a trend of isometric growth (b = 3) depicting dimensional equality before the establishment of wood processing industry [24]. This trend contrast greatly from the species during the existence of the industry where the pattern indicated an acute negative allometry. This may be attributed to the change in ecological parameters at the freshwater environment after establishment of the indus- try in which these species have carved their ideal niche. The riverine environment is characterized mainly by high oxygen content, low salinity, high nutrient content and higher productivity in contrast to the contaminated post-industry condition [40]. To counter the scarcity of nutritional resources at post-industry establishment so- matic growth is less important and energy is diverted to reproductive processes [41]. The general trend of nega- tive allometry exhibited by some most fish species after establishment of industry compared to the isometry ob- served in most of the species in the study area before existence of industry may be regarded as floodplain ad- aptations to survive in the polluted river. The fact that 65% of the entire 78 species examined had condition factor above mean and that the overall mean condition factor did not significantly deviate from the value of 1.0 showed that the majority of the fish in the populations of Cross River inland wetlands were in good condition before the establishment of wood proc- essing industry, thus justifying the dimensional equality of their growth pattern. The high condition factor of the fish species in the river pre-industry era is an indication of abundant food. Low condition factor showed during existence of industry indicates that food resources had diminished. 4.4. Changes in Food Habit Groups of Fishes Though herbivores and detritivores were the least impor- tant in terms of weight and numbers in pre industry es- tablishment studies undertaken in the Cross River, they have currently increased significantly in numbers and weight becoming the most important in terms of numbers. From reports of studies undertaken after establishment of industry, benthic carnivores have declined in their im- portance probably due to contamination by effluents that have reduced food resources and spawning grounds for benthic and pelagic invertebrates and fish preys. Further downstream in Reaches II and III, however, benthic om- nivores have continued in their importance and have maintained their dominance in the Cross River. The om- nivores together (i.e. both semi pelagic and benthic om- nivores) have, however, become most important in the Cross River after the existence of the industry. Importance of herbivores after six years of the exis- tence of the industry has increased considerably com- pared with the period before the establishment of indus- try, possibly due to declining food sources. The composition of piscivores after six years of estab- lishment of wood industry declined compared with one year pre industry existence. The general decline in the importance of piscivores in the Cross River during the period of existence of industry could be attributed partly to the disappearance of some piscivorous fishes as well as their restricted distribution due to decline of fish preys and their preference for unpolluted river conditions which have reduced over the period of existence of the industry. Clarias gariepinus has maintained its impor- tance as a “fish-eating fish” in the Cross River during the period of existence of wood industry whereas Hemichromis fasciatus has disappeared and Clarias an- guillaris has declined in abundance. The wider food spectrum exhibited by C. anguillaris , C. nigrodigitatus and O. niloticus revealed trophic flexibility [42]. The ecological advantage of this is that it enables a fish to switch from one category of food to another in response to fluctuation in their abundance. Another advantage is the ability of the species to utilize many different food objects effectively and this probably accounts for their higher abundance in the study area during pre-industry period [43,44]. The fact that detritus dominated the gut contents of the freshwater species in the study area during the existence of the industry implied that most of the fish species in the Cross River inland wetlands are detritivores during this period. 4.5. Fecundity, Gonadosomatic Index and Egg Size Disparity was noted between fecundity of fish in this study area before establishment of industry and that of fish populations six years after the existence of the in- dustry. The higher values of fecundity among popula- tions before establishment of industry can be attributed to the greater abundance of food in the river pre-industry period. Pre-industry fish species of the Cross River were therefore more superior than post-industry and can be better broodstocks in the farms. Such related differences in fecundity had been observed [45-48] and were attrib- uted to environmental factors such as differential abun- dance of food and water quality. Fecundity may be reduced if individual fish mature at a smaller size, and individuals in poorer condition may experience increased mortality during environmentally stressful period [49]. Small egg size implies that survival Copyright © 2011 SciRes. JEP  Downstream Changes on a Tropical Fish Community Structure by Effluent from Wood Processing Factory 994 rate of the progeny will be low [29]. Therefore, the larger egg sizes of fish species during pre-industry period im- plied that pre-industry Cross River provided more suit- able habitat for the species. The low GSI, fecundity and variation in the egg sizes observed for species during post-industry period may be attributed to the sudden change in the environmental factors due to effluents discharged from the wood proc- essing industry. Similar observations have been reported [50]. A change in the environmental factors results in significant changes in the egg size [51]. The implication of these results is that the reproductive potential of fish species in Cross River is greatly affected by the envi- ronmental factors and human activities. REFERENCES [1] Food and Agriculture Orgnization (FAO), African Fish- eries and the Environment: in Food and Agriculture Or- ganization of the United Nations, Italy, 1991. [2] J. Elkington, “Beware of the Wrath of Dsiris,” New Sci- ence, Vol. 68, 1975, pp. 626-268. [3] R. L. Welcome, “River Fisheries,” FAO Fisheries Tech- nical Paper, Vol. 262, 1985, pp. 330. [4] Food and Agriculture Organization (FAO), “Role of Fish- eries Technology in Development of Inland Floodplain in Africa,” In: Symposium on River and Floodplain Fisher- ies in Africa, CIFA Technical Paper, No. 5, 1988, pp. 12-18. [5] Food and Agriculture Organization (FAO), Training for Agriculture and Rural Development, Rome, 1986. [6] B. D. Olaosebikan and A. Raji, “Field Guide to the Nige- rian Fresh Water Fishes,” Federal College of Freshwater Fisheries Technology, New Bussa, Nigeria, 1998. [7] Federal Department of Fisheries, Presentation on the Fisheries Sub-Sector at the Presidential Forum, Abuja, 2003. [8] D. M. Jamu and O. A. Ayinla, “Potential for the Devel- opment of Aquaculture in Africa,” NAGA, Vol. 693, 2003, pp. 9-13. [9] R. P. King, “New Observations on the Trophic Ecology of Liza Grandisquamis (Valenciennes, 1836) (Pisces: Mugillidae), in the Bonny River, Niger Delta, Nigeria,” Cybium, Vol. 12, No. 1, 1988, pp. 23-36. [10] P. M. Rosenberg, H. V. Danks and D. M. Lemhkyhi, “Importance of Insects in Environmental Impact Assess- ment,” Environmental Management, Vol. 10, 1986, pp. 773-783. [11] N. S. Clair, L. M. Perry and F. P. Gene, “Chemistry for Environmental Engineering and Science,” 5th Edition, Mcgraw-Hill, New York, 2003. [12] Federal Environmental Protection Agency, Our National Environmental Goals, Special Publication No.3, Lagos, 1989. [13] E. O. Ita, “Inland Fisheries Resources of Nigeria,” CIFA, Food and Agriculture Orgnization, Rome, 1993. [14] I. A. Butt, Report on the Industrial Pollution of Jakara Dam. Ministry of Health, Kano State, Nigeria, 1985. [15] H. A. Adeniji and I. G. Mbagwu, Study of Phys- ico-Chemical Characteristic of Some Heavy Metals in Jankara Reservoir, NIFFR Annual Report, Kano State, 1990. [16] E. O. Anko and A. A. Eyo, “Fisheries Department, Min- istry of Agric. Nigeria with Special Reference to Cross River State,” Abstracts of the 17th Annual Conference of Fisheries Society of Nigeria (FISON), 2001. [17] American Public Health Association, Standard Methods for the Examination of Water and Waste Water, Wash- ington D.C., 1987. [18] M. Elvira, “Taxonomic Revision of the Genus Chon- drostoma Agassi 1835 (Pisces: Cyprinidae),” Cybium, Vol. 11, 1987, pp. 111-198. [19] F. Erk’akan, T. T. Nalbant and S. C. Ozeren, “Seven New Species of Barbatula Three New Species of Schistura and a New Species of Seminemacheilus (Ortariophysi: Balitori- dae: Nemachellinae) from Turkey,” Journal of Fisheries International, Vol. 2, 2007, pp.69-85. [20] G. G. Teugel, “Prelimnary Results of Morphological Study of Five African Species of the Subgenus Clarias (Pisces: Clariidae),” Journal of Natural History,Vol. 16, 1982, pp. 439. doi:10.1080/00222938200770351 [21] W. Fischer, M. Schneider and M. L. Bauchot, “Mediter- ranee et Mer Noire Zone De Peche 37,” Revision 1, Volumn II, Vertebres, Rome, 1987. [22] D. Pauly, “Fish Population Dynamics in Tropical Water: A Manual for Use with Programmable Calculators,” Iclarm Studies and Reviews, Vol.8, 1984, pp.325. [23] J. A. Zar, “Biostatistical Analysis,” Prentice Hall, New Jersey, 1984. [24] W. E. Ricker, “Computations and Interpretations of Bio- logical Statistics of Fish Populations,” Bulletin of the Fisheries Research Board of Canada, Vol. 191, 1975, pp. 201-210. [25] V. O. Sagua, “Aquaculture and Fisheries Development in Nigeria,” The 12th Annual Conference of Agriculture So- ciety of Nigeria, University of Ife, 1979. [26] A. C. Simpson, “The Fecundity of Plaice,” UK Ministry of Agriculture and Fisheries, Fisheries and Food Investi- gation, Vol. 217, 1951, pp. 3-27. [27] T. B. Bagenal, “Age and Growth,” In: T. B. Bagenal, Ed., Fish Production in Freshwater, Blackwell, Oxford, Lon- don, 1978, pp. 120-128. [28] V. L. DE Vlaming, “The Effect of Temperature and Pho- toperiod on Reproductive Cycling in the Estuarine Gobiid Fish (Gillichthys mirabilis),” Fishery Bulletin, Vol. 73, 1982, pp. 1137-1157. [29] A. M. A. Imevbore, “Some preliminary observation on the sex-ratio and fecundity of the fish in River Niger,” In: S. A. Vissar, Ed., Kainji—A Nigerian Man-Made Lake, NISER, Ibadan, 1970. Copyright © 2011 SciRes. JEP  Downstream Changes on a Tropical Fish Community Structure by Effluent from Wood Processing Factory Copyright © 2011 SciRes. JEP 995 [30] P. B. Bayley, Caracteristicas de inundacion de los rios y areas de Captacion en la Amazonia peruana. Inf. No. 81 Institute del mar del peru (IMARPE), Peru, 1981. [31] P. McCully, “Silenced Rivers: The Ecology and Politics of Large Dams,” Zed Books Ltd., 1996. [32] T. Bhukaswan, “Management of Asian Reservoir Fisher- ies,” FAO Fisheries Technical Paper, Vol. 207, Rome, 1980. [33] W. A. Evans and J. Vanderpuye, “Early Development of the Fish Populations and Fisheries of Volta Lake,” Geo- physical Monograph, Vol. 17, 1973, pp. 114-120. doi:10.1029/GM017p0114 [34] E. K. Balon and A. G. Coche, “Lake Kariba, a Man-Made Ecosystem in Central Africa,” Monographiae Biologicae, Vol. 24, 1974, pp. 767. [35] T. Petr, “Hydrobiology and Fisheries Problems of the Nyumba ya Mungu Man-Made Lake in Tanzania,” The African Journal of Tropical Hydrobiology and Fisheries, Vol. 4, No. 1, 1975, pp. 39-50. [36] T. Quarcoopome and F. K. Y. Amevenku, “Fish Fauna of the Weija Reservoir—28 Years After Impoundment,” CSIR-WRI Technical Report, 2006. [37] M. Abhijit, “Origin and Evolution the Deep-Sea Fauna,” Journal of the Indian Ocean, Vol. 5, pp. 251-253. [38] P. A. Large, P. Loranze and J. G. Pope, “Survey Esti- mates of the Overall Size Composition of the Deep-Sea Fish Species before and after Exploitation,” ICES, Center for Environment, Fisheries and Aquacultural Sciences, Lowesoft, U.K., 1999. [39] R. J. Wooton, “The Effect of Size of Food Ration on Egg Production in the Female Three-Spined Stickleback, Gasterosteus Aculeatus,” The Journal of Fish Biology, Vol. 5, 1979, pp. 89-96. [40] R. P. King, O. M. Udodiong, E. C. Ekwali and N. A. Nkanta, “Some Aspects of the Trophic Biology of Iiisha Africana (Teleostei, Pristigasteridae) in Qua Iboe Estuary, Nigeria,” African Journal of Ecology, Vol. 105, 1991, pp. 261-274. [41] E. R. Akpan, “Seasonal Variability in Phytoplankton Biomass in Relation to Physico-Chemical Changes in the Cross River Estuaries of Eastern Nigeria Ph.D Thesis,” University of Calabar, 1994. [42] G. A. Rounsefell and W. H. Everhart, “Fishery Science, its Methods and Applications,” John Wiley and Sons Inc., New York, 1957. [43] T. K. Pitt, “Fecundity of American Plaice, Hippoglos- soides Platessoides (F) Fromgrand Bank and New Found Land Areas,” Journal of the Fisheries Research Board of Canada, Vol. 21, 1964, pp. 507-512. [44] F. Nagasaki, “The Fecundity of Pacific Herring, Clupea Pallasi, in British Columbia Coastal Waters,” Journal of the Fisheries Research Board of Canada, Vol. 15, 1958, pp. 313-330. [45] S. S. E. Palacious, Estudio biologico pesquero de la tila- pia Oreochromis aureus (Steindachner, 1864) en la Presa Benito Juarez, Oaxaca, Mexico, en 1993, Ciencia Pesquera, No. 11, 1995, pp. 54-61. [46] B. J. Shuter, J. A. MacLean, F. E. J. Fry and H. A. Regier, “Stochastic Simulation of Temperature Effects on First- Year Survival of Small-Mouth Bass,” Transactions of the American Fisheries Society, Vol. 109, 1980, pp. 1-34. [47] F. E. Asuquo, E. E. Ntekim, A. O. Eja, A. O. Ekwu, O. O. Ogri and E. S. Bassey, “Post Impact Assessment of Cross River Coastal Areas Affected by Mobil (Idoho) Oil Spill- age,” Report submitted to Cross River State Government, 1998. [48] W. O. Odiete, Environmental Physiology of Animals and Pollution, Diversified Resources, Lagos, 1999.
|