Journal of Environmental Protection, 2011, 2, 947-955
doi:10.4236/jep.2011.27108 Published Online September2011 (http://www.SciRP.org/journal/jep)
Copyright © 2011 SciRes. JEP
947
Applying Indexing Method to Gas Pipeline Risk
Assessment by Using GIS: A Case Study in
Savadkooh, North of Iran
Hamid Reza Jafari, Saeed Karimi, Gholamreza Nabi Bidhendi, Mousa Jabari, Nasim Kheirkhah
Ghahi
Faculty of Environment, University of Tehran, Faculty of Health, Safety and Environment, Shahid Beheshti University of Medical
Sciences, Tehran, Iran.
E-mail: hjafari@ut.ac.ir, Karimis@ut.ac.ir, ghhendi@ut.ac.ir, jabbarim@sbmu.ac.ir, nasim_kheirkhah@yahoo.com
Received June 15th, 2011; revised July 23rd, 2011; accepted August 28th, 2011.
ABSTRACT
Gas pipelines are environmentally sensitive because they cross varied fields, rivers, forests, populated areas, desert,
hills and offshore and also different parameters in gas transmission progresses are effective. Underground gas trans-
mission pipelines have been grown as one of the low risk methods with low cost in the world specially in middle east
and Europe. Physical and chemical properties of liquid gas, pipeline properties and also its environmental condition
are the main factors of increasing the technical and environmental risk. In this article the quantitative risk assessment
has been done by using GIS and overlaying the information layers. For this purpose, all effective risk factors were
identified and projected. In order to achieve the same and comparable results, the entire pipeline route was divided into
500 meter intervals and the risk wa s calculated in each interval, finally the scores of these interva ls such as each crite-
rion risk was calculated. The case study of the article is Savadkooh to PoleSefid pipeline in Mazandaran.
Keywords: Risk Assessment, Pipeline, GI S , Environment
1. Introduction
Natural gas is one of the most important energy carries
[2,9,13].Considering the fact that Islamic Republic of
Iran has 14 thousand kilometers of oil pipeline and more
than 22 thousand kilometers of gas transmission pipeline,
it has the longest network of oil pipeline in Middle East.
In fact, Gas transmission in order to deliver the eco-
nomic and almost clean energy from producing sources
to final consumers is one the most important tasks. Pipe-
lines represent a linear risk source that can create con-
troversial challenges in gas industry of the country.
Therefore, pipeline risk assessment is one of the sciences
that has been developed due pipelines growth.
Transmission pipelines carrying natural gas are not
only on secure industrial sites, but also routed across the
land. In the recent years, more and more authorities have
been aware of the security problems of natural gas
transmission pipelines. Due to the physical and chemical
characteristics of natural gas as well as the features of
pipelines, accidents of transmission pipelines carrying
natural gas are quite different from other industrial acci-
dents [14].
In fact, considering all the issues which have been
mentioned above, the important issue is transferring the
energy to the domestic and foreign consumers. Clearly,
the usage of pipelines is the best and most economical
method which has the least impact. Therefore any at-
tempt to transfer the energy carries should be done in
terms of these factors. A review on statistics of occurred
accidents causes make the necessity of attention, investi-
gation, evaluation, planning, management and monitor-
ing of these pipelines clear.
Due to the widespread and dangerous impacts of the
possible occurrence of any pipeline accident, It is essen-
tial to identify all the risks and potential hazards. Re-
cently, risk analysis has already been extensively applied
in safety science, environmental science, economics,
sociology, etc. It aims at finding out the potential acci-
dents, analysis on the causes as well as the improvements
to reduce the risk. It is important to realize that deci-
sion-making regarding risks is not only a technical aspect
but also political, ps ycholog ical and so cietal processes all
Applying Indexing Method to Gas Pipeline Risk Assessment by Using GIS: a Case Study in Savadkooh, North of Iran
948
playing important roles. Therefore, it is much important
to clearly identify the risks and check out the effects of
risk reduction measures by quantitative risk assessment
(QRA) [7].
When a pipeline has been assessed, in fact the hazard
probability and its impacts in an exact section of the
pipeline according to the environmental conditions are
depicted in a precise moment [8].
Studies that have been done so far regarding energy
transmission risk assessment conducted by a different
approaches, and each of these methods emphasizes on a
certain parameter in risk assessment. In the study that
was done in Greece [10]. In this approach fuzzy logic is
considered better for dealing both with linguistic vari-
ables and uncertainties. In this study a rapid assessment
and relative ranking of the hazards of chemical sub-
stances, as well as units and installations, is presented in
order to enter different parameters in risk assessment.
Pasanta Kumar Dey [4] in a study titled as “An inte-
grated assessment model for cross-country pipelines”
proposed various options by developing an integrated
model. The model considers technical analysis (TA),
socioeconomic IA (SEIA) and environmental IA (EIA) in
an integrated framework to select the best project from a
few alternative feasible projects.
In the opinion of two other scientists, the environ-
mental consequence index (ECI) indices lack in consid-
eration of all environmental consequence factors such as
material hazard factors, dispersion factors, environmental
effects, and their uncertainty, this is why the ETC has
been applied by a new method [1].
In Iran, in a comprehensive risk assessment of petro-
chemical pipelines, they focused on the assessment of
third party damage indicators, incorrect operation, corro-
sion and design [5].
Besides the available resources, the most important
source of pipeline risk assessment is the valuable book
by Mahlbuner [8] which is a comprehensive method,
trying to assess the risk with considering all the influen-
tial parameters.
2. Methodology
2.1. Materials
The case study of this research is Savadkooh’s 16 inch
gas transmission pipeline in Mazandaran province in Iran
which passes through the cities: Savadkooh, Zirab, Shir-
gah and pole Sefid and villages: Sorkh kola, Ghasem
abad and zirab. The pipeline length is 606 + 30 km and
will transfer gas through the Valley of Talar River from
Caspian coastal areas to mountainous regions of Savad-
kooh in the north-to-south direction.
Starting point coordinates are x = 668,500 and y =
4,021,500 and the end point coordinates of the pipeline
are x = 682,500 and y = 4,002,500 .The pipeline passes
along the Firoozkooh road in some parts of the route and
in some other parts passes forests around Shirgah and
crosses the rivers of Kasilian and Talar and also the main
asphalted road in 251 + 21 km. In terms of geology, the
pipeline has been placed in central zone of Alborz and
large part of the rout passes across the present era river
and alluvial deposits, oligo-miocene stone formations
like upper red formation equivalent currency and Qom
formation and continen tal series.
These formations are formed mostly by marl, sand-
stone and continen tal conglomerates.
According to the geological situation of the area, cor-
rosion fault has a great expansion in the region. On the
other side, the topographical situation of the region with
the exception of the primary parts and the end of the
route is mountainous and steep.
Also due to placing the caste study route in mountain-
ous climate, the permanent rivers which can cause ero-
sion phenomenon in mountainsides are found (such as
Talar river, Kasilian, Cherat and etc.) according to the
presented content above; the case study region has low to
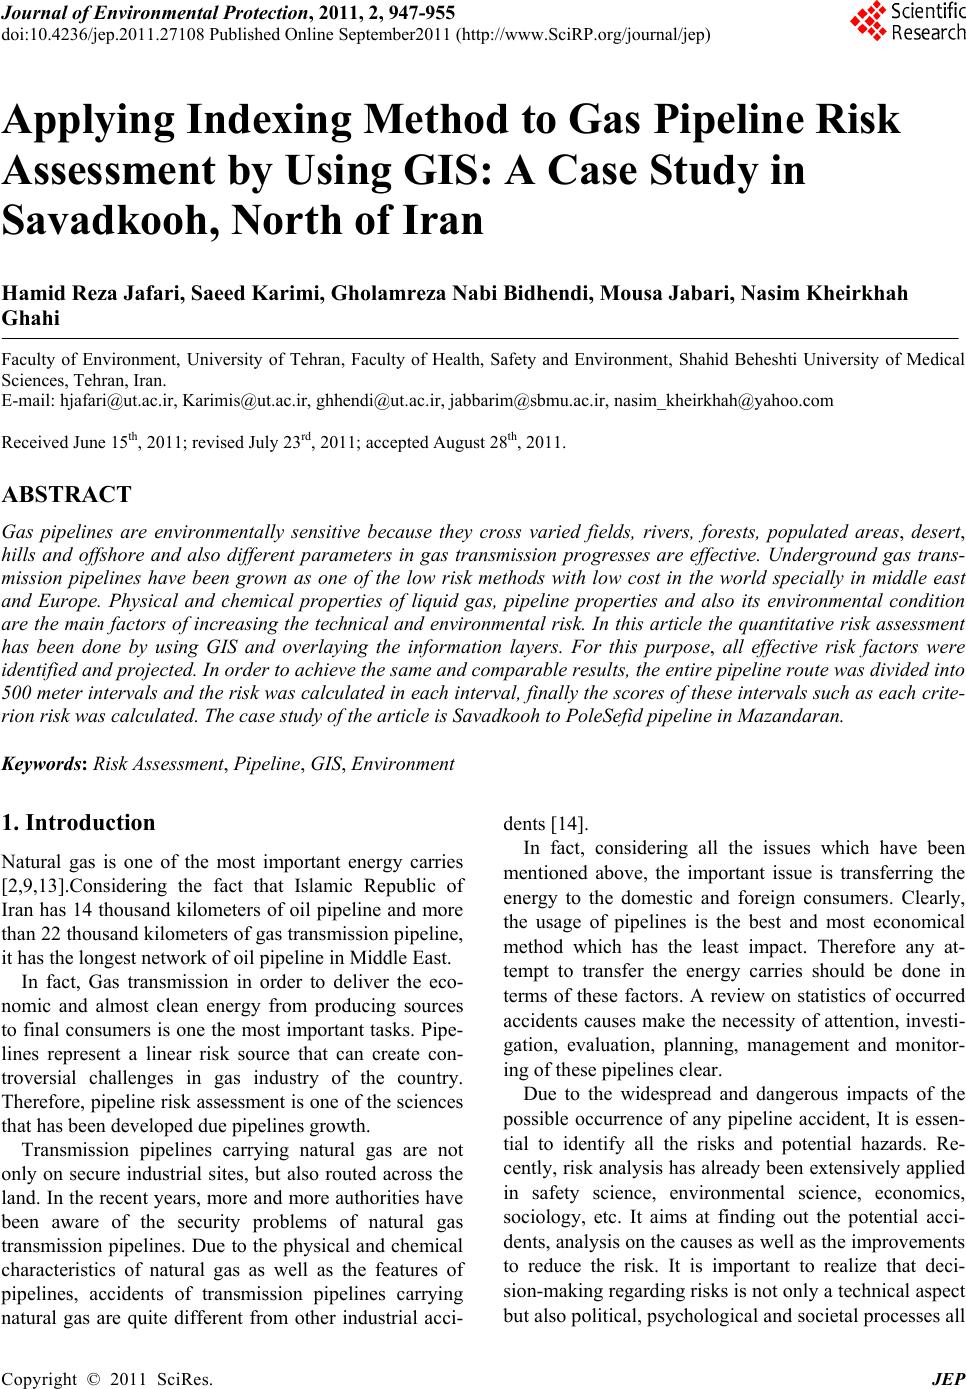
moderate landslide potential. Figure 1 shows the result
of the pipeline risk assessment in the satellite image.
2.2. Methods
Different methods of risk assessment and management
are used, such as hazard and operability study, fault per-
centage analysis, quantitative risk assessment, optional
risk assessment and indexing method [8]. Each of these
methods has its own strengths and weaknesses, but in-
dexing methods are more practical than the others due to
faster response, low cost analysis, supportive tool for
better decisions and comprehensiveness. [8].
The base method which has been used in this article is
Indexing method by Mahlbauer. This method has been
applied widely in gas pipeline transmission and is com-
patible with pipeline project conditions in terms of accu-
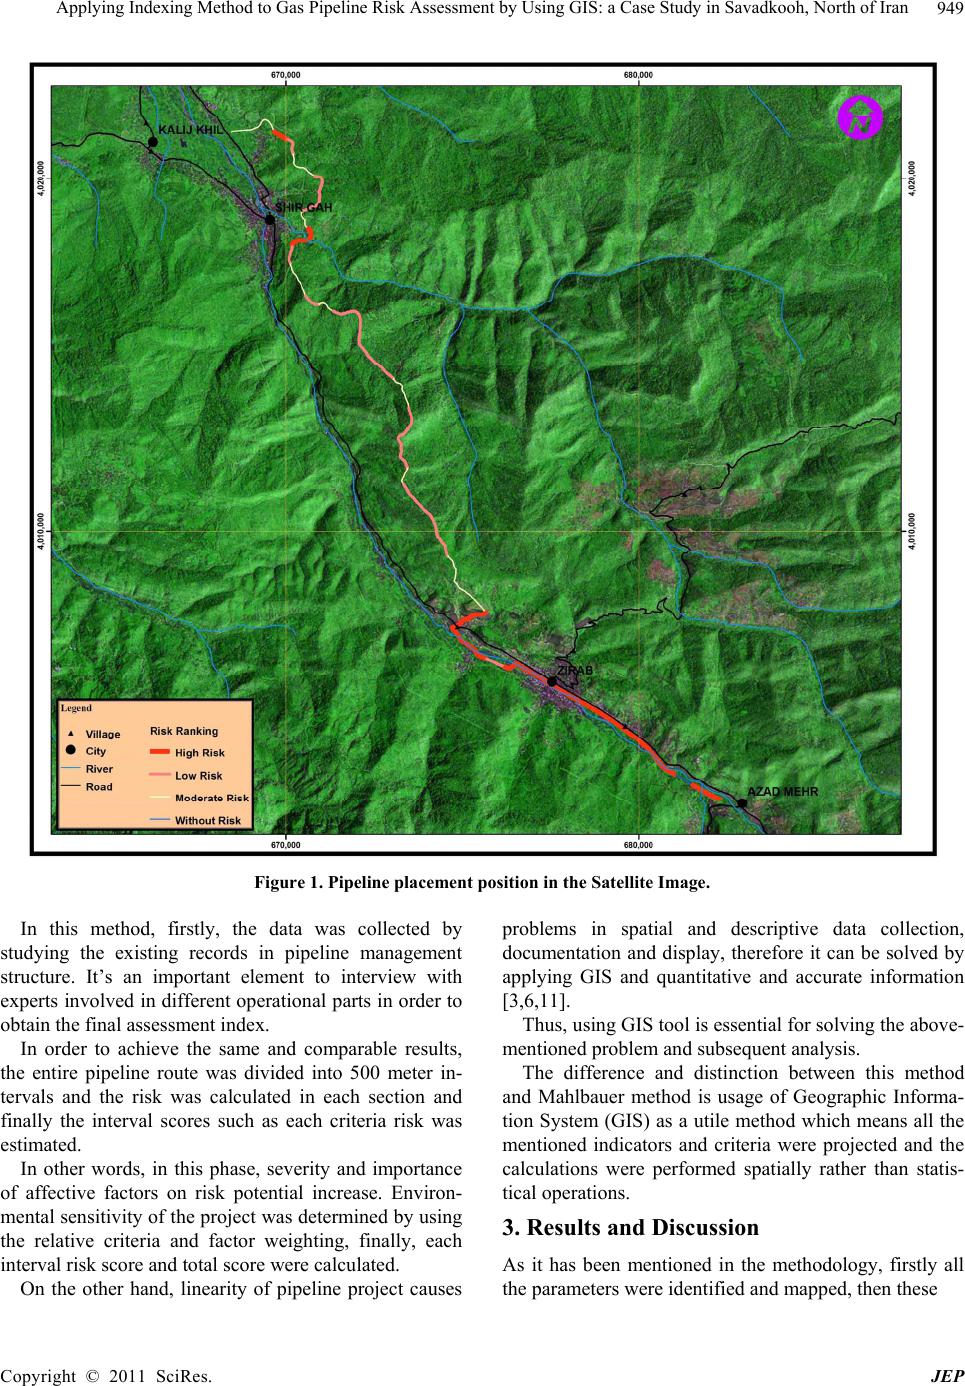
racy and required information. According to Graph 1,
assessment in this method is divided into two general
parts of impact index and index sum.
Preparation and projection of each sector criteria is
time consuming and in some cases is the same in the en-
tire pipeline or less important. Therefore pipeline risk
assessment based on mentioned criteria will have many
difficulties. In order to optimize the method, the same
criteria in the pipeline will be excluded from the process
and also an index has been used as a substitute in terms
of similarity to the some criteria. While in some cases,
preparation and projection of some criteria were not pos-
sible due to limitation of the study, the criterion was re-
moved from the assessment process.
Copyright © 2011 SciRes. JEP
Applying Indexing Method to Gas Pipeline Risk Assessment by Using GIS: a Case Study in Savadkooh, North of Iran 949
Figure 1. Pipeline placement position in the Satellite Image.
In this method, firstly, the data was collected by
studying the existing records in pipeline management
structure. It’s an important element to interview with
experts involved in different operational parts in order to
obtain the final assessment index.
In order to achieve the same and comparable results,
the entire pipeline route was divided into 500 meter in-
tervals and the risk was calculated in each section and
finally the interval scores such as each criteria risk was
estimated.
In other words, in this phase, severity and importance
of affective factors on risk potential increase. Environ-
mental sensitivity of the proj ect was determined by using
the relative criteria and factor weighting, finally, each
interval risk score and total scor e were calculated.
On the other hand, linearity of pipeline project causes
problems in spatial and descriptive data collection,
documentation and display, therefore it can be solved by
applying GIS and quantitative and accurate information
[3,6,11].
Thus, using GIS tool is essential for solving the above-
mentioned problem and subsequent analysis.
The difference and distinction between this method
and Mahlbauer method is usage of Geographic Informa-
tion System (GIS) as a utile method which means all the
mentioned indicators and criteria were projected and the
calculations were performed spatially rather than statis-
tical operations.
3. Results and Discussion
As it has been mentioned in the methodology, firstly all
the parameters were identified and mapped, then these
Copyright © 2011 SciRes. JEP
Applying Indexing Method to Gas Pipeline Risk Assessment by Using GIS: a Case Study in Savadkooh, North of Iran
950
Graph 1. Pipeline risk assessment components and process [8].
maps were divided into 500-meter interv als, finally scor-
ing was done based on environmental conditions. Using
GIS in mapping and scoring can help the presentation of
all probable risks on th e maps which can be used as tools
to develop the existing methods and can be useful in risk
management of a pipeline and prevents the occurrence of
probable risks. In fact by using this method, a wide range
of risks such as ecological, physical, chemical, environ-
mental and safety can be prevented, and finally a com-
prehensive assessment will be achieved. The defined
criteria have been mapped and scored as Figure 2.
Fault: the approximate incidence location of Savad-
kooh pipeline with existing faults are provided in Table
1, according to index points of survey.
Under ground water: regarding the manual bores in
some sections of the pipeline route, distances listed in
Table 2 have been approached by the water, therefore
these areas has risks in terms of underground water in-
dex.
Corrosion: along the pipeline route, geo electrical ex-
aminations have been done in depth of 1.5 - 3 meters,
with one kilometer interval and the examinations were
near the identification sinks. Table 3 show s the co rro sion
levels in terms of different electrical resistivity. Table 4
shows the final risk score in terms of corrosion index. It
should be also mentioned that only the medium to high
level corrosions have been weighed in this method.
Landslide: the pipeline landslide zonation has been
done by combination of three methods of Grade 1, Grade
2 and Grade 3. The risk assessment final results in terms
of this criterion are available in table 5.
High voltage transmission lines: if the pipeline has
been placed parallel or under the high voltage transmis-
sion lines, the induced voltage will cause the flow into
the pipe in the places that the pipeline cut the magnetic
field. Due to this issue, the final risk score in terms of
high voltage transmission line index has been shown in
Table 6.
Residential areas: activity rate of this region may be
studied by several indexes which population density and
residential centers in the region are the important pa-
rameters. The final risk score in terms of residential areas
index has been shown in Table 7 .
River: permanent and temporary river water flow
cause erosion to materials around the pipeline. Therefore
the risk score in terms of this index has been shown in
Table 8.
Roadways: Road is one of the main factors in envi-
ronmental sensitivities which has also been studied in
this article. The final risk score for this index is availab le
in Table 9.
Gas Compressor Station: Another increasing factor in
pipeline risk is land use in which gas compressor station
is one of the main factors in this context. Considering
this issue, three stations are located in the kilometers 500,
230 and 30500 of the road. Three station scores are 50
Copyright © 2011 SciRes. JEP
Applying Indexing Method to Gas Pipeline Risk Assessment by Using GIS: a Case Study in Savadkooh, North of Iran 951
Figure 2. Pipeline risk assessment in 500 meter intervals based on mentioned criteria.
Copyright © 2011 SciRes. JEP
Applying Indexing Method to Gas Pipeline Risk Assessment by Using GIS: a Case Study in Savadkooh, North of Iran
952
Table 1. Pipeline approximate incidence with the existing faults.
Kilometer
8/2 8/5 2/70/89/8
2/21 9/19 1/19 8/18 3/18 1/15 8/14 9/12 2/12 05/113/24
1 1 1 1 1 1 1 1 1 1 1 1 1 1 1 Risk Score1
Table 2. Final risk score in terms of underground w a ter index.
To (km) from (km) risk score relative weight Final score 00 + 350 01 + 900 1 5/0 20 + 750 1 28 + 900 5/0 06 + 171
1 5/0 29 + 855 1
5/0
5/0
Table 3. Land corrosion description in terms of different el ectrical re sistivities (Iranian Oil ministry, standard number 925 ).
Electrical Resistivity (Ohm-Cm) Corrosion <500 Very high 1000 - 500 High 2000 - 1000 Moderate 10000 - 2000 Low 10000> Very low
Table 4. Final risk score in terms of corrosion index.
location electrode depth Resistance Corrosion capability
risk
score
relative
weight
final score
00 + 000
5/1
00/3
78/1
43/0
Moderate Corrosion
high corrosion
1 5/0
00 + 996
5/1
00/3
12/2
78/0
Moderate Corrosion
Moderate Corrosion
1
5/0
5/0
Table 5. Final risk score in terms of landslide index.
From (Km) To( km) zoning type risk score relative weight final score
5/0 1 + 700 2 + 800 MH 1
75/0 5 + 300 9 + 900 HH 5/1
5/0 11 + 700 14 + 400 MH 1
5/0 15 + 000 15 + 500 MH 1
5/0 18 + 300 20 + 200 MH 1
75/0
0/5
20 + 200 21 + 300 HH 5/1
MH=Moderate Hazard Zone HH= High Hazard Zone
Table 6. Final risk score in terms of high voltage power transmission lines index.
voltage approximate kilometer of intersection risk score relative weight final score
high voltage
3 + 105
1 5/0
high voltage
7 + 052
1 5/0
high voltage
19 + 683
1
5/0
5/0
Table 7. Final risk score in terms of residential areas.
Town Kilometer Distance ( meter ) Risk Score Relative weight Final score Shirgah 5 + 006 - 6 + 335 500 2 2 Zirab 23+ 654 - 26 +910 0 4 4 Chali 0 + 585 - 1 + 590 150 3 3 Sorkh kola 20 + 397 - 22 + 358 0 4 4 Ghasem abad 21 + 070 - 21 + 262 1000 1 1 Alie Kola 26 + 910 - 28 + 081 0 4 4 Khormandi chal 28 + 448 - 28 + 777 300 2 2 Azadmehr 30 + 055 - 30 + 604 300 2 2 Kordabad 21 + 710 - 22 + 358 500 2
1
2
Copyright © 2011 SciRes. JEP
Applying Indexing Method to Gas Pipeline Risk Assessment by Using GIS: a Case Study in Savadkooh, North of Iran
Copyright © 2011 SciRes. JEP
953
Table 8. final risk score in terms of river index.
waterway
approximate kilometer
of intersection
approximate bed width(m)
risk
score
relative
weight
final score
stream 1 + 790 2 meters main channel 5 meters flood bed1 1
stream 2 + 300
3 meters main channel 12 meters flood
bed
1 1
Kasilian river6 + 171
15 meters main channel and 30 meters
flood bed
2 2
Talar river 22 + 249
50 meters main channel and 80 meters
flood bed
2 2
Talar river 23 + 362
35 meters main channel and 70 meters
flood bed
2 2
Talar river 28 + 188
35 meters main channel and 65 meters
flood bed
2 2
Talar river 28 + 375
30 meters main channel and 60 meters
flood bed
2 2
Talar river 28 + 789
25 meters main channel and 35 meters
flood bed
2 2
Cherat river 29 + 855
20 meters main channel and 40 meters
flood bed
2
1
2
Table 9. Final risk score in terms of rode index.
Road Type Kilometer distance (m) risk score Relative weight total score Soil 3 + 105 intersection 2 1 Soil 3 + 105 – 5 + 188 Vicinity 1 5/0 Soil 17 + 763 intersection 2 1 Soil 20 + 824 intersection 2 1 Asphalted 21+500 - 21+500 Vicinity 1 5/0 Soil 22 + 127 intersection 2 1 Asphalted 23 + 463 - 28 + 463 Vicinity 1
5/0
5/0
presented in Table 10.
Habitat areas: according to the previous studies,
Savadkooh pipeline route passes through the plain, for-
ested hills and mountainous regions. The pipeline crosses
the forest from the kilometer 2 + 500 to 21 + 400 with
about 18 kilometers length. These forest areas with dif-
ferent names and lengths have the same habitat value and
also although there are some protected areas which exist
in the project region, most of these areas have significant
distance to the pipeline.
4. Conclusions
After calculating each interval risk, finally the scores
were accumulated and in order to provide suitable and
homogeneous information for risk management, the
whole route score has been divided into four main sec-
tions and the result is presented in Table 11.
Generally, it is clear by the results that different parts
Table 10. Score distribution of total hazard potential factors.
Soil
displacement
Soil
corrosion
oil pipeline gas pipeline water pipe Factor
0 0 100 - 2000 - 30050050 - 20050800 150 50
Distance to
pipeline (m)
1 1 1 2 1 2 3 1 2 3 Score
Table 11. Ratio of different environmental risks in pipeline length.
Percentage Length (m) Risk Level
63/1 500 no risk
06/36 11000 low risk
22/26 8000 med ium r isk
42/34 10500 high risk
63/1 500 Very high risk
100 30500 Total
Applying Indexing Method to Gas Pipeline Risk Assessment by Using GIS: a Case Study in Savadkooh, North of Iran
954
Table 12. Combination of effective index and environmental sensitivity and the final risk score in the project route.
parameter
distance
(meter)
fault
residen-
tial
compres-
sor station
road
corro-
sion
Under-
ground
Water
riverlanslide
high
voltage
habitat
areas
total
score
risk level risk description
500 3 0.50.5 4 2 medium 1000 3 0.50.5 4 2 medium 1500 3 0.5 3.5 2 medium 2000 3 0.5 1 0.5 5 3 high 2500 1 0.5 1.5 1 low 3000 1 0.5 0.75 2.25 2 medium 3500 1 0.5 0.75 2.25 2 medium 4000 0.5 0.75 1.25 1 low 4500 0.5 0.75 1.25 1 low 5000 0.5 0.75 1.25 1 low 5500 2 0.5
0.75 0.75 4 2 medium 6000 1 2 0.75 0.75 4.5 3 high 6500 2 0.5 2 0.75 0.75 6 3 high 7000 0.75 0.75 1.5 1 low 7500 1 0.750.5 0.75 3 2 medium 8000 1 0.75 0.75 2.5 2 medium 8500 0.75 0.75 1.5 1 low 9000 1 0.75 0.75 2.5 2 medium 9500 0.75 0.75 1.5 1 low 10000 0.75 0.75 1.5 1 low 10500
0.75 0.75 1 low 11000 0.75 0.75 1 low 115001 0.75 1.75 1 low 12000 0.5 0.75 1.25 1 low 125001 0.5 0.75 2.25 2 medium 130001 0.5 0.75 2.25 2 medium 13500 0.5 0.75 1.25 1 low 14000 0.5 0.75 1.25 1 low 14500 0.5 0.75 1.25 1 low 150001
0.75 1.75 1 low 155001 0.5 0.75 2.25 2 medium 16000 0.75 0.75 1 low 16500 0.75 0.75 1 low 17000 0/5 0.75 0.75 1 low 17500 0.75 0.75 1 low 18000 1 0.75 1.75 1 low 185001 0.5 0.75 2.25 2 medium 190001 0.5 0.75 2.25 2 medium 195001 0.5 0.75 2.25 2 medium 200001
0.5 0.75 2.25 2 medium 205001 4 0.5 0.75 6.25 3 high 21000 4 1 0.5 0.75 0.75 7 3 high 21500 4 0.5 0.5 0.75 0.75 6.5 3 high 22000 4 0.5 4.5 3 high 22500 4 1 0.5 2 7.5 3 high 23000 0.5 0.5 1 low 23500 3 0.5 2 5.5 3 high 24000 4 0.5 0.5 5 3 high 245001 4 0.5 0.5 6
3 high 25000 4 0.5 0.5 5 3 high 25500 4 0.5 0.5 5 3 high 26000 4 0.5 0.5 5 3 high 26500 4 0.5 0.5 5 3 high 27000 4 0.5 0.5 5 3 high 27500 4 0.5 0.5 5 3 high 28000 4 0.5 0.5 5 3 high 28500 4 0.5 0.5 2 7 3 high 29000 2 0.5 2 4.5 3 high 29500
0 0 no risk 30000 2 0.5 2 4.5 3 high 30500 2 3 5 3 high
Copyright © 2011 SciRes. JEP
Applying Indexing Method to Gas Pipeline Risk Assessment by Using GIS: a Case Study in Savadkooh, North of Iran 955
in the pipeline have different environmental risk scores
and some parts of the route do not have any risk classifi-
cation. Moreover, the entire project route has the envi-
ronmental risk potential due to the project essence but the
classified intervals have additional environmental risk
compared to the basic mode.
In other words, it can be expressed in this way that the
whole pipeline has the basic risk but the classified inter-
vals have more risks than the base condition.
Different risk classified intervals in the pipeline study
have been presented in Table 12. As it can be seen in this
table, the longest risk class belong s to low and high risks
with rate of 34/42 and 36/06 percentage and then the
average risk with 26/22 percentage of the road is ranked
in the third place.
REFERENCES
[1] N. S. Arunraj and J. Maiti, “Development of Environ-
mental Consequence Index (ECI) Using Fuzzy Composite
Programming,” Journal of Hazardous Materials, Vol.
162, No. 1, 2009, pp. 29-43.
doi:10.1016/j.jhazmat.2008.05.067
[2] “BP Statistical Review of World Energy,” BP, London.
http://www.bp.com/centres/energy.
[3] M. N. Demers, “Fundamental of Geographic Information
Systems,” 3rd Edition, Wily, New York, 2005.
[4] K. D. Prasanta, “An Integrated Assessment Model for
Cross-Country Pipelines,” Environmental Impact As-
sessment Review, Vol. 22, No. 6, 2002, pp. 703-721.
doi:10.1016/S0195-9255(02)00020-3
[5] M. Jabbari, H. Asilian, S. B. Mortazavi, A. Z. Mogaddam,
E. Hajizadeh and A. Khavanin, “Comprehensive Risk
Assessment and Management of Petrochemical Feed and
Product Transportation Pipelines,” Journal of Loss Pre-
vention in the Process Industries, Vol. 22, No. 4, 2009,
pp. 533-539. doi:10.1016/j.jlp.2009.03.008
[6] H. Jafari and S. Karimi, “Site Selection for the Estab-
lishment of Industrial Sites in Qom Province Using GIS,”
Journal of Environmental Studies, Vol. 31, No. 37, 2005,
pp. 6-17.
[7] S. N. Jonkman, et al., “An Overview of Quantitative Risk
Measures for Loss of Life and Economic Damage,” Jour-
nal of Hazardous Materials, Vol. 99, No. 1, 2003, pp.
1-30.
[8] W. K. Muhlbauer, “Pipeline Risk Management Manual,”
2nd Edition, Gulg Professional Publishing, Maryland
Heights, 1999, pp. 423.
[9] K. S. Park, J. H. Lee and Y. D. Jo, “An Approach to Risk
Management of City Gas Pipeline,” Process Safety and
Environmental Protection, Vol. 82, No. 6, 2004, pp.
446-452.
[10] N. Paralikas and A. I. Lygeros, “A Multi-Criteria and
Fuzzy Logic Based Methodology for the Relative Rank-
ing of the Fire Hazard of Chemical Substances and In-
stallations,” Process Safety and Environmental Protection,
Vol. 83, No. 2, 2005, pp. 122-134.
doi:10.1205/psep.04236
[11] M. Salehi Moayed and S. Karimi, “Performance of EIA
study of gas transfer pipeline from Hamedan to Bijar with
focus on using RS and GIS,” Journal of Environmental
Studies, Vol. 33, 2007, pp. 33-44.
[12] Standard Vol. 925, Oil Ministry, National Gas Company
of Iran, 2001.
[13] T. Sydney an d A. D. Richard, “Re view of Way s to Tran s-
port Natural Gas Energy from Countries Which Do Not
Need the Gas for Domestic Use,” Energy, Vol. 28, No. 4,
2003, pp. 1461-1477. doi:10.1109/5254.809566
[14] Z. Y. Han and W. G. Weng, “An Integrated Quantitative
Risk Analysis Method for Natural Gas Pipeline Net-
work,” Journal of Loss Prevention in the Process Indus-
tries, Vol. 23, No. 3, 2010, pp. 428-436.
doi:10.1016/j.jlp.2010.02.003
Copyright © 2011 SciRes. JEP