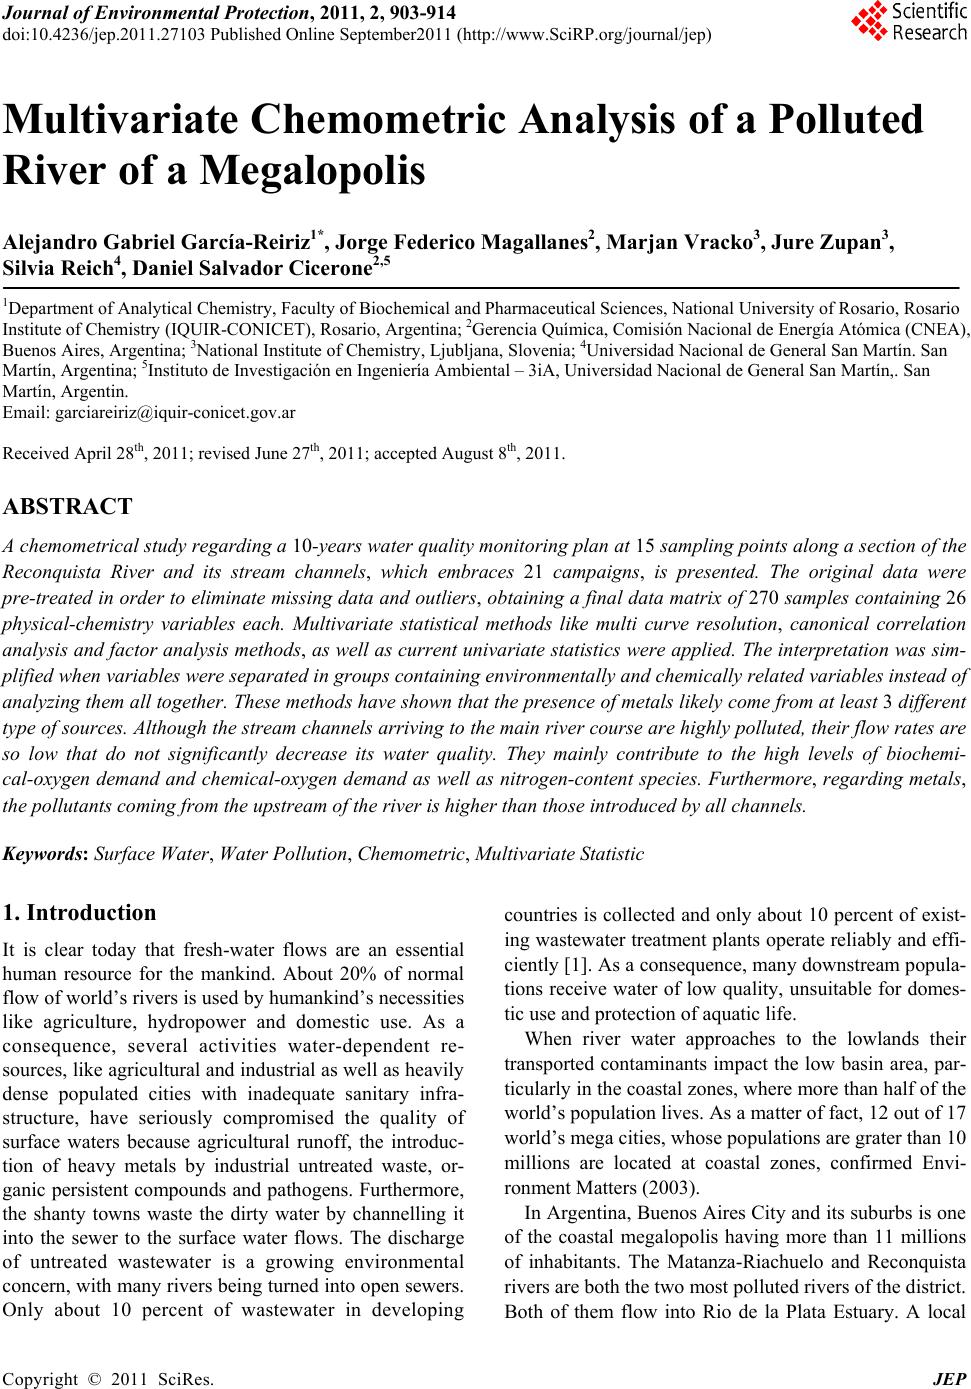
 Journal of Environmental Protection, 2011, 2, 903-914 doi:10.4236/jep.2011.27103 Published Online September2011 (http://www.SciRP.org/journal/jep) Copyright © 2011 SciRes. JEP 903 Multivariate Chemometric Analysis of a Polluted River of a Megalopolis Alejandro Gabriel García-Reiriz1*, Jorge Federico Magallanes2, Marjan Vracko3, Jure Zupan3, Silvia Reich4, Daniel Salvador Cicerone2,5 1Department of Analytical Chemistry, Faculty of Biochemical and Pharmaceutical Sciences, National University of Rosario, Rosario Institute of Chemistry (IQUIR-CONICET), Rosario, Argentina; 2Gerencia Químic a, Comisión Nacional de Energía Atómica (CNEA), Buenos Aires, Argentina; 3National Institute of Chemistry, Ljubljana, Slovenia; 4Universidad Nacional de General San Martín. San Martín, Argentina; 5Instituto de Investigación en Ingeniería Ambiental – 3iA, Universidad Nacional de General San Martín,. San Martín, Argentin. Email: garciareiriz@iquir-conicet.gov.ar Received April 28th, 2011; revised June 27th, 2011; accepted August 8th, 2011. ABSTRACT A chemometrical study regarding a 10-years water quality monitoring plan a t 15 sampling points along a section of the Reconquista River and its stream channels, which embraces 21 campaigns, is presented. The original data were pre-treated in or der to eliminate missing data and outliers , obtaining a final data matrix of 270 samples containing 26 physical-chemistry variables each. Multivariate statistical methods like multi curve resolution, canonical correlation analysis and factor analysis methods, as well as current univariate statistics were applied. The interpretation was sim- plified when varia bles were separated in groups containing environmentally and chemically related variables instead of analyzing them all together. These methods have shown that the presence of metals likely come from at least 3 different type of sources. Although the stream channels arriving to the main river course are highly polluted, their flow rates are so low that do not significantly decrease its water quality. They mainly contribute to the high levels of biochemi- cal-oxygen demand and chemical-oxygen demand as well as nitrogen-content species. Furthermore, regarding metals, the pollutants coming from the upstream of the river is higher than those introduced by all channels. Keywords: Surface Water, Water Pollution, Chemometric, Multivariate Statistic 1. Introduction It is clear today that fresh-water flows are an essential human resource for the mankind. About 20% of normal flow of world’s rivers is used by humankind’s necessities like agriculture, hydropower and domestic use. As a consequence, several activities water-dependent re- sources, like agricultu ral and industrial as well as heavily dense populated cities with inadequate sanitary infra- structure, have seriously compromised the quality of surface waters because agricultural runoff, the introduc- tion of heavy metals by industrial untreated waste, or- ganic persistent compounds and pathogens. Furthermore, the shanty towns waste the dirty water by channelling it into the sewer to the surface water flows. The discharge of untreated wastewater is a growing environmental concern, with many rivers being turned into open sewers. Only about 10 percent of wastewater in developing countries is collected and only about 10 percent of exist- ing wastewater treatment plants operate reliably and effi- ciently [1]. As a consequence, many downstream popula- tions receive water of low quality, unsuitable for domes- tic use and protection of aquatic life. When river water approaches to the lowlands their transported contaminants impact the low basin area, par- ticularly in the coastal zones, where more than half of the world’s population lives. As a matter of fact, 12 out of 17 world’s mega cities, whose populations are grater than 10 millions are located at coastal zones, confirmed Envi- ronment Matters (2003). In Argentina, Buenos Aires City and its suburbs is one of the coastal megalopolis having more than 11 millions of inhabitants. The Matanza-Riachuelo and Reconquista rivers are both the two most polluted rivers of the district. Both of them flow into Rio de la Plata Estuary. A local 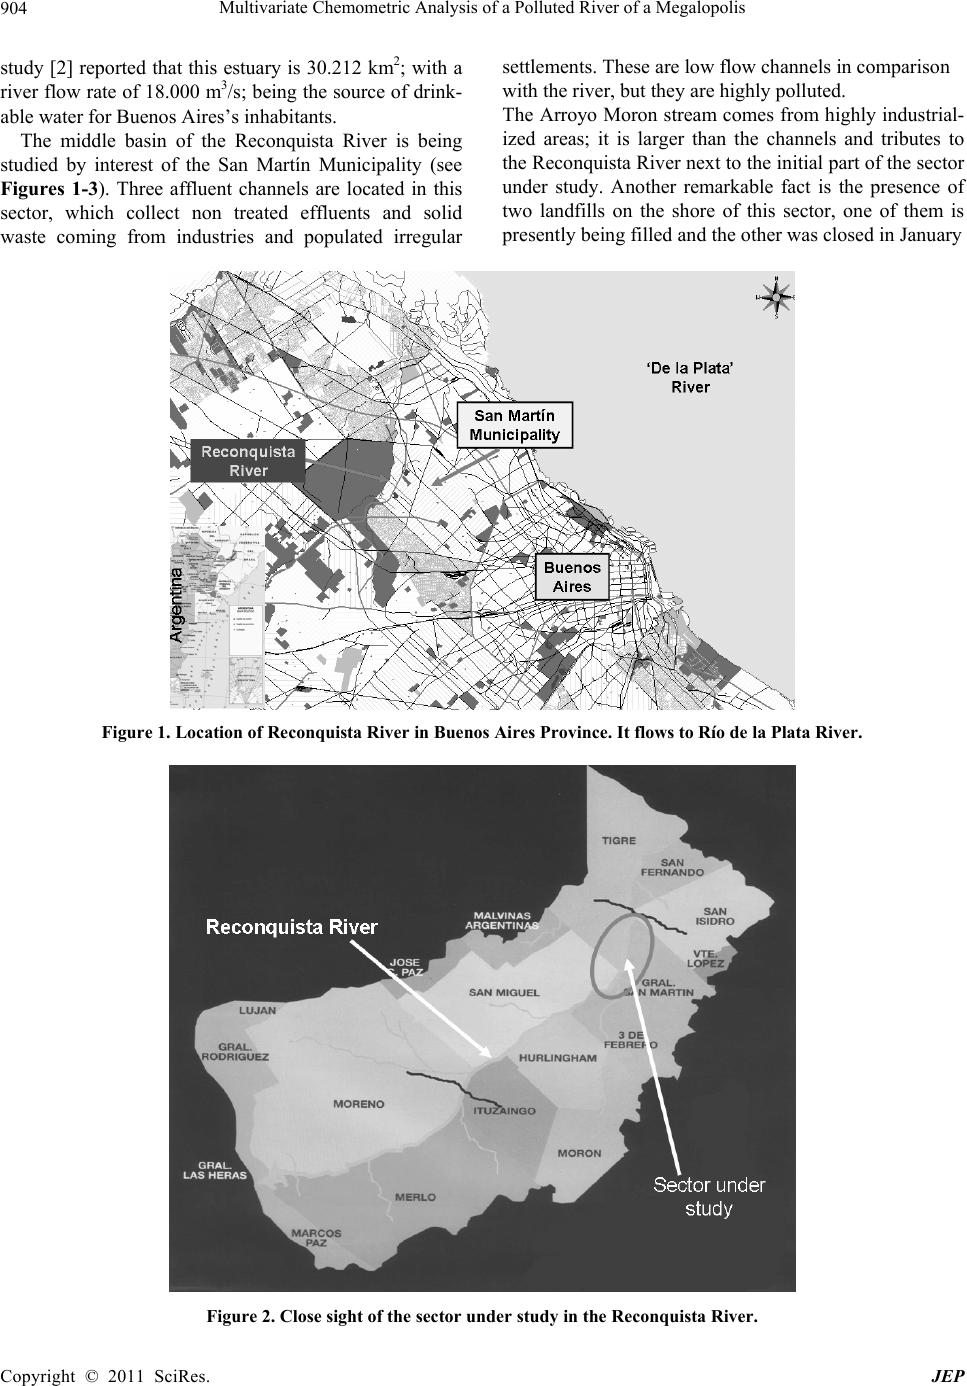 Multivariate Chemometric Analysis of a Polluted River of a Megalopolis 904 study [2] reported that this estuary is 30.212 km2; with a river flow rate of 18.000 m3/s; being the source of drink- able water for Buenos Aires’s inhabitants. The middle basin of the Reconquista River is being studied by interest of the San Martín Municipality (see Figures 1-3). Three affluent channels are located in this sector, which collect non treated effluents and solid waste coming from industries and populated irregular settlements. These are low flow channels in comparison with the river, but they are highly polluted. The Arroyo Moron stream comes from highly industrial- ized areas; it is larger than the channels and tributes to the Reconquista Rive r next to the initial p art of the sector under study. Another remarkable fact is the presence of two landfills on the shore of this sector, one of them is presently being filled and the other was closed in January Figure 1. Location of Reconquista River in Bue nos Ai r es Province. It flows to Río de la Plata River. Figure 2. Close sight of the sector under study in the Reconquista River. Copyright © 2011 SciRes. JEP 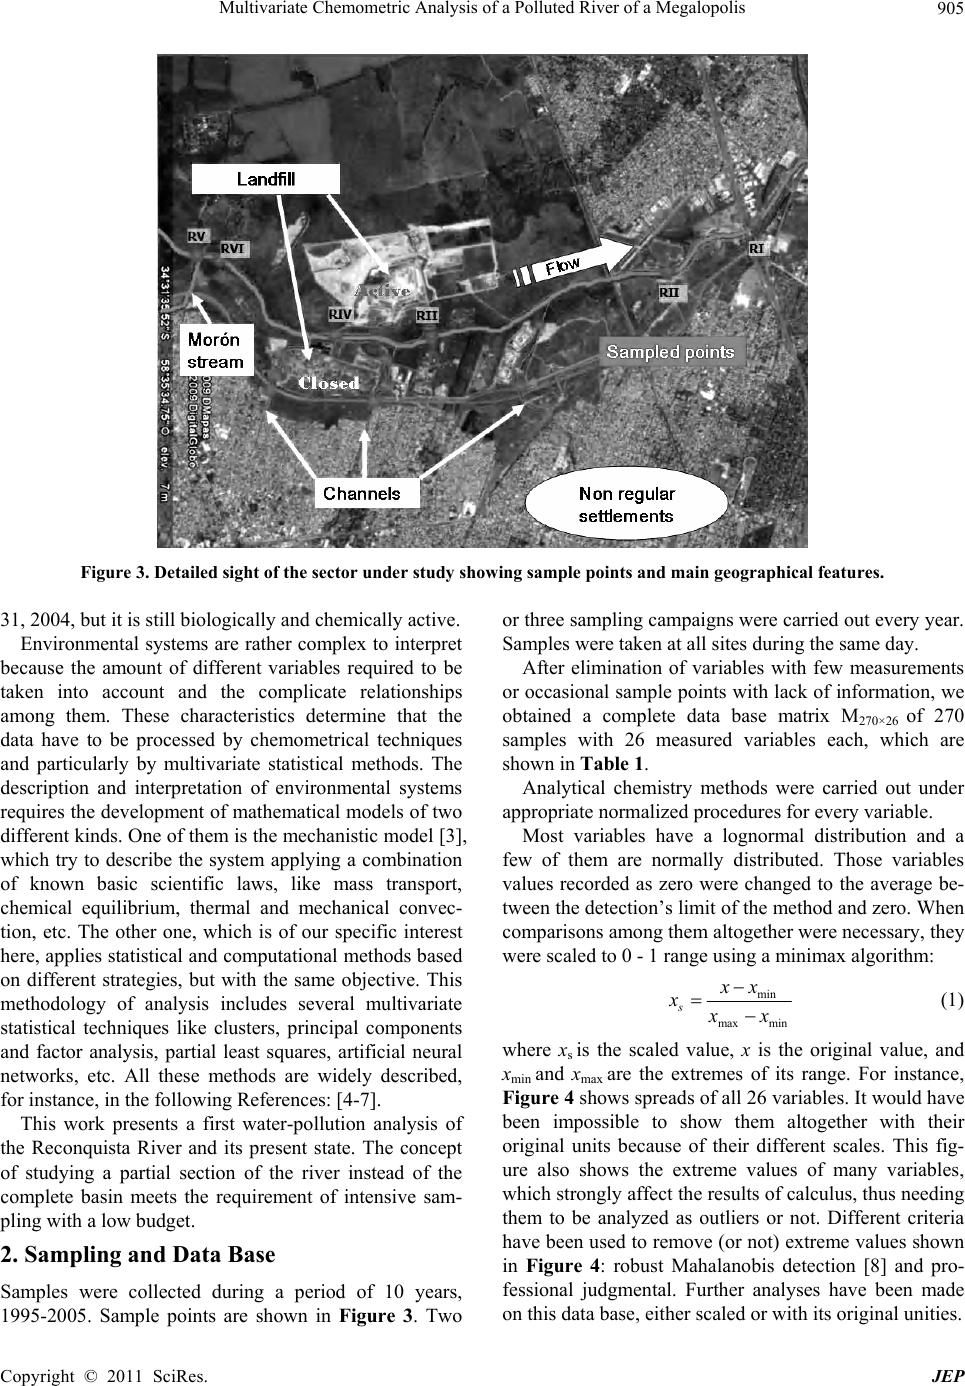 Multivariate Chemometric Analysis of a Polluted River of a Megalopolis905 Figure 3. Detailed sight of the sector under study show ing sample points and main geographical features. 31, 2004, but it is still biologically and chemically active. Environmental systems are rather complex to interpret because the amount of different variables required to be taken into account and the complicate relationships among them. These characteristics determine that the data have to be processed by chemometrical techniques and particularly by multivariate statistical methods. The description and interpretation of environmental systems requires the development of mathe matical models of two different kinds. One of them is the mechanistic model [3], which try to describe the system applying a combination of known basic scientific laws, like mass transport, chemical equilibrium, thermal and mechanical convec- tion, etc. The other one, which is of our specific interest here, applies statistical and computational methods based on different strategies, but with the same objective. This methodology of analysis includes several multivariate statistical techniques like clusters, principal components and factor analysis, partial least squares, artificial neural networks, etc. All these methods are widely described, for instance, in the following References: [4-7]. This work presents a first water-pollution analysis of the Reconquista River and its present state. The concept of studying a partial section of the river instead of the complete basin meets the requirement of intensive sam- pling with a low budget. 2. Sampling and Data Base Samples were collected during a period of 10 years, 1995-2005. Sample points are shown in Figure 3. Two or three sampling campaigns were carried out every year. Samples were taken at all sites during the same day. After elimination of variables with few measurements or occasional sample points with lack of information, we obtained a complete data base matrix M270×26 of 270 samples with 26 measured variables each, which are shown in Table 1. Analytical chemistry methods were carried out under appropriate normalized procedures for every variable. Most variables have a lognormal distribution and a few of them are normally distributed. Those variables values recorded as zero were changed to the average be- tween the detection’s limit of th e method and zero. When comparisons among them altogether were necessary, they were scaled to 0 - 1 range using a minimax algorithm: min max min s xx xxx (1) where xs is the scaled value, x is the original value, and xmin and xmax are the extremes of its range. For instance, Figure 4 shows spreads of all 26 variables. It would have been impossible to show them altogether with their original units because of their different scales. This fig- ure also shows the extreme values of many variables, which strongly affect the results of calculus, thus needing them to be analyzed as outliers or not. Different criteria have been used to remove (or not) extreme values shown in Figure 4: robust Mahalanobis detection [8] and pro- fessional judgmental. Further analyses have been made on this data base, either scaled or with its original unities. Copyright © 2011 SciRes. JEP  Multivariate Chemometric Analysis of a Polluted River of a Megalopolis 906 Table 1. Physical and chemical measured variables and used acronyms. Variable Acronym Alcalinity Al Arsenic As Cloride Cl Conductivity Cl Biochemical oxygen demand BOD Chemical oxygen demand COD Methylene blue active substances MBAS Hardness Phosphorous- as ortophosphate Nitrogen- as amonium N_AMON Nitrites NO2– Nitrates NO3– Organic nitrogen N_ORG Total Kjeldahl nitrogen NTK Disolved oxygen DO pH Total residues after evaporatión TR Total disolved solids Total suspended solids Sedimentable solids at 10' SS10H Sedimentable solids at 2 hs SS2H Sulfate Sulfide S Phenols Turbidity Cadmium Cd Zinc Zn Copper Cu Chromium Cr Iron Fe Manganese Mn Nickel Ni Lead Pb 3. Chemometric Methods of Analysis Multivariate techniques are methods of analysis gener- ally recognized as very well known tools to study envi- ronmental problems [9,10]. From this kind of methods, Multivariate Curve Resolution (MCR) [11,12] has been selected as one of the most advantageous to have a close look of our system. To apply the MCR method, the minimax-scaled-matrix data base M270×26 was reorgan- ized by assembling every sampling campaign as a sub-matrix, which includes all its sampling sites as row vectors. These row vectors embrace the 26 physi- cal-chemistry parameters measured. Not necessarily all these sub-matrixes have the same number of rows, but the same number of columns. Twenty one of these sub-matrixes were stacked to form the matrix D270×26, which contain the data spatially and temporally organ- ized. Then, the matrix D allows MCR to analyze the d ata in space and time dimensions. MCR is a bilinear based method of inverse calibration; it can be basically described as a matrix decomposition: T DSL E (2) where D is th e data matrix, S is the scores matrix related with the objects and L is the load ings matrix related with variables. Every vector of S is associated with a vector of L through a product that represents a component. It is supposed that each component represents a kind of source (or combination of similar sources) which con- tributes to spoil the system. A sketch of the calculus is shown in Figure 5. The bilinear model in Equation (2) assumes that the major sources of the experimental data variance can be explained by a small number of compo- nents defining the two reduced-size factor matrices (scores and loadings). The model described by this equa- tion assumes that the measured concentration of a con- taminant (variable) in a particular sample is the sum of a reduced number of contributions of this contaminant coming from different sources. It is therefore a mixture analysis problem with unknown sources which have to be estimated from the analysis. Since the solution of Equation (2) is ambiguous, the matrix decomposition in this equation has to be performed under some constraints. The decomposition of Equation (2) is similar to Principal Components Analysis (PCA), but PCA decomposition is performed under orthogonal constraints, loadings nor- malization and maximum explained variance for the successive extracted components. Under these con- straints, PCA provides unique solutions. However, these solutions are an abstract linear combination of the true experimental variance sources and, although they are very useful for data exploration and summary, in many cases they can be too complicated in terms of environ- mental interpretation. Although there are many good textbooks about PCA, we address to the interested reader to Jolliffe [13]. Unlike PCA, the matrix bilinear decom- position performed by MCR alternating-least-squares (ALS) uses softer natural constraints and as a result, the interpretation of loading an d score p rofiles are more easy and reasonable from an environmental point of view [9,14]. Constraints used in this work during the MCR- ALS bilinear matrix decomposition were non-negativity and normalization of loadings to equal length as those used in previous works [14]. In this study another applied method was canonical correlation analysis (CCA). It is a way of measuring the linear relationship between two subsets of multidimen- sional variables. It begin when the original data set of n variables and p objects are grouped into two data sets, Copyright © 2011 SciRes. JEP 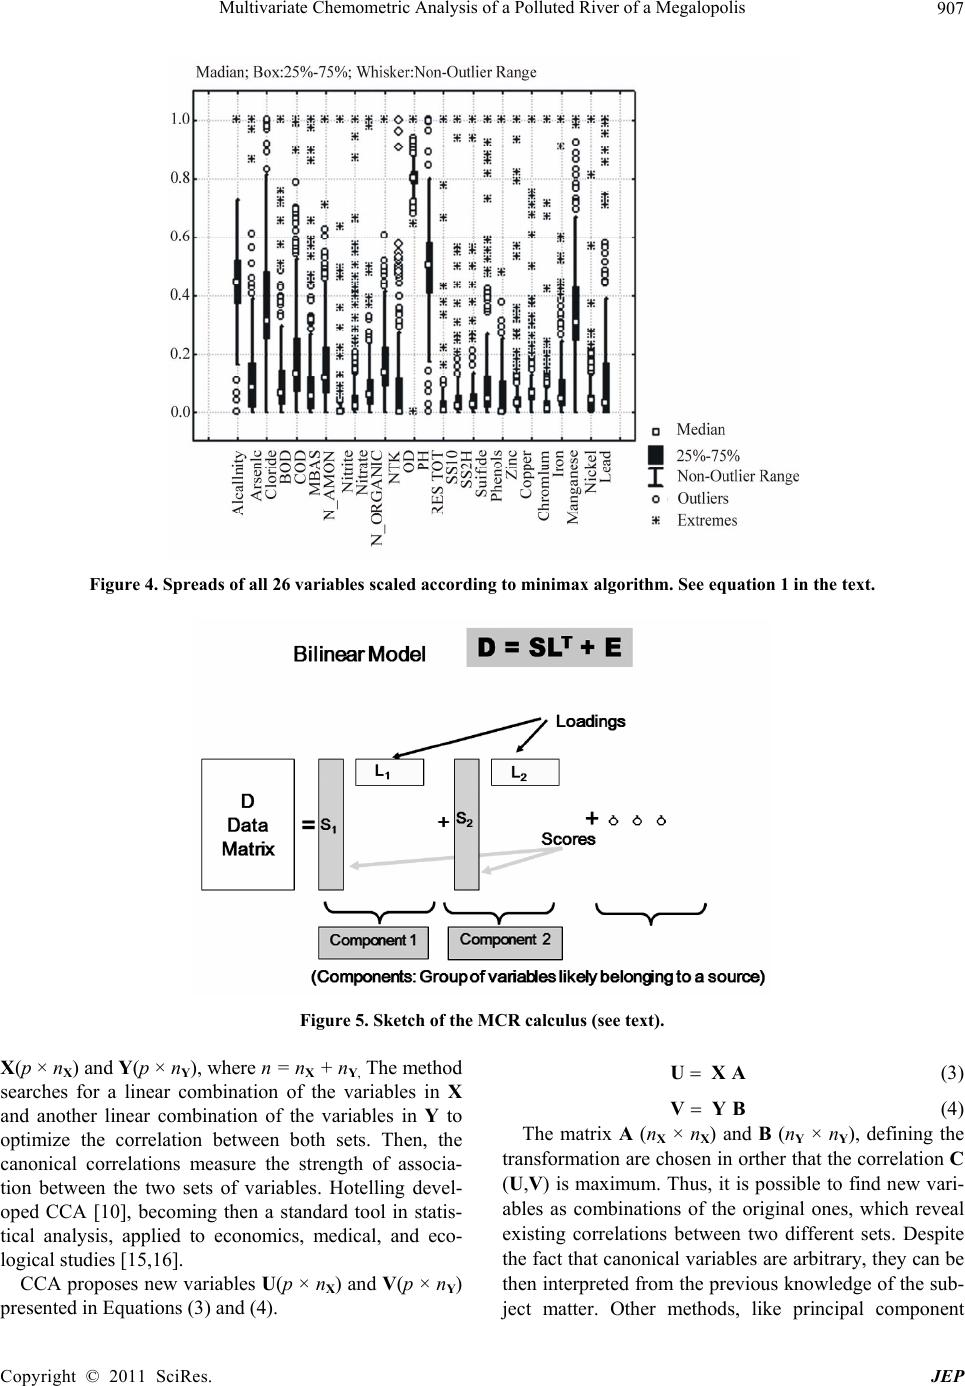 Multivariate Chemometric Analysis of a Polluted River of a Megalopolis 907 Figure 4. Spreads of all 26 variables scaled according to minimax algorithm. See equation 1 in the text. Figure 5. Sketch of the MCR calculus (see te xt). X(p × nX) and Y(p × nY), where n = nX + nY, The method searches for a linear combination of the variables in X and another linear combination of the variables in Y to optimize the correlation between both sets. Then, the canonical correlations measure the strength of associa- tion between the two sets of variables. Hotelling devel- oped CCA [10], becoming then a standard tool in statis- tical analysis, applied to economics, medical, and eco- logical studies [15,16]. CCA proposes new va riables U(p × nX) and V(p × nY) presented in Equations (3) and (4). UXA (3) VYB (4) The matrix A (nX × nX) and B (nY × nY), defining the transformation are chosen in orther that the correlation C (U,V) is maximum. Thus, it is possible to find new vari- ables as combinations of the original ones, which reveal existing correlations between two different sets. Despite the fact that canonical variables are arbitrary, they can be then interpreted from the previous knowledge of the sub- ject matter. Other methods, like principal component Copyright © 2011 SciRes. JEP 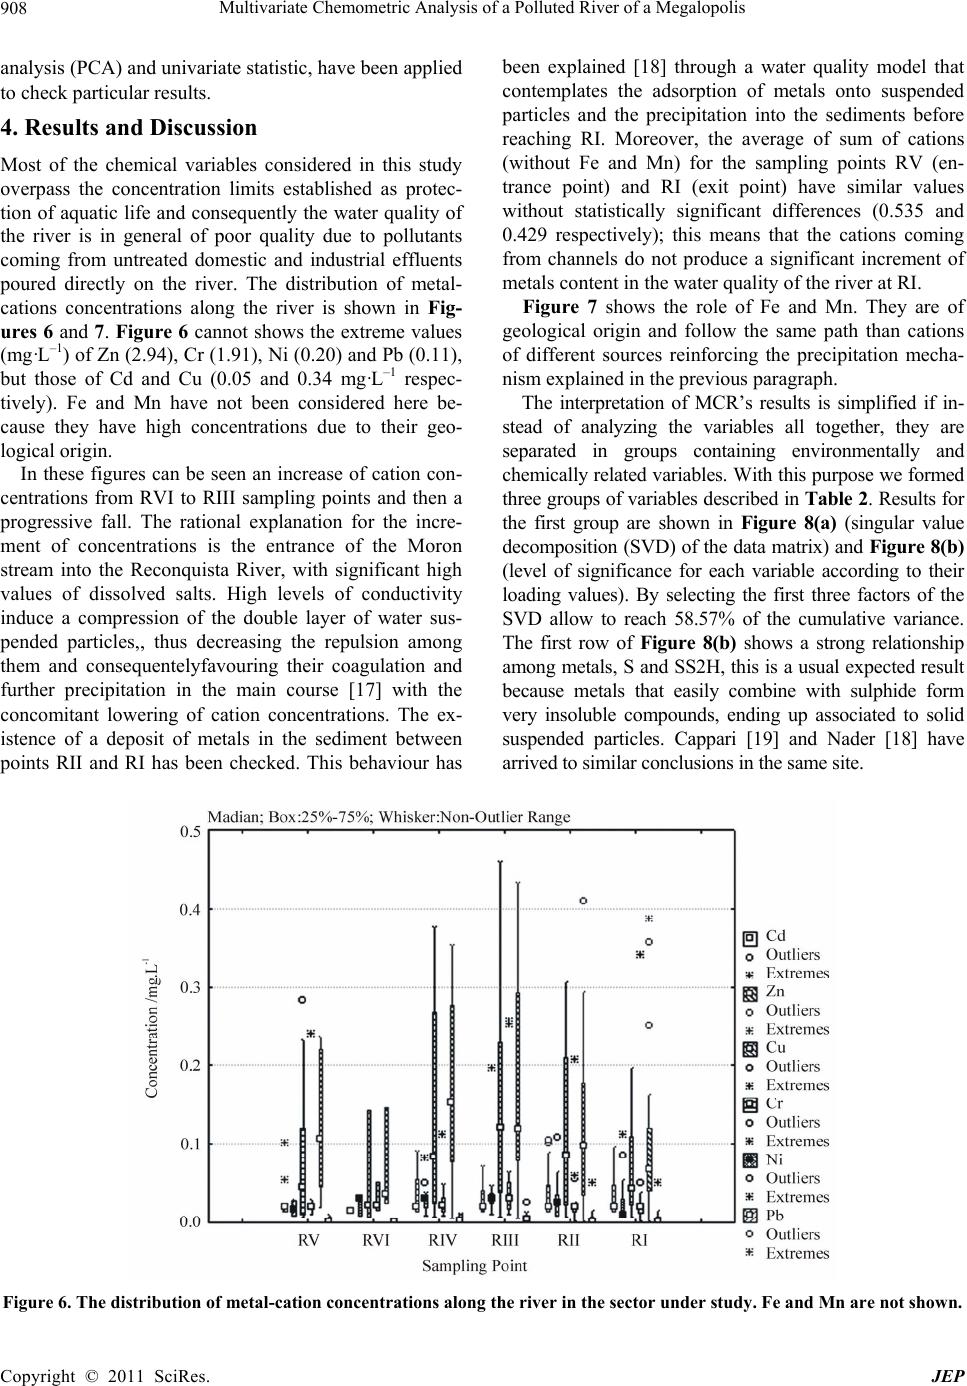 Multivariate Chemometric Analysis of a Polluted River of a Megalopolis 908 analysis (PCA) and univariate statistic, have been applied to check particular results. 4. Results and Discussion Most of the chemical variables considered in this study overpass the concentration limits established as protec- tion of aquatic life and consequently the water quality of the river is in general of poor quality due to pollutants coming from untreated domestic and industrial effluents poured directly on the river. The distribution of metal- cations concentrations along the river is shown in Fig- ures 6 and 7. Figure 6 cannot shows the extreme values (mg·L–1) of Zn (2.94), Cr (1.91), Ni (0.20) and Pb (0 .11), but those of Cd and Cu (0.05 and 0.34 mg·L–1 respec- tively). Fe and Mn have not been considered here be- cause they have high concentrations due to their geo- logical origin. In these figures can be seen an increase of cation con- centrations from RVI to RIII sampling points and then a progressive fall. The rational explanation for the incre- ment of concentrations is the entrance of the Moron stream into the Reconquista River, with significant high values of dissolved salts. High levels of conductivity induce a compression of the double layer of water sus- pended particles,, thus decreasing the repulsion among them and consequentelyfavouring their coagulation and further precipitation in the main course [17] with the concomitant lowering of cation concentrations. The ex- istence of a deposit of metals in the sediment between points RII and RI has been checked. This behaviour has been explained [18] through a water quality model that contemplates the adsorption of metals onto suspended particles and the precipitation into the sediments before reaching RI. Moreover, the average of sum of cations (without Fe and Mn) for the sampling points RV (en- trance point) and RI (exit point) have similar values without statistically significant differences (0.535 and 0.429 respectively); this means that the cations coming from channels do not produce a significant increment of metals content in the water quality of the river at RI. Figure 7 shows the role of Fe and Mn. They are of geological origin and follow the same path than cations of different sources reinforcing the precipitation mecha- nism explained in the previous paragr aph. The interpretation of MCR’s results is simplified if in- stead of analyzing the variables all together, they are separated in groups containing environmentally and chemically rela ted variables. W ith this purpose we formed three groups of variables described in Table 2. Results for the first group are shown in Figure 8(a) (singular value decomposition (SVD) of the data matrix) and Figure 8(b) (level of significance for each variable according to their loading values). By selecting the first three factors of the SVD allow to reach 58.57% of the cumulative variance. The first row of Figure 8(b) shows a strong relationship among metals, S and SS2H, this is a usual expected result because metals that easily combine with sulphide form very insoluble compounds, ending up associated to solid suspended particles. Cappari [19] and Nader [18] have arrived to similar conclusions in t he same site. Figure 6. The distribution of metal-cation concentrations along the river in the sector under study. Fe and Mn are not shown. Copyright © 2011 SciRes. JEP 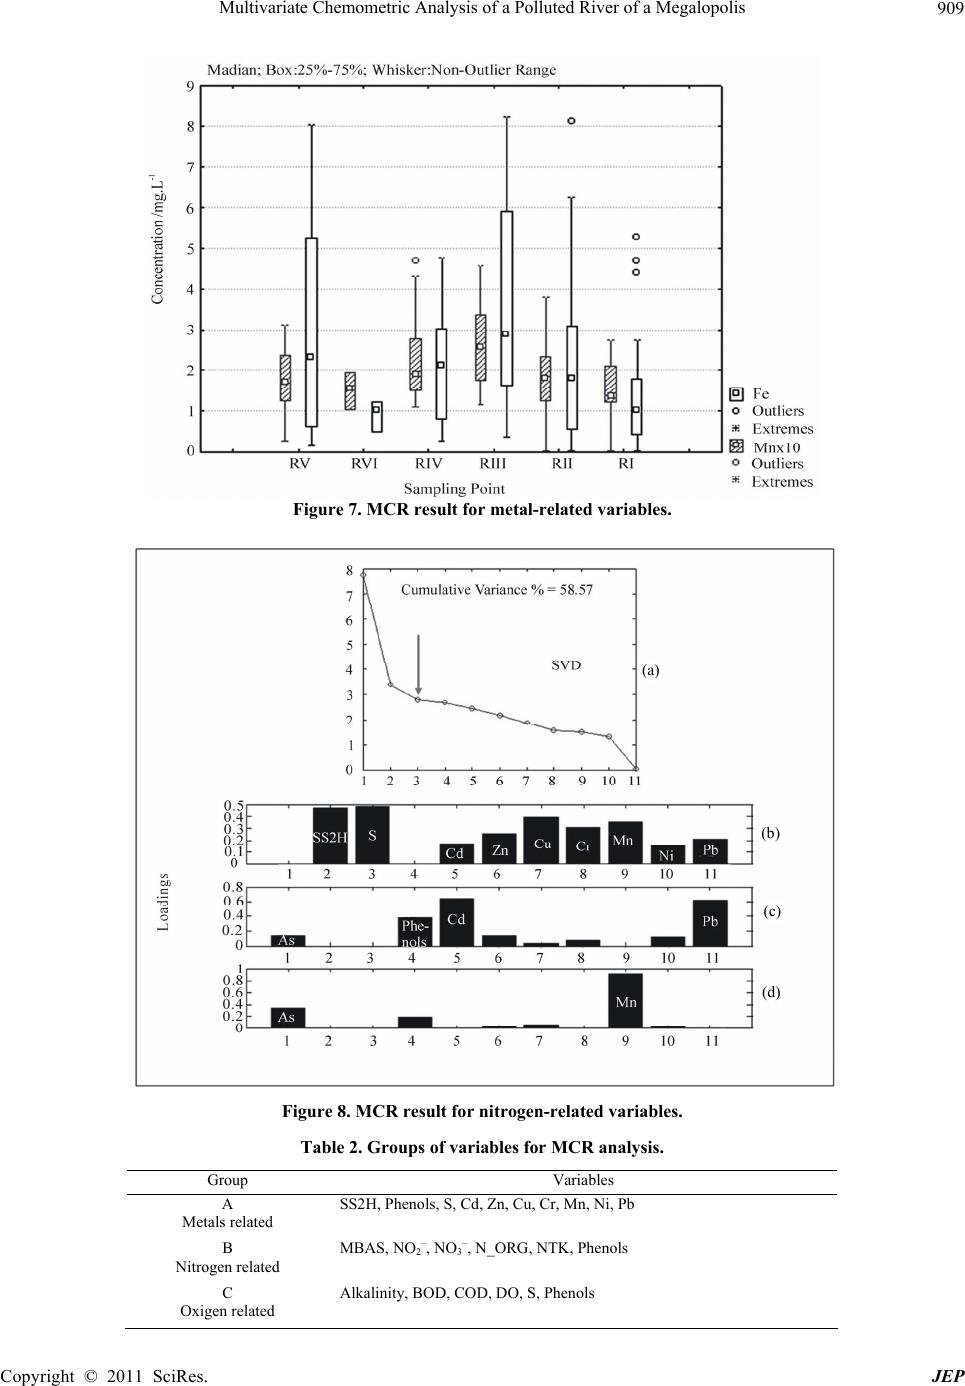 Multivariate Chemometric Analysis of a Polluted River of a Megalopolis909 Figure 7. MCR result for metal-related variables. Figure 8. MCR result for nitrogen-related variables. Table 2. Groups of variables for MCR analysis. Group Variables A Metals related SS2H, Phenols, S, Cd, Zn, Cu, Cr, Mn, Ni, Pb B Nitrogen related MBAS, NO2–, NO3–, N_ORG, NTK, Phenols C Oxigen related Alkalinity, BOD, COD, DO, S, Phenols (d) (c) (b) (a) Copyright © 2011 SciRes. JEP 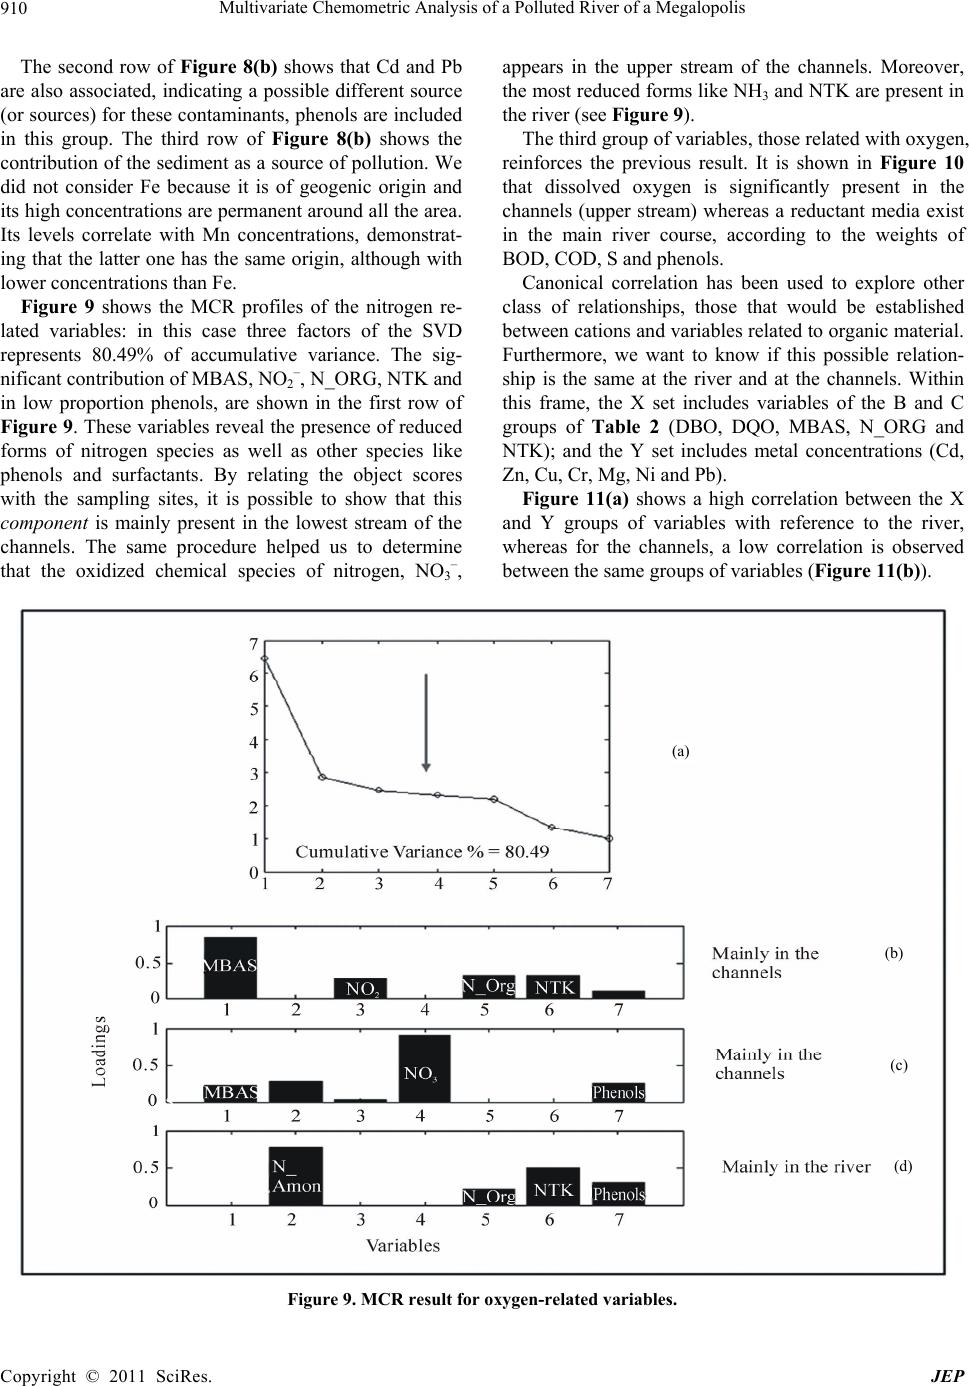 Multivariate Chemometric Analysis of a Polluted River of a Megalopolis 910 The second row of Figure 8(b) shows that Cd and Pb are also associated, indicating a possible different source (or sources) for these contaminants, phenols are included in this group. The third row of Figure 8(b) shows the contribution of the sed iment as a source of pollution. We did not consider Fe because it is of geogenic origin and its high concentrations are permanent around all the area. Its levels correlate with Mn concentrations, demonstrat- ing that the latter one has the same origin, although with lower concentratio ns than Fe. Figure 9 shows the MCR profiles of the nitrogen re- lated variables: in this case three factors of the SVD represents 80.49% of accumulative variance. The sig- nificant contribution of MBAS, NO2–, N_ORG, NTK and in low proportion phenols, are shown in the first row of Figure 9. These variables reveal the presence of reduced forms of nitrogen species as well as other species like phenols and surfactants. By relating the object scores with the sampling sites, it is possible to show that this component is mainly present in the lowest stream of the channels. The same procedure helped us to determine that the oxidized chemical species of nitrogen, NO3–, appears in the upper stream of the channels. Moreover, the most reduced forms like NH3 and NTK are present in the river (see Figure 9). The third group of variables, those related with oxygen, reinforces the previous result. It is shown in Figure 10 that dissolved oxygen is significantly present in the channels (upper stream) whereas a reductant media exist in the main river course, according to the weights of BOD, COD, S and phenols. Canonical correlation has been used to explore other class of relationships, those that would be established between cations and variables related to organic material. Furthermore, we want to know if this possible relation- ship is the same at the river and at the channels. Within this frame, the X set includes variables of the B and C groups of Table 2 (DBO, DQO, MBAS, N_ORG and NTK); and the Y set includes metal concentrations (Cd, Zn, Cu, Cr, Mg, Ni and Pb). Figure 11(a) shows a high correlation between the X and Y groups of variables with reference to the river, whereas for the channels, a low correlation is observed between the same groups of variables (Figure 11(b)). (a) (b) (c) (d) Figure 9. MCR result for oxygen-related variables. Copyright © 2011 SciRes. JEP 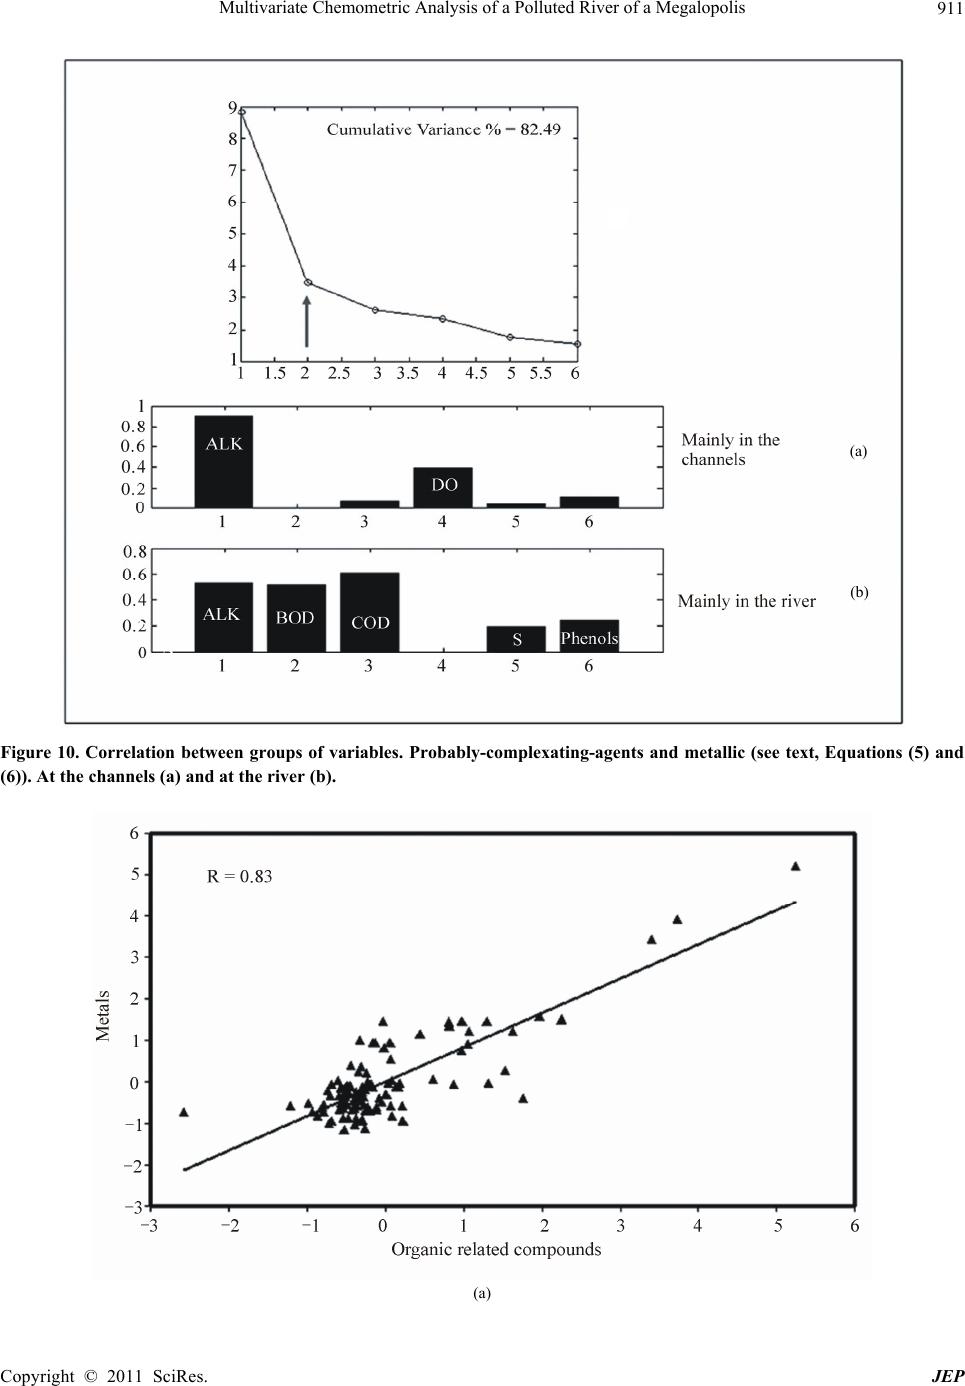 Multivariate Chemometric Analysis of a Polluted River of a Megalopolis911 (a) ( ) Figure 10. Correlation between groups of variables. Probably-complexating-agents and metallic (see text, Equations (5) and (6)). At the channels (a) and at the river (b). (a) Copyright © 2011 SciRes. JEP 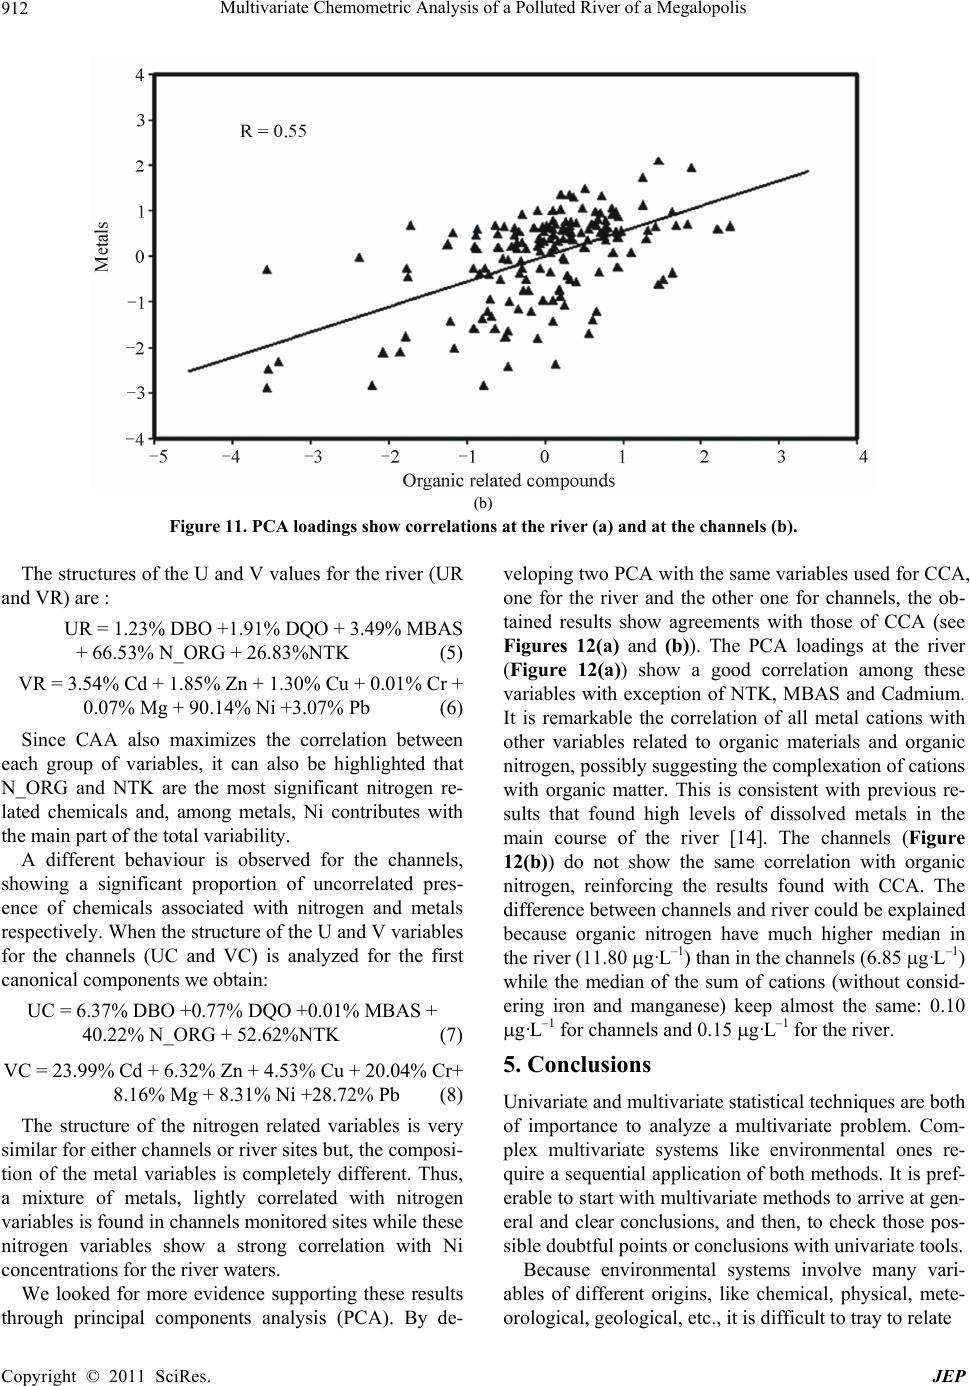 Multivariate Chemometric Analysis of a Polluted River of a Megalopolis Copyright © 2011 SciRes. JEP 912 (b) Figure 11. PCA loadings show correlations at the river (a) and at the channels (b). The structures of the U and V values for the river (UR and VR) are : UR = 1.23% DBO +1.91% DQO + 3.49% MBAS + 66.53% N_ORG + 26.83%NTK (5) VR = 3.54% Cd + 1.85% Zn + 1.30% Cu + 0.01% Cr + 0.07% Mg + 90.14% Ni +3.07% Pb (6) Since CAA also maximizes the correlation between each group of variables, it can also be highlighted that N_ORG and NTK are the most significant nitrogen re- lated chemicals and, among metals, Ni contributes with the main part of the total variability. A different behaviour is observed for the channels, showing a significant proportion of uncorrelated pres- ence of chemicals associated with nitrogen and metals respectively. When the structure of the U and V variables for the channels (UC and VC) is analyzed for the first canonical components we obtain: UC = 6.37% DBO +0.77% DQO +0.01% MBAS + 40.22% N_ORG + 52.62%NTK (7) VC = 23.99% Cd + 6.32% Zn + 4.53% Cu + 20.04% Cr + 8.16% Mg + 8.31% Ni +28.72% Pb (8) The structure of the nitrogen related variables is very similar for either channels or river sites but, the composi- tion of the metal variables is completely different. Thus, a mixture of metals, lightly correlated with nitrogen variables is found in channels monitored sites while these nitrogen variables show a strong correlation with Ni concentrations for the river waters. We looked for more evidence supporting these results through principal components analysis (PCA). By de- veloping two PCA with the same variab les used for CCA, one for the river and the other one for channels, the ob- tained results show agreements with those of CCA (see Figures 12(a) and (b)). The PCA loadings at the river (Figure 12(a)) show a good correlation among these variables with exception of NTK, MBAS and Cadmium. It is remarkable the correlation of all metal cations with other variables related to organic materials and organic nitrogen, possibly suggesting the co mplexation of cations with organic matter. This is consistent with previous re- sults that found high levels of dissolved metals in the main course of the river [14]. The channels (Figure 12(b)) do not show the same correlation with organic nitrogen, reinforcing the results found with CCA. The difference between channels and river could be explained because organic nitrogen have much higher median in the river (11.80 g·L–1) than in the channels (6.85 g·L–1) while the median of the sum of cations (without consid- ering iron and manganese) keep almost the same: 0.10 g·L–1 for channels and 0.15 g·L–1 for the river. 5. Conclusions Univariate and multivariate statistical techniques are both of importance to analyze a multivariate problem. Com- plex multivariate systems like environmental ones re- quire a sequential application of both methods. It is pref- erable to start with multivariate methods to arrive at gen- eral and clear conclusions, and then, to check those pos- sible doubtful points or conclusions wi t h u nivari a te to ols. Because environmental systems involve many vari- ables of different origins, like chemical, physical, mete- orological, geological, etc., it is difficult to tray to relate 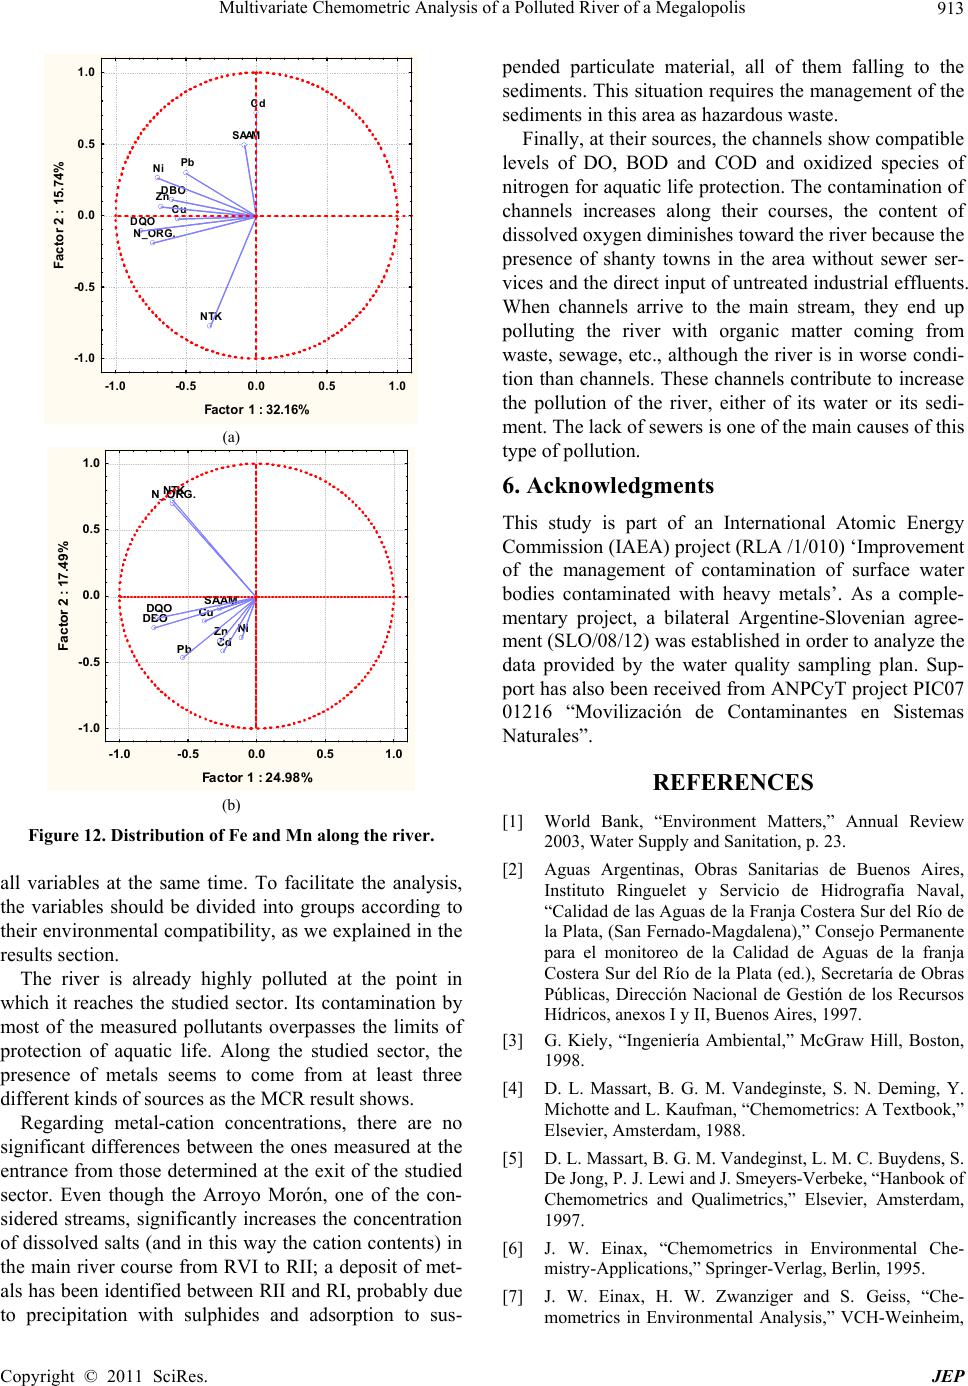 Multivariate Chemometric Analysis of a Polluted River of a Megalopolis913 DBO DQO SAAM N_ORG. NTK Cd Zn Cu Ni Pb -1.0 -0.50.00.51.0 Factor 1 : 32.16% -1. 0 -0. 5 0.0 0.5 1.0 Factor 2 : 15.74% (a) DBO DQO SAAM N_ORG . NTK Cd Zn Cu Ni Pb -1.0 -0.50.00.51.0 Fac tor 1 : 2 4.98% -1.0 -0.5 0.0 0.5 1.0 Fa c tor 2 : 1 7 .49% (b) Figure 12. Distribution of Fe and Mn along the river. all variables at the same time. To facilitate the analysis, the variables should be divided into groups according to their environmental compatibility, as we exp lained in the results section. The river is already highly polluted at the point in which it reaches the studied sector. Its contamination by most of the measured pollutants overpasses the limits of protection of aquatic life. Along the studied sector, the presence of metals seems to come from at least three different kinds of sources as the MCR result shows. Regarding metal-cation concentrations, there are no significant differences between the ones measured at the entrance from those determined at the exit of the studied sector. Even though the Arroyo Morón, one of the con- sidered streams, significantly increases the concentration of dissolved salts (and in this way the cation contents) in the main river course from RVI to RII; a deposit of met- als has been identified between RII and RI, probably due to precipitation with sulphides and adsorption to sus- pended particulate material, all of them falling to the sediments. This situation requires the management of the sediments in this area as hazardous waste. Finally, at their sources, th e channels show compatible levels of DO, BOD and COD and oxidized species of nitrogen for aquatic life pro tection. The contamination of channels increases along their courses, the content of dissolved oxygen diminishes toward the river because the presence of shanty towns in the area without sewer ser- vices and the direct input of untreated industrial effluents. When channels arrive to the main stream, they end up polluting the river with organic matter coming from waste, sewage, etc., although the river is in worse condi- tion than channels. These chan nels contribute to increase the pollution of the river, either of its water or its sedi- ment. The lack of sewers is one of the main causes of this type of pollution. 6. Acknowledgments This study is part of an International Atomic Energy Commission (IAEA) project (RLA /1/010) ‘Improvement of the management of contamination of surface water bodies contaminated with heavy metals’. As a comple- mentary project, a bilateral Argentine-Slovenian agree- ment (SLO/08/12) was established in order to analyze the data provided by the water quality sampling plan. Sup- port has also been received from ANPCyT project PIC07 01216 “Movilización de Contaminantes en Sistemas Naturales”. REFERENCES [1] World Bank, “Environment Matters,” Annual Review 2003, Water Supply and Sanitation, p. 23. [2] Aguas Argentinas, Obras Sanitarias de Buenos Aires, Instituto Ringuelet y Servicio de Hidrografía Naval, “Calidad de las Aguas de la Franja Costera Sur del Río de la Plata, (San Fernado-Magdalena),” Consejo Permanente para el monitoreo de la Calidad de Aguas de la franja Costera Sur del Río de la Plata (ed.), Secretaría de Obras Públicas, Dirección Nacional de Gestión de los Recursos Hídricos, anexos I y II, Buenos Aires, 1997. [3] G. Kiely, “Ingeniería Ambiental,” McGraw Hill, Boston, 1998. [4] D. L. Massart, B. G. M. Vandeginste, S. N. Deming, Y. Michotte and L. Kaufman, “Chemometrics: A Textbook,” Elsevier, Amsterdam, 1988. [5] D. L. Massart, B. G. M. Vandeginst, L. M. C. Buydens, S. De Jong, P. J. Lewi and J. Smeyers-Verbeke, “Hanbook of Chemometrics and Qualimetrics,” Elsevier, Amsterdam, 1997. [6] J. W. Einax, “Chemometrics in Environmental Che- mistry-Applications,” Springer-Verlag, Berlin, 1995. [7] J. W. Einax, H. W. Zwanziger and S. Geiss, “Che- mometrics in Environmental Analysis,” VCH-Weinheim, Copyright © 2011 SciRes. JEP  Multivariate Chemometric Analysis of a Polluted River of a Megalopolis Copyright © 2011 SciRes. JEP 914 Germany, 1997. [8] S. Verboven and M. Hubert, “Libra: A Matlab Library for Robust Analysis,” Chemometrics and Intelligent Labora- tory Systems, Vol. 75, No. 2, 2005, pp. 127-136. doi:10.1016/j.chemolab.2004.06.003 [9] M. Felipe-Sotelo, L. Gustems, I. Hernández, M. Terrado and R. Tauler, “Investigation of Geographical and Tem- poral Distribution of Tropospheric Ozone in Catalonia (North-East Spain) during the period 2000-2004 Using Multivariate Data Analysis Methods,” Atmospheric En- vironment, Vol. 40, No. 38, 2006, pp. 7421-7436. doi:10.1016/j.atmosenv.2006.07.013 [10] H. Hotelling, “Relations between Two Sets of Variates,” Biometrika, Vol. 28, No. 3-4, 1936, pp. 321-377. [11] R. Tauler, “Multivariate Curve Resolution Applied to Second Order Data,” Chemometrics and Intelligent Laboratory Systems, Vol. 30, No. 1, 1995, pp.133-146. doi:10.1016/0169-7439(95)00047-X [12] R. Tauler, A. Smilde and B. Kowalski, “Selectivity, Local Rank, 3-Way Data Analysis and Ambiguity in Multivari- ate Curve Resolution,” Journal of Chemometrics, Vol. 9, No. 1, 1995, pp. 31-58. doi:10.1002/cem.1180090105 [13] T. Jolliffe, “Principal Component Analysis,” Springer- Verlag, New York, 2002, p. 26. [14] M. Terrado, D. Barceló and R. Tauler, “Quality Assess- ment of the Multivariate Curve Resolution Alternating Least Squares (MCR-ALS) Method for the Investigation of Environmental Pollution Patterns,” Environmental Science & Technology, Vol. 43, No. 14, 2009, pp. 5321-5326. doi:10.1021/es803333s [15] C. J. F. Ter Braak, “Canonical Correspondence Analysis: A New Eigenvector Technique for Multivariate Direct Gradient Analysis,” Ecology, Vol. 67, No. 5, 1986, pp. 1167-1170. [16] S. Becker, “Mutual Information Maximization: Models of Cortical Self-Organization Network,” Computation in Neural Systems, Vol. 7, No. 1, 1996, pp. 7-31. [17] W. Stum and J. Morgan, “Aquatic Chemistry. Chemical Equilibria and Rates in Natural Waters,” 3rd Edition, John Wiley & Sons, Inc., New York, 1995. [18] G. Nader, “Modelización del Transporte de Metales en el río Reconquista (entre ex ruta 8 y Panamericana): Etapas de Conceptualización, Formulación y Calibración,” Ph.D. Dissertation, Universidad Nacional De San Martín, San Martín, 2009. [19] G. Cappari, “Evaluación de la Calidad de Agua Superficial del Río Reconquista a la Altura del Partido de San Martín Mediante Estudios Ecotoxicológicos en dos Oportunidades de Muestreo (2007-2008) y Caracte- rización de los Sedimentos Obtenidos en el Mismo Tramo de la Cuenca,” Ph.D. Dissertation, Universidad Nacional De San Martín, San Martín, 2008.
|