 Journal of Environmental Protection, 2011, 2, 867-872 doi:10.4236/jep.2011.27098 Published Online September 2011 (http://www.SciRP.org/journal/jep) Copyright © 2011 SciRes. JEP 867 Treatment of Swine Slurry by an Ozone Treatment System to Reduce Odor A. R. Omer, Paul M. Walker Department of Agriculture, Illinois State University, Normal, USA. Email: pwalker@ilstu.edu Received May 12th, 2011; revised June 17th, 2011; accepted July 21th, 2011. ABSTRACT Development of a technology that can reduce the odor of liquid swine manure during agitation and land application could prove beneficial to the swine industry. The purpose of this study was to evaluate a commercial ozone treatment system for swine slurry under production scale cond itions. The facility used for this study was a curtain sided finishing building housing 500 grow–fi nis h m arket ho gs loc at ed ove r a man ure pi t measuring 12.2 m wide × 25.9 m long × 2.4 m deep with a total pit capacity of 770,142 l, containing 577,607 l. The system evaluated exposes air to ultra-violet light creating O3. The O3 is then injected into slurry at a rate of 851.6 l/min. treating 51,097 l/h. In this study the entire pit contents were treated every 11.3 h. At 0, 24, 48, and 96 h two slurry samples were collected with a 3.05 m probe and six air sample bags were collected via a vacuum pump. No significant differences were detected in slurry samples between time periods. Mean slurry values were 13.6 ± 4.6% solids dry wt., 850 ± 70 mg/l settable solids, 54,200 ± 4384 mg/l total suspended so lids, 61,050 ± 12,657 mg/l chemical oxygen demand, 0.86 ± 0.14%N, 0.49 ± 0.27%P, 0.45 ± 0.01%K and dissolved oxygen below detection limits. Ammonia concentrations decreased (P = 0.004) from 0 to 96 h. Odor pan- elists analyzed air samples for intensity at recognition (IR), offensiveness at recognitio n (OR), intensity at full strength (IFS) and offensiveness at full strength (OFS). Panelists fou nd OR, IFS and OFS were reduced (P < 0.01) at 48 h and 96 h compared to 0 h and IR was reduced (P < 0.04) at 24 h and 48 h and not at 96 h but trended lower (P = 0.12) at 96 h. The system evaluated significantly improved air quality within the building suggesting that odor emanating from swine buildings and odo r generated during land application of slurry shou ld be reduced. Keywords: Swine Slurry, Odor, Treatment, Ozone 1. Introduction Concentrated manure odors within the swine industry can be partially attributed to the replacement of bedding with the slatted floor-pit system. Swine slurry collected by the slatted floor system is subject to anaerobic conditions producing anaerobic bacteria, a common source of odors [1]. Fermentation by anaerobic microbes leads to the production of volatile fatty acids, ammonia, amines, in- doles, phenolics, and volatile sulfur compounds [2]. Out of the 168 compounds found in livestock waste, 30 compounds are most likely to cause odors [3]. Of those 30 compounds: volatile fatty acids, p-cresol, indole, ska- tole, diacetyl and ammonia are found in high concentra- tions and have low detection thresholds (> 0.001mg·m–³). Options for reducing swine slurry odor are limited. Chemical odor control can be expensive and most cost effectively used as an additive to other methods [1]. Ozone combined with ultra-violet (UV) light can form a powerful oxidant [4] that can be used to destroy the cell walls and cytoplasmic membranes of odor causing bacte- ria [5]. A 1 g/l dosage of ozone has been shown to reduce swine slurry odor and be more effective than stripping with nitrogen or oxidizing with O2 [6]. Ozonation facili- ties in the United States have become more common and have been shown to provide a safe treatment option for municipal waste water [4]. However, most ozone treat- ment systems are too expensive for use in livestock op- erations. Increased levels of odor can reduce growth and in- crease susceptibility to disease in swine housing units. Nuisance odors from agriculture such as swine slurry could have psychological affects [7]. Cognitive per- formance and physiological response can be affected by strong odors [8]. The transformation within the swine industry from smaller producers to large concentrated animal feeding operations (CAFO) will continue to accumulate large  Treatment of Swine Slurry by an Ozone Treatment System to Reduce Odor 868 quantities of swine slurry resulting in land-limited- conditions [9]. Integrated swine production and increased urbanization leads to an increase in complaints and con- cerns about air quality. Warranted regulation due to soci- ety concerns has been hindered by the lack of federal guidelines caused by difficulty in defining odor limits including measurement and evaluation. Odor is presently considered a nuisance that is handled by local and state agencies based on public complaints [2]. Advancement in technologies that utilize ozonation to reduce odor dur- ing storage and application of swine slurry could lead the livestock (swine) industry to prevent potential health problems and complaints, as well as meet future regula- tion. Little research has been conducted on production scale ozone treatment systems that are capable of reducing swine slurry odor during storage and subsequent land application. Smart Earth Technologies® Manure Odor Control Unit (MOC) may reduce the intensity and/or offensiveness of odor produced from swine slurry. The MOC system was originally designed and is currently used to treat bacteria and prevent odor of waste wash water so the water can be reclaimed for use in commer- cial car wash systems. The MOC system has been util- ized within the steel industry to reclaim water used to wash oil film from steel in preparation for painting. The objective of this study was to evaluate the ability of the MOC system to reduce both offensiveness and intensity of the smell of swine slurry under production scale conditions. An additional purpose of this study was to evaluate the MOC system’s effect on slurry character- istics. The hypothesis was that the MOC system would improve odor offensiveness and reduce odor intensity without changing slurry characteristics. 2. Materials and Methods 2.1. Sample Collection The MOC system was tested to reduce odor in a curtain sided finishing facility containing 500 grow-finish mar- ket hogs. This building spanned from east to west and utilized wet/dry feeders equipped with nipple waterers. The facility used slatted floors that allowed wastes to collect into a 12.2 m wide × 25.9 m long × 2.4 m deep concrete manure pit. The pit, capable of holding 770,142 l of slurry contained 577,607 l during the testing period. During the trial period the average percent humidity was recorded along with the high and low daily temperatures. Slurry samples were collected at 4 time intervals (0 h, 24 h, 48 h, 96 h). Two, four-liter slurry samples were collected at each interval using a 3.05 m probe. The slurry samples were immediately transported to the Illi- nois State University Analytical Laboratory for analysis. The 0 h collection was before any processing began and represented unaerated slurry. Samples collected at 24, 48 and 96 h were collected from aerated slurry. During air sample collection all ventilation fans were turned off. An SKC® Air Sample Pump (SKC Inc., Eighty Four, PA, USA) was used to collect six, 10-L samples at each collection time. Samples were collected by lowering an air tube approximately 12 inches above the slatted floor from three locations along the center isle of the building representing the east one third, center, and west one third of the building. Each mechanical locking airbag was prefilled with air for two minutes, emptied of air by manually pressing on the bag and then refilled with air for five minutes and sealed. 2.2. Ozonation Pump The ozonation pump/reactor used for slurry treatment is patented by Smart Earth Technologies®. It treats slurry with ozone (O3) created by exposing air to ultraviolet light (UV light). Once O3 is formed it is injected into a continuous flow slurry line at a rate of 0.08 cubic meters per minute. The pump consists of a 5 hp single phase motor with a power consumption of no more than 28 amps. It is capable of sustaining a flow rate of 851.6 l/m or 51,097 l/h. The entire slurry within the pit was poten- tially exchanged every 11.3 h. The intake hose was placed approximately 0.8 m off the bottom of the pit and pumped slurry from the east end of the building. The discharge line traveled to the west end of the building returning slurry to the pit approxi- mately 0.7 m below the slurry surface. 2.3. Odor Analysis The odor analysis protocol was approved by the Purdue University Institutional Review Board. Following collec- tion, air samples were sent (once daily) to the Purdue Agriculture Air Quality Laboratory where they were evaluated for intensity and hedonic tone at both recogni- tion and full strength. Using the Triangular Force Choice test method, eight trained panelists evaluated each sam- ple using an AC’SCENT International Olfactometer® (St. Croix Sensory; Lake Elmo, MN, USA). Intensity was measured on a scale of 0 - 5, with 0 equal to no detect- able odor and 5 equal to extremely strong odor. Intensity levels were determined by comparison to a reference odor of n-butanol. Hedonic tone (offensiveness) scales ranged from –10 (extremely unpleasant) to 10 (pleasant). 2.4. Slurry Analysis Slurry samples were analyzed using duplicate sub- samples to evaluate pH, dissolved oxygen (DO), chemical oxygen demand (COD), solids dry weight (SDW), set- tleable solids (SS), total suspended solids (TSS), total N, Copyright © 2011 SciRes. JEP 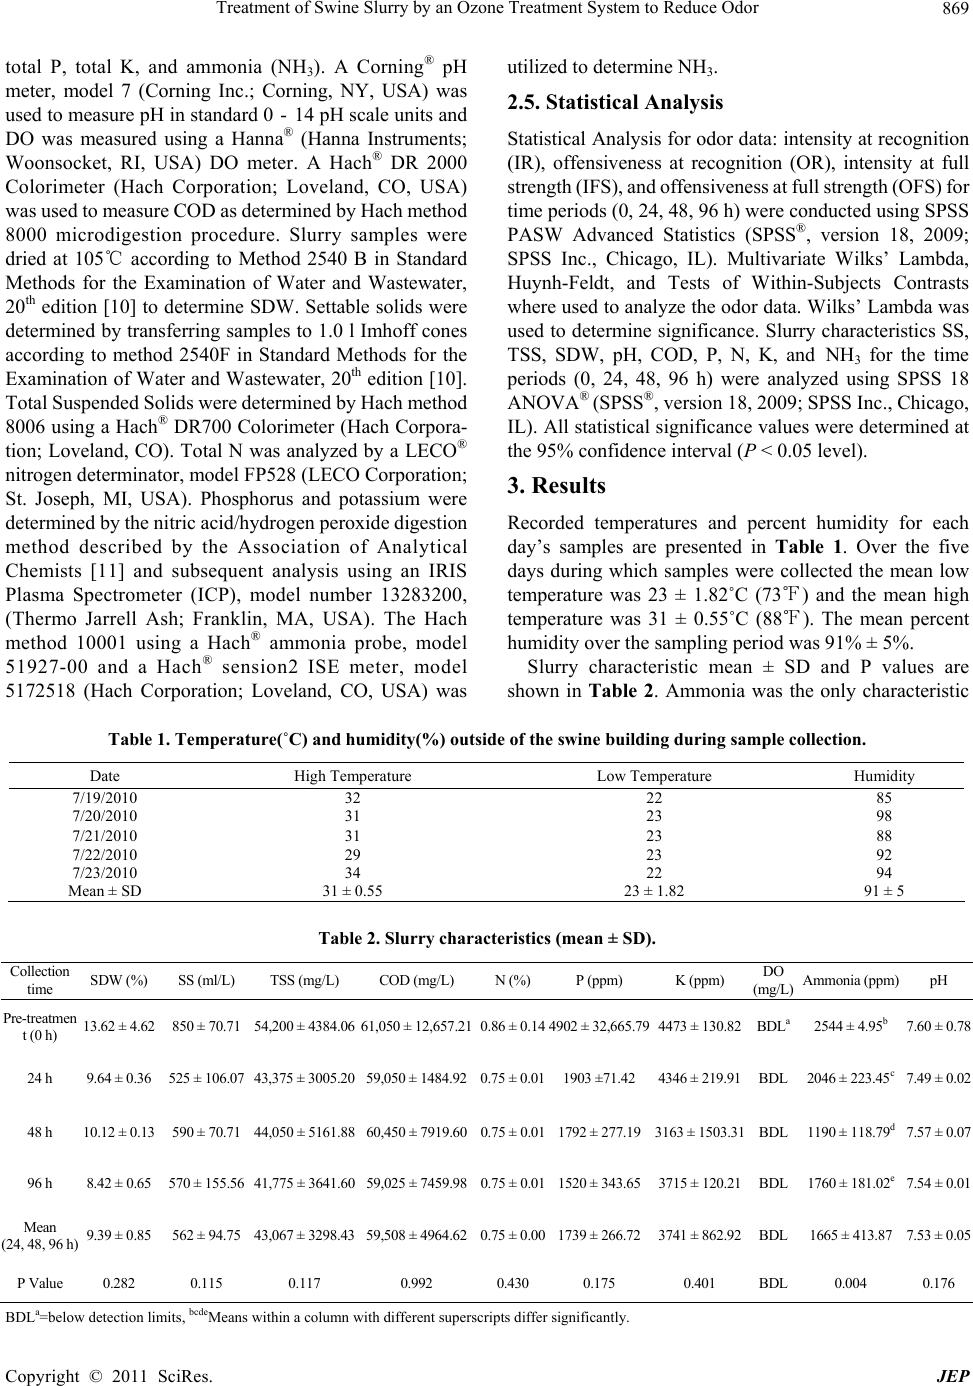 Treatment of Swine Slurry by an Ozone Treatment System to Reduce Odor Copyright © 2011 SciRes. JEP 869 total P, total K, and ammonia (NH3). A Corning® pH meter, model 7 (Corning Inc.; Corning, NY, USA) was used to measure pH in standard 0 - 14 pH scale units and DO was measured using a Hanna® (Hanna Instruments; Woonsocket, RI, USA) DO meter. A Hach® DR 2000 Colorimeter (Hach Corporation; Loveland, CO, USA) was used to measure COD as determined by Hach method 8000 microdigestion procedure. Slurry samples were dried at 105℃ according to Method 2540 B in Standard Methods for the Examination of Water and Wastewater, 20th edition [10] to determine SDW. Settable solids were determined by transferring samples to 1.0 l Imhoff cones according to method 2540F in Standard Methods for the Examination of Water and Wastewater, 20th edition [10]. Total Suspended Solids were determined by Hach method 8006 using a Hach® DR700 Colorimeter (Hach Corpora- tion; Loveland, CO). Total N was analyzed by a LECO® nitrogen determinator, model FP528 (LECO Corporation; St. Joseph, MI, USA). Phosphorus and potassium were determined by the nitric acid/hydrogen peroxide digestion method described by the Association of Analytical Chemists [11] and subsequent analysis using an IRIS Plasma Spectrometer (ICP), model number 13283200, (Thermo Jarrell Ash; Franklin, MA, USA). The Hach method 10001 using a Hach® ammonia probe, model 51927-00 and a Hach® sension2 ISE meter, model 5172518 (Hach Corporation; Loveland, CO, USA) was utilized to determine NH3. 2.5. Statistical Analysis Statistical Analysis for odor data: intensity at recognition (IR), offensiveness at recognition (OR), intensity at full strength (IFS), and offensiveness at full strength (OFS) for time periods (0, 24, 48, 96 h) were conducted using SPSS PASW Advanced Statistics (SPSS®, version 18, 2009; SPSS Inc., Chicago, IL). Multivariate Wilks’ Lambda, Huynh-Feldt, and Tests of Within-Subjects Contrasts where used to analyze the odor data. Wilks’ Lambda was used to determine significance. Slurry characteristics SS, TSS, SDW, pH, COD, P, N, K, and NH3 for the time periods (0, 24, 48, 96 h) were analyzed using SPSS 18 ANOVA® (SPSS®, version 18, 2009; SPSS Inc., Chicago, IL). All statistical significance values were determined at the 95% confidence interval (P < 0.05 level). 3. Results Recorded temperatures and percent humidity for each day’s samples are presented in Table 1. Over the five days during which samples were collected the mean low temperature was 23 ± 1.82˚C (73℉) and the mean high temperature was 31 ± 0.55˚C (88℉). The mean percent humidity over the sampling period was 91% ± 5%. Slurry characteristic mean ± SD and P values are shown in Table 2. Ammonia was the only characteristic Table 1. Temperature(˚C) and humidity(%) outside of the swine building during sample collection. Date High Temperature Low Temperature Humidity 7/19/2010 32 22 85 7/20/2010 31 23 98 7/21/2010 31 23 88 7/22/2010 29 23 92 7/23/2010 34 22 94 Mean ± SD 31 ±0.55 23 ±1.82 91± 5 Table 2. Slurry characteristics (me an ± SD). Collection time SDW (%) SS (ml/L) TSS (mg/L) COD (mg/L) N (%) P (ppm) K (ppm) DO (mg/L) Ammonia (ppm)pH Pre-treatmen t (0 h) 13.62 ± 4.62 850 ± 70.71 54,200 ± 4384.06 61,050 ± 12,657.210.86 ± 0.14 4902 ± 32,665.794473 ± 130.82 BDLa 2544 ± 4.95b 7.60 ± 0.78 24 h 9.64 ± 0.36 525 ± 106.0743,375 ± 3005.20 59,050 ± 1484.920.75 ± 0.011903 ±71.42 4346 ± 219.91 BDL 2046 ± 223.45c7.49 ± 0.02 48 h 10.12 ± 0.13 590 ± 70.71 44,050 ± 5161.88 60,450 ± 7919.600.75 ± 0.011792 ± 277.193163 ± 1503.31 BDL 1190 ± 118.79d7.57 ± 0.07 96 h 8.42 ± 0.65 570 ± 155.5641,775 ± 3641.60 59,025 ± 7459.980.75 ± 0.011520 ± 343.653715 ± 120.21 BDL 1760 ± 181.02e7.54 ± 0.01 Mean (24, 48, 96 h)9.39 ± 0.85 562 ± 94.75 43,067 ± 3298.43 59,508 ± 4964.620.75 ± 0.001739 ± 266.723741 ± 862.92 BDL 1665 ± 413.877.53 ± 0.05 P Value 0.282 0.115 0.117 0.992 0.430 0.175 0.401 BDL 0.004 0.176 BDLa=below detection limits, bcdeMeans within a column with different superscripts differ significantly. 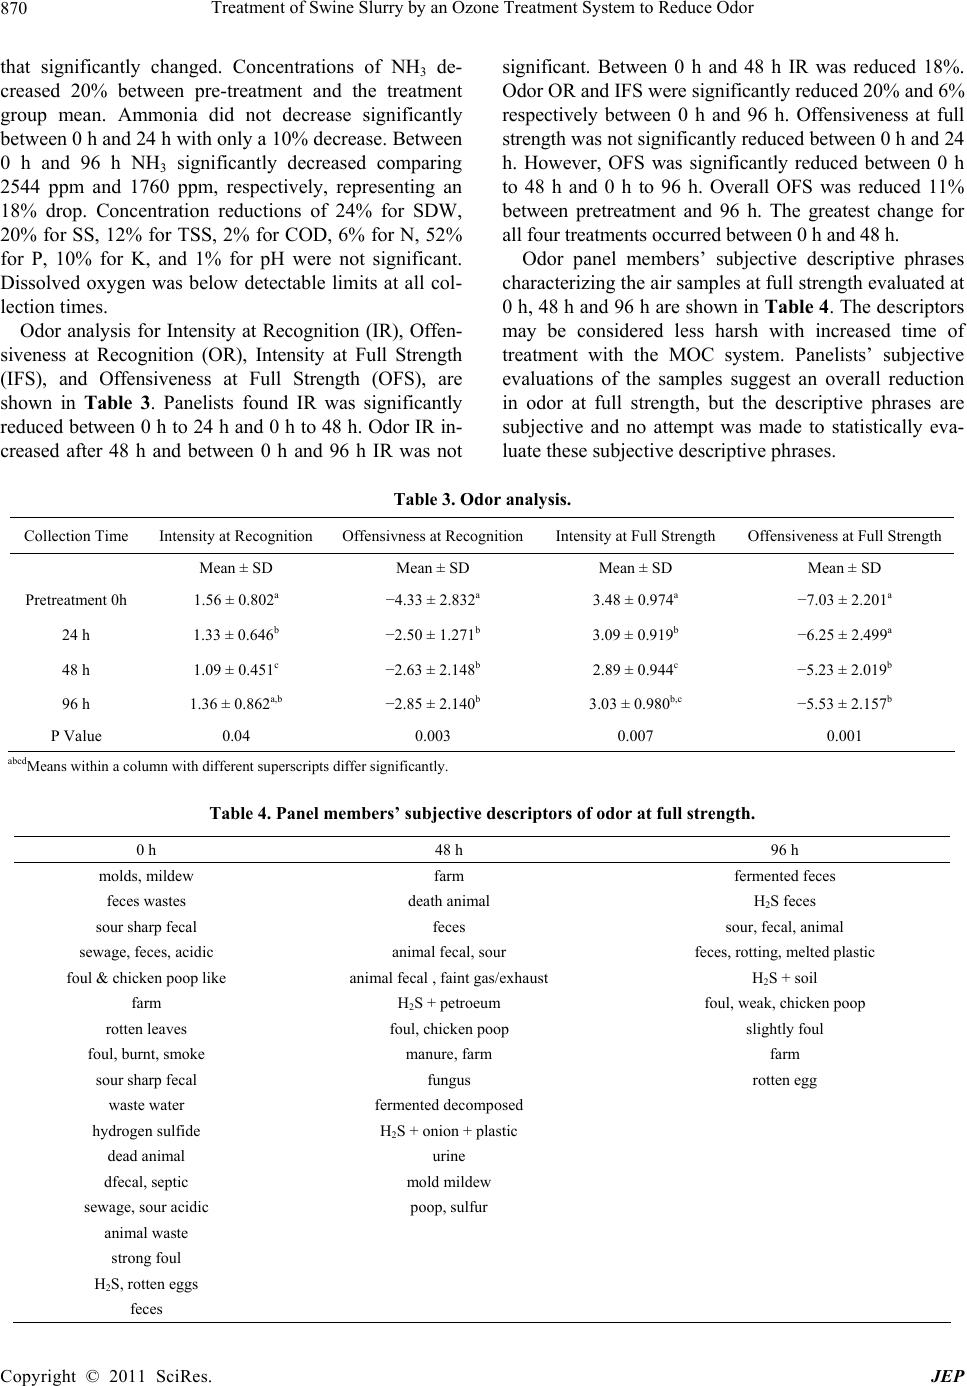 Treatment of Swine Slurry by an Ozone Treatment System to Reduce Odor 870 that significantly changed. Concentrations of NH3 de- creased 20% between pre-treatment and the treatment group mean. Ammonia did not decrease significantly between 0 h and 24 h with only a 10% decrease. Between 0 h and 96 h NH3 significantly decreased comparing 2544 ppm and 1760 ppm, respectively, representing an 18% drop. Concentration reductions of 24% for SDW, 20% for SS, 12% for TSS, 2% for COD, 6% for N, 52% for P, 10% for K, and 1% for pH were not significant. Dissolved oxygen was below detectable limits at all col- lection times. Odor analysis for Intensity at Recognition (IR), Offen- siveness at Recognition (OR), Intensity at Full Strength (IFS), and Offensiveness at Full Strength (OFS), are shown in Table 3. Panelists found IR was significantly reduced between 0 h to 24 h and 0 h to 48 h. Odor IR in- creased after 48 h and between 0 h and 96 h IR was not significant. Between 0 h and 48 h IR was reduced 18%. Odor OR and IFS were significantly reduced 20% and 6% respectively between 0 h and 96 h. Offensiveness at full strength was not significantly reduced between 0 h and 24 h. However, OFS was significantly reduced between 0 h to 48 h and 0 h to 96 h. Overall OFS was reduced 11% between pretreatment and 96 h. The greatest change for all four treatments occurred between 0 h and 48 h. Odor panel members’ subjective descriptive phrases characterizing the air samples at full strength evaluated at 0 h, 48 h and 96 h are shown in Table 4. The descriptors may be considered less harsh with increased time of treatment with the MOC system. Panelists’ subjective evaluations of the samples suggest an overall reduction in odor at full strength, but the descriptive phrases are subjective and no attempt was made to statistically eva- luate these subjective descriptive phrases. Table 3. Odor analysis. Collection Time Intensity at Recognition Offensivness at RecognitionIntensity at Full Strength Offensiveness at Full Strength Mean ± SD Mean ± SD Mean ± SD Mean ± SD Pretreatment 0h 1.56 ± 0.802a −4.33 ± 2.832a 3.48 ± 0.974a −7.03 ± 2.201a 24 h 1.33 ± 0.646b −2.50 ± 1.271b 3.09 ± 0.919b −6.25 ± 2.499a 48 h 1.09 ± 0.451c −2.63 ± 2.148b 2.89 ± 0.944c −5.23 ± 2.019b 96 h 1.36 ± 0.862a,b −2.85 ± 2.140b 3.03 ± 0.980b,c −5.53 ± 2.157b P Value 0.04 0.003 0.007 0.001 abcdMeans within a column with different superscripts differ significantly. Table 4. Panel members’ subjective desc riptors of odor at full strength. 0 h 48 h 96 h molds, mildew farm fermented feces feces wastes death animal H2S feces sour sharp fecal feces sour, fecal, animal sewage, feces, acidic animal fecal, sour feces, rotting, melted plastic foul & chicken poop like animal fecal , faint gas/exhaust H2S + soil farm H2S + petroeum foul, weak, chicken poop rotten leaves foul, chicken poop slightly foul foul, burnt, smoke manure, farm farm sour sharp fecal fungus rotten egg waste water fermented decomposed hydrogen sulfide H2S + onion + plastic dead animal urine dfecal, septic mold mildew sewage, sour acidic poop, sulfur animal waste strong foul H2S, rotten eggs feces Copyright © 2011 SciRes. JEP  Treatment of Swine Slurry by an Ozone Treatment System to Reduce Odor 871 4. Discussion Evaluation of slurry characteristics found NH3 as the only characteristic that significantly changed over the treatment period. Ammonia concentration decreased from 0 h to 48 h, then rose at 96 h. The cause of the ini- tial NH3 decrease in this experiment may be caused by the high volume of slurry turnover resulting in an in- creased amount of agitation and aeration of the swine slurry, followed by a steady-state of NH3 production in equilibrium with NH3 emission. This is opposed to the findings of Wu [6]. Wu found that NH3 increased while being stored and treated with ozonation. Wu’s study was conducted over a period of four weeks as opposed to four days (96 h). The pH of the swine slurry used in the Wu study was 8.93 which is above the pH (> 8.5) recognized to produce excess NH3 from aqueous ammonia ions [12]. The neutral pH of this study (pH = 7.6) may have re- sulted in less NH3 production compared to the increased slurry pH during Wu’s slurry storage [6]. Within a con- trolled environment Li [13] showed that ozonation has no significant impact on NH3 concentrations. Additional tests investigating different conditions (temperature, pH, moisture, and time period) are needed to 1) explain the inconsistency in results of the affect of ozone on NH3 concentrations in swine slurry and 2) determine why or how the MOC system reduced NH₃ of the slurry. Wil- liam’s [14] evaluation of swine slurry odor suggests that NH3 contributes little to the offensiveness of slurry odor. Reduced NH3 emissions from animal feeding operations can be advantageous to the environment, however, as NH3 can be a major source of nitrogen enrichment and pollution of air, water and soil [15]. No significant differences (changes) in other slurry characteristics were observed, though some characteris- tics decreased numerically. Settable solids, P and K de- creased which could be accredited to settling. Total sus- pended solids should increase with agitation, however, it decreased. This decrease in TSS is additional evidence that increased surface layer agitation may have still al- lowed settling. Dissolved oxygen within the slurry was below detection limits and this agrees with the findings of Walker and Wade [16] and Walker [17]. Consistent slurry characteristics suggest that an increase in aerobic microorganisms may have caused odor reduction and aroma improvement. Odor was reduced in both offen- siveness and intensity suggesting that anaerobic odor producing microorganisms were reduced. Ozone has shown to be a safe treatment of wastewaters [4] and ca- pable of oxidizing bacteria [5]. Another explanation is that continuous turnover of the slurry (approximately two complete turnovers every 24 h) simply diluted odor con- tributing compounds (volatile organic compounds, NH3, etc.). Treatment of swine slurry by Wu [6] showed ozone to not only reduce odor, but ozone was more effective than oxygen, hydrogen peroxide, or stripping with nitro- gen. Ozone use in this study, also, was shown as an ef- fective odor treatment over the 96 hour treatment period. The treatment of slurry was most effective between pre- treatment and 48 h suggesting an increase of odor be- tween 48 h and 96 h. This may be caused by a regrowth of anaerobic bacteria after 48 h or the increase of odor may have been the result of steady-state conditions being reached. Further investigation into the relationship be- tween the length of treatment time and odor reduction is needed in order to suggest the proper length of treatment in order to reduce treatment expense. No determination of microorganism species or populations was conducted in this study. Ozonation with the MOC system has prac- tical application to minimize emissions leading to fewer complaints, and reduced adverse health effects to animals and humans, in addition to enhancing air quality. The assessment of odor by the human nose (panelists) intro- duces two kinds of subjectivity into evaluation. Subjec- tivity of the human nose itself and subjectivity of the human language used in the description of the odor [18]. Even so, this method of odor evaluation may be the most effective assessment as under production scale conditions individual human assessment is the evaluation in the court of public opinion. The MOC system performed within a production scale environment. Pit turnover was theoretically sufficient to allow incorporation of ozone throughout the slurry. The MOC system reduced odor during storage. Additional tests are needed to investigate odor production after treatment during storage and after treatment during land application. Further investigation describing and charac- terizing bacteria populations should be conducted. In addition, an economic analysis of the MOC system is warranted to determine if the capital expenditure and cost of operation is justifiable. Treatment of swine slurry with the MOC system de- creased NH3 concentrations. The MOC system signifi- cantly reduced odor intensity and offensiveness within 48 h and maintained reduced odor through 96 h of operation. Operation of the MOC system in this study suggests it can function successfully under production scale condi- tions to reduce swine slurry odor. 5. Acknowledgements This study was partially funded by Sobrite Technolo- gies® Inc. (Eureka, Illinois). REFERENCES [1] W. F. Ritter, “Odour Control of Livestock Wastes: Copyright © 2011 SciRes. JEP  Treatment of Swine Slurry by an Ozone Treatment System to Reduce Odor Copyright © 2011 SciRes. JEP 872 State-of-the-Art in North America,” Journal of Agricul- ture Engineering Research, Vol. 42, 1989, pp. 51-62. [2] R. I. Mackie, P. G. Stroot, and V. H. Varel, “Biochemical Identification and Biological Origin of Key Odor Com- ponents in Livestock Waste,” Journal of Animal Science, Vol. 76, 1998, pp. 1331-1342. [3] D. H. O’Neill and V. R. Phillips, “A Review of the Con- trol of Odour Nuisance from Livestock Buildings: Part 3, Properties of the Odorous Substances Which Have been Identified in Livestock Wastes or in the Air around them,” Journal Agriculture Engineering Research, Vol. 53, 1992, pp. 23-50. doi:10.1016/0021-8634(92)80072-Z [4] S. J. Masten and S. H. R. Davies. “The Use of Ozonation to Degrade Organic Contaminants in Wastewaters,” En- vironmental Science and Technology, Vol. 28, No. 4, 1994, pp. 180-185. [5] M. Horváth, L. Bilitzky and J. Hüttner, “Ozone,” Elsevier Science Publishing, New York, 1985. [6] J. J. Wu, S. Park, S. M. Hengemuehle, M. T. Yokoyama, H. L. Person, J. B. Gerrish and S. J. Masten, “The Use of Ozone to Reduce the Concentration of Malodourous Me- tabolites in Swine Manure Slurry,” Journal of Agricul- tural Engineering Research, Vol. 72, No. 4, 1999, pp. 317-327. doi:10.1006/jaer.1998.0378 [7] S. S. Schiffman, “Livestock Odors: Implications for Hu- man Health and Well-Being,” Journal of Animal Science, Vol. 76, 1998, pp. 1343-1355. [8] T. S. Lorig, “Cognitive and Noncognitive Effects of Odor Exposure; Electrophyiological and Behavioral Evidence,” In: S. Van Toller and G. H. Dodd (Eds.), The Psycology and Biology of Perfume, Elsevier Applied Science, Lon- don, UK, 1992, pp. 161-173. [9] F. Haywood, “Handling Liquids and Solids on Hog Farms,” Biocycle, Vol. 38, 1997, pp. 55-57. [10] A. Eaton (Ed.), “Standard Methods for the Examination of Water and Wastewater,” 20th Edition, American Pub- lic Health Association (APHA), American Water Works Association (AWWA), Water Environment Federation (WEF), 2000. [11] Association of Analytical Chemists (AOAC), “Official Methods of Analysis,” 12th Edition AOAC, Washington DC, 1975. [12] P. J. Stoffella and B. A. Kahn, “Compost Utilization in Horticultural Cropping Systems,” Lewis, New York, 2001. [13] Q. Li, L. Wang, Z. Liu, and R. M. Kamens, “Could Ozo- nation Technology Really Work for Mitigation Air Emis- sions from Animal Feeding Operations?” Journal of Air and Waste Management Association, Vol. 59, 2009, pp. 1239-1246. doi:10.3155/1047-3289.59.10.1239 [14] A. G. Williams, “Indicators of Piggery Slurry Odour Of- fensiveness,” Agricultural Wastes, Vol. 10, No. 1, 1984, pp. 15-36. doi:10.1016/0141-4607(84)90016-7 [15] D. R. Kenney and J. L. Hatfield, “The Nitrogen Cycle, Historic Perspective, and Current and Potential Future Concerns.” In: J. L. Hatfield and R. F. Follett (Eds.), Ni- trogen in the Environment Sources, Problems, and Man- agement, Academic Press, San Diego, 2008, pp. 1-18. [16] P. M. Walker and C. A. Wade, “Comparison of the Effec- tiveness and Economic Costs of Two Production Scale Polyacrylamide Assisted Solid/Liquid Seperation Sys- tems for the Treatment of Liquid Swine Manure,” Applied Engineering in Agriculture, Vol. 26, No. 2, 2010, pp. 299-305. [17] P. M. Walker, C. A. Wade and T. R. Kelley, “Evaluation of a Polyacrylamide Assisted Solid/Liquid Separation System for the Treatment of Liquid Pig Manure,” Biosys- tems Engineering, 2009, pp. 1-6. [18] C. L. Barth, “Odor Sensation Theory and Phenomena and Their Effect on Olfactory Measurements,” Transactions of the American Society of Agricultural Engineers, Vol. 16, 1973, pp. 340-347.
|