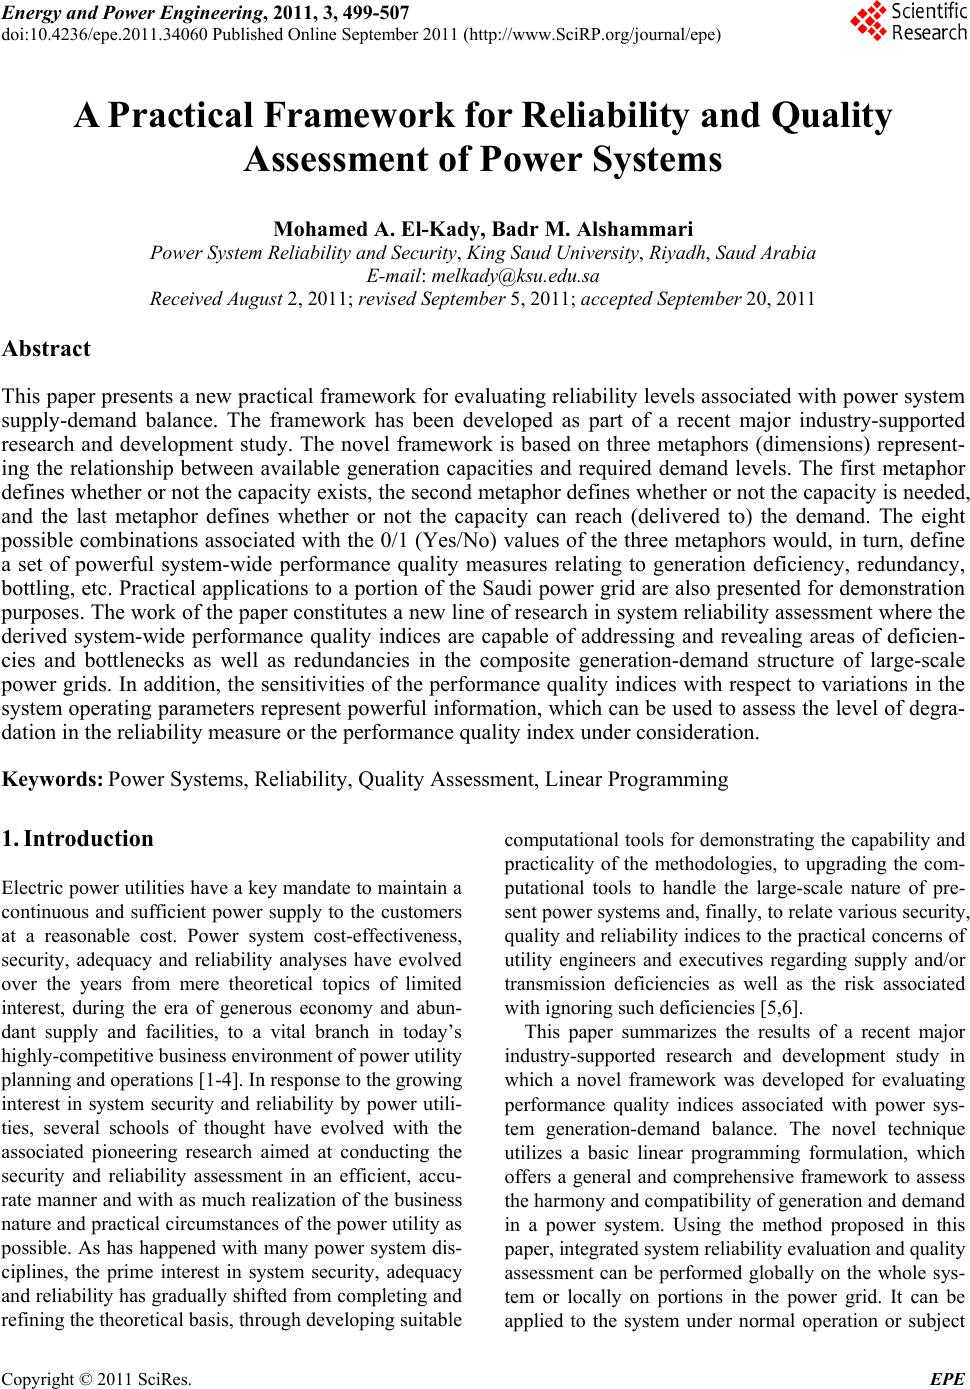
 Energy and Power En gi neering, 2011, 3, 499-507 doi:10.4236/epe.2011.34060 Published Online September 2011 (http://www.SciRP.org/journal/epe) Copyright © 2011 SciRes. EPE A Practical Framework for Reliability and Quality Assessment of Power Systems Mohamed A. El-Kady, Badr M. Alshammari Power System Reliability and Security, King Saud University, Riyadh, Saud Arabia E-mail: melkady@ksu.edu.sa Received August 2, 2011; revised September 5, 2011; accepted September 20, 2011 Abstract This paper presents a new practical framework for evaluating reliability levels associated with power system supply-demand balance. The framework has been developed as part of a recent major industry-supported research and development study. The novel framework is based on three metaphors (dimensions) represent- ing the relationship between available generation capacities and required demand levels. The first metaphor defines whether or not the capacity exists, the second metaphor defines whether or not the capacity is needed, and the last metaphor defines whether or not the capacity can reach (delivered to) the demand. The eight possible combinations associated with the 0/1 (Yes/No) values of the three metaphors would, in turn, define a set of powerful system-wide performance quality measures relating to generation deficiency, redundancy, bottling, etc. Practical applications to a portion of the Saudi power grid are also presented for demonstration purposes. The work of the paper constitutes a new line of research in system reliability assessment where the derived system-wide performance quality indices are capable of addressing and revealing areas of deficien- cies and bottlenecks as well as redundancies in the composite generation-demand structure of large-scale power grids. In addition, the sensitivities of the performance quality indices with respect to variations in the system operating parameters represent powerful information, which can be used to assess the level of degra- dation in the reliability measure or the performance quality index under consideration. Keywords: Power Systems, Reliability, Quality Assessment, Linear Programming 1. Introduction Electric power utilities have a key mandate to maintain a continuous and sufficient power supply to the customers at a reasonable cost. Power system cost-effectiveness, security, adequacy and reliability analyses have evolved over the years from mere theoretical topics of limited interest, during the era of generous economy and abun- dant supply and facilities, to a vital branch in today’s highly-competitive business environment of power utility planning and operations [1-4]. In response to the growing interest in system security and reliability by power utili- ties, several schools of thought have evolved with the associated pioneering research aimed at conducting the security and reliability assessment in an efficient, accu- rate manner and with as much realization of the business nature and practical circumstances of the power utility as possible. As has happened with many power system dis- ciplines, the prime interest in system security, adequacy and reliability has gradually shifted from completing and refining the theoretical basis, through developing suitable computational tools for demonstrating the capability and practicality of the methodologies, to upgrading the com- putational tools to handle the large-scale nature of pre- sent power systems and, finally, to relate various security, quality and reliability indices to the practical concerns of utility engineers and executives regarding supply and/or transmission deficiencies as well as the risk associated with ignoring such deficiencies [5,6]. This paper summarizes the results of a recent major industry-supported research and development study in which a novel framework was developed for evaluating performance quality indices associated with power sys- tem generation-demand balance. The novel technique utilizes a basic linear programming formulation, which offers a general and comprehensive framework to assess the harmony and compatibility of generation and demand in a power system. Using the method proposed in this paper, integrated system reliability evaluation and quality assessment can be performed globally on the whole sys- tem or locally on portions in the power grid. It can be applied to the system under normal operation or subject 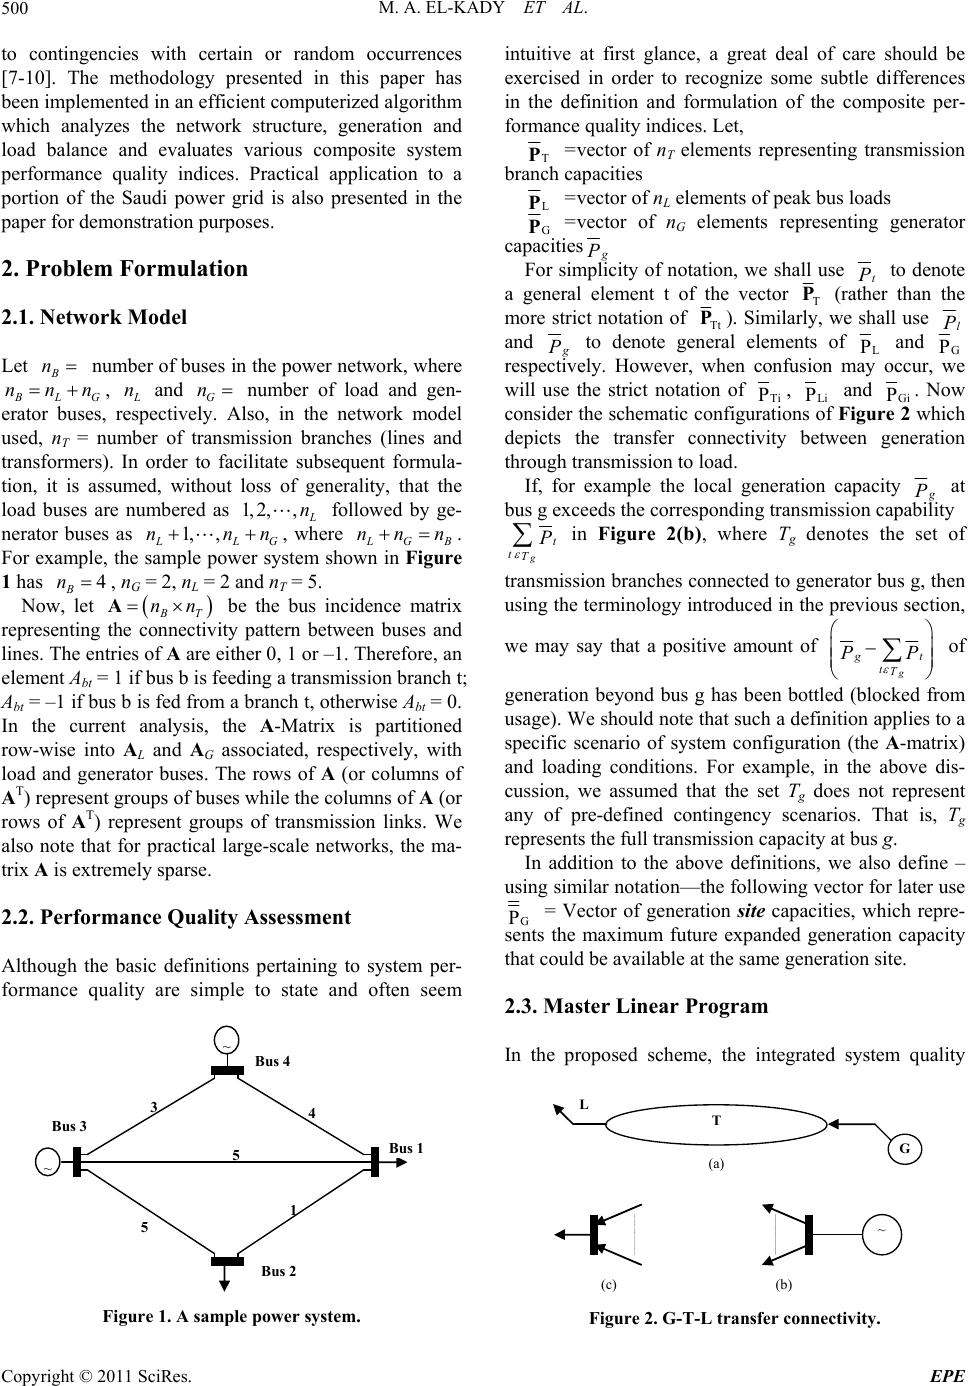 M. A. EL-KADY ET AL. 500 to contingencies with certain or random occurrences [7-10]. The methodology presented in this paper has been implemented in an efficient computerized algorithm which analyzes the network structure, generation and load balance and evaluates various composite system performance quality indices. Practical application to a portion of the Saudi power grid is also presented in the paper for demonstration purposes. 2. Problem Formulation 2.1. Network Model Let number of buses in the power network, where B n LG , nnn n and G number of load and gen- erator buses, respectively. Also, in the network model used, nT = number of transmission branches (lines and transformers). In order to facilitate subsequent formula- tion, it is assumed, without loss of generality, that the load buses are numbered as n 1, 2,, n followed by ge- nerator buses as 1, , LG , where nnn GB . For example, the sample power system shown in Figure 1 has , nG = 2, nL = 2 and nT = 5. nn n 4 B n Now, let T be the bus incidence matrix representing the connectivity pattern between buses and lines. The entries of A are either 0, 1 or –1. Therefore, an element Abt = 1 if bus b is feeding a transmission branch t; Abt = –1 if bus b is fed from a branch t, otherwise Abt = 0. In the current analysis, the A-Matrix is partitioned row-wise into AL and AG associated, respectively, with load and generator buses. The rows of A (or columns of AT) represent groups of buses while the columns of A (or rows of AT) represent groups of transmission links. We also note that for practical large-scale networks, the ma- trix A is extremely sparse. nnA 2.2. Performance Quality Assessment Although the basic definitions pertaining to system per- formance quality are simple to state and often seem 5 4 1 3 5 Bus 3 Bus 4 Bus 2 Bus 1 Figure 1. A sample power system. intuitive at first glance, a great deal of care should be exercised in order to recognize some subtle differences in the definition and formulation of the composite per- formance quality indices. Let, T P = vector of nT elements representing transmission branch capacities L P = vector of nL elements of peak bus loads G P = vector of nG elements representing generator capacities P For simplicity of notation, we shall use t P to denote a general element t of the vector T P (rather than the more strict notation of Tt P). Similarly, we shall use l P and P to denote general elements of L P and G P respectively. However, when confusion may occur, we will use the strict notation of Ti P, Li P and Gi P. Now consider the schematic configurations of Figure 2 which depicts the transfer connectivity between generation through transmission to load. If, for example the local generation capacity P at bus g exceeds the corresponding transmission capability g t t T P in Figure 2(b), where Tg denotes the set of transmission branches connected to generator bus g, then using the terminology introduced in the previous section, we may say that a positive amount of g t tT PP of generation beyond bus g has been bottled (blocked from usage). We should note that such a definition applies to a specific scenario of system configuration (the A-matrix) and loading conditions. For example, in the above dis- cussion, we assumed that the set Tg does not represent any of pre-defined contingency scenarios. That is, Tg represents the full transmission capacity at bus g. In addition to the above definitions, we also define – using similar notation—the following vector for later use G P = Vector of generation site capacities, which repre- sents the maximum future expanded generation capacity that could be available at the same generation site. 2.3. Master Linear Program In the proposed scheme, the integrated system quality ~ T G L (a) (c) (b) Figure 2. G-T-L transfer connectivity. Copyright © 2011 SciRes. EPE 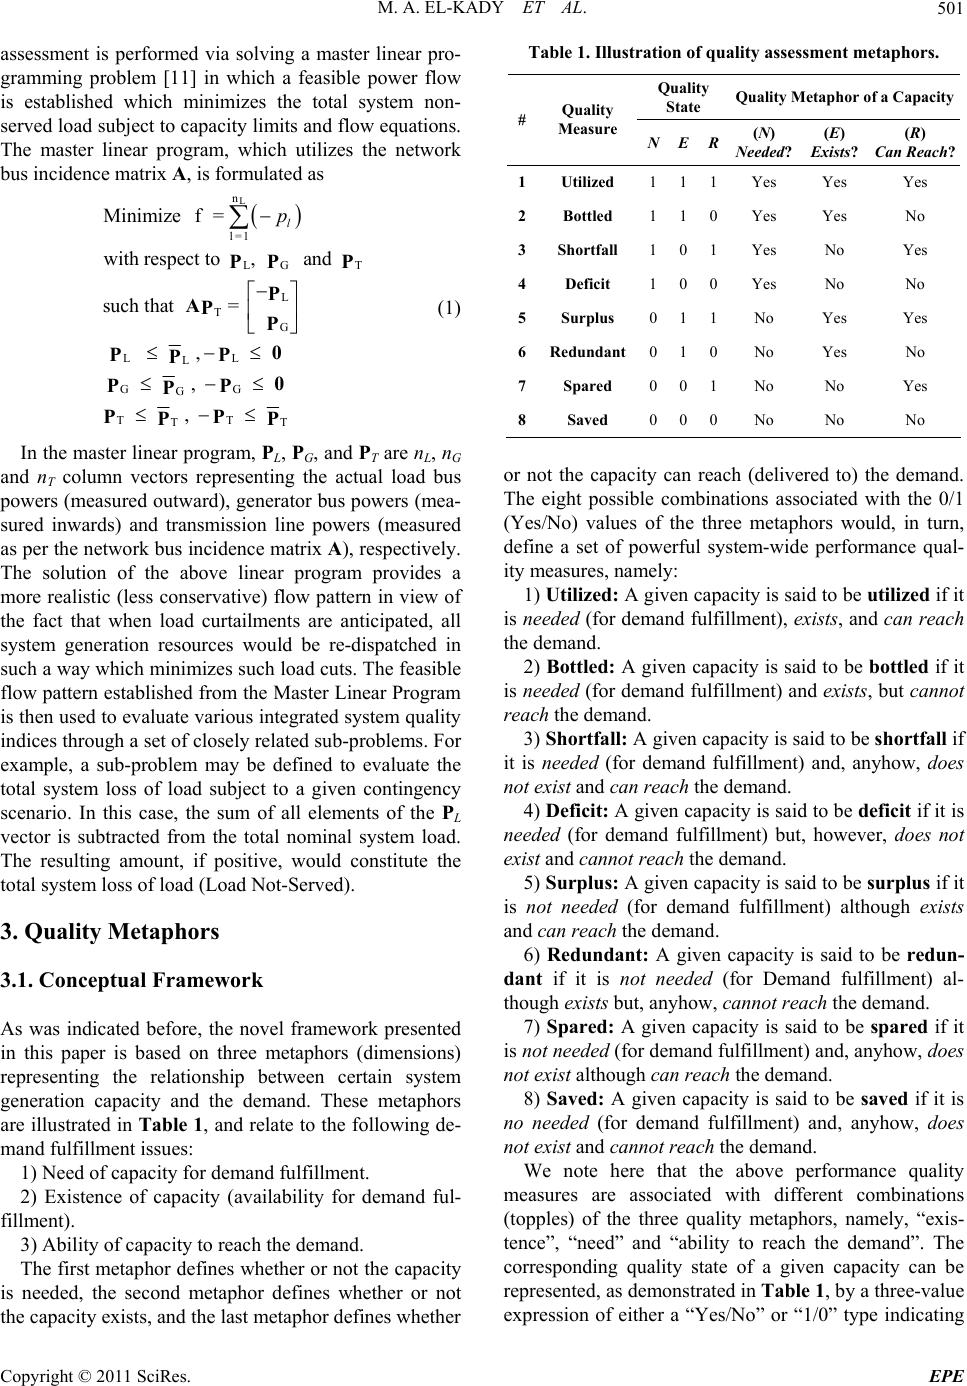 M. A. EL-KADY ET AL.501 assessment is performed via solving a master linear pro- gramming problem [11] in which a feasible power flow is established which minimizes the total system non- served load subject to capacity limits and flow equations. The master linear program, which utilizes the network bus incidence matrix A, is formulated as L n l = 1 LG T L T G LL L GG G TT TT Minimize f = with respect to , and such that = , , , l p PP P P APP 0 PP P0 PP P PP PP (1) In the master linear program, PL, PG, and PT are nL, nG and nT column vectors representing the actual load bus powers (measured outward), generator bus powers (mea- sured inwards) and transmission line powers (measured as per the network bus incidence matrix A), respectively. The solution of the above linear program provides a more realistic (less conservative) flow pattern in view of the fact that when load curtailments are anticipated, all system generation resources would be re-dispatched in such a way which minimizes such load cuts. The feasible flow pattern established from the Master Linear Program is then used to evaluate various integrated system quality indices through a set of closely related sub-problems. For example, a sub-problem may be defined to evaluate the total system loss of load subject to a given contingency scenario. In this case, the sum of all elements of the PL vector is subtracted from the total nominal system load. The resulting amount, if positive, would constitute the total system loss of load (Load Not-Served). 3. Quality Metaphors 3.1. Conceptual Framework As was indicated before, the novel framework presented in this paper is based on three metaphors (dimensions) representing the relationship between certain system generation capacity and the demand. These metaphors are illustrated in Table 1, and relate to the following de- mand fulfillment issues: 1) Need of capacity for demand fulfillment. 2) Existence of capacity (availability for demand ful- fillment). 3) Ability of capacity to reach the demand. The first metaphor defines whether or not the capacity is needed, the second metaphor defines whether or not the capacity exists, and the last metaphor defines whether Table 1. Illustration of quality assessment metaphors. Quality State Quality Metaphor of a Capacity #Quality Measure NER (N) Needed? (E) Exists? (R) Can Reach? 1Utilized 111Yes Yes Yes 2Bottled 110Yes Yes No 3Shortfall 101Yes No Yes 4Deficit 100Yes No No 5Surplus 011No Yes Yes 6 Redundant 010No Yes No 7Spared 001No No Yes 8Saved 000No No No or not the capacity can reach (delivered to) the demand. The eight possible combinations associated with the 0/1 (Yes/No) values of the three metaphors would, in turn, define a set of powerful system-wide performance qual- ity measures, namely: 1) Utilized: A given capacity is said to be utilized if it is needed (for demand fulfillment), exists, and can reach the demand. 2) Bottled: A given capacity is said to be bottled if it is needed (for demand fulfillment) and exists, but cannot reach the demand. 3) Shortfall: A given capacity is said to be shortfall if it is needed (for demand fulfillment) and, anyhow, does not exist and can reach the demand. 4) Deficit: A given capacity is said to be deficit if it is needed (for demand fulfillment) but, however, does not exist and cannot reach the demand. 5) Surplus: A given capacity is said to be surplus if it is not needed (for demand fulfillment) although exists and can reach the demand. 6) Redundant: A given capacity is said to be redun- dant if it is not needed (for Demand fulfillment) al- though exists but, anyhow, cannot reach the demand. 7) Spared: A given capacity is said to be spared if it is not needed (for demand fulfillment) and, anyhow, does not exist although can reach the demand. 8) Saved: A given capacity is said to be saved if it is no needed (for demand fulfillment) and, anyhow, does not exist and cannot reach the demand. We note here that the above performance quality measures are associated with different combinations (topples) of the three quality metaphors, namely, “exis- tence”, “need” and “ability to reach the demand”. The corresponding quality state of a given capacity can be represented, as demonstrated in Table 1, by a three-value expression of either a “Yes/No” or “1/0” type indicating Copyright © 2011 SciRes. EPE 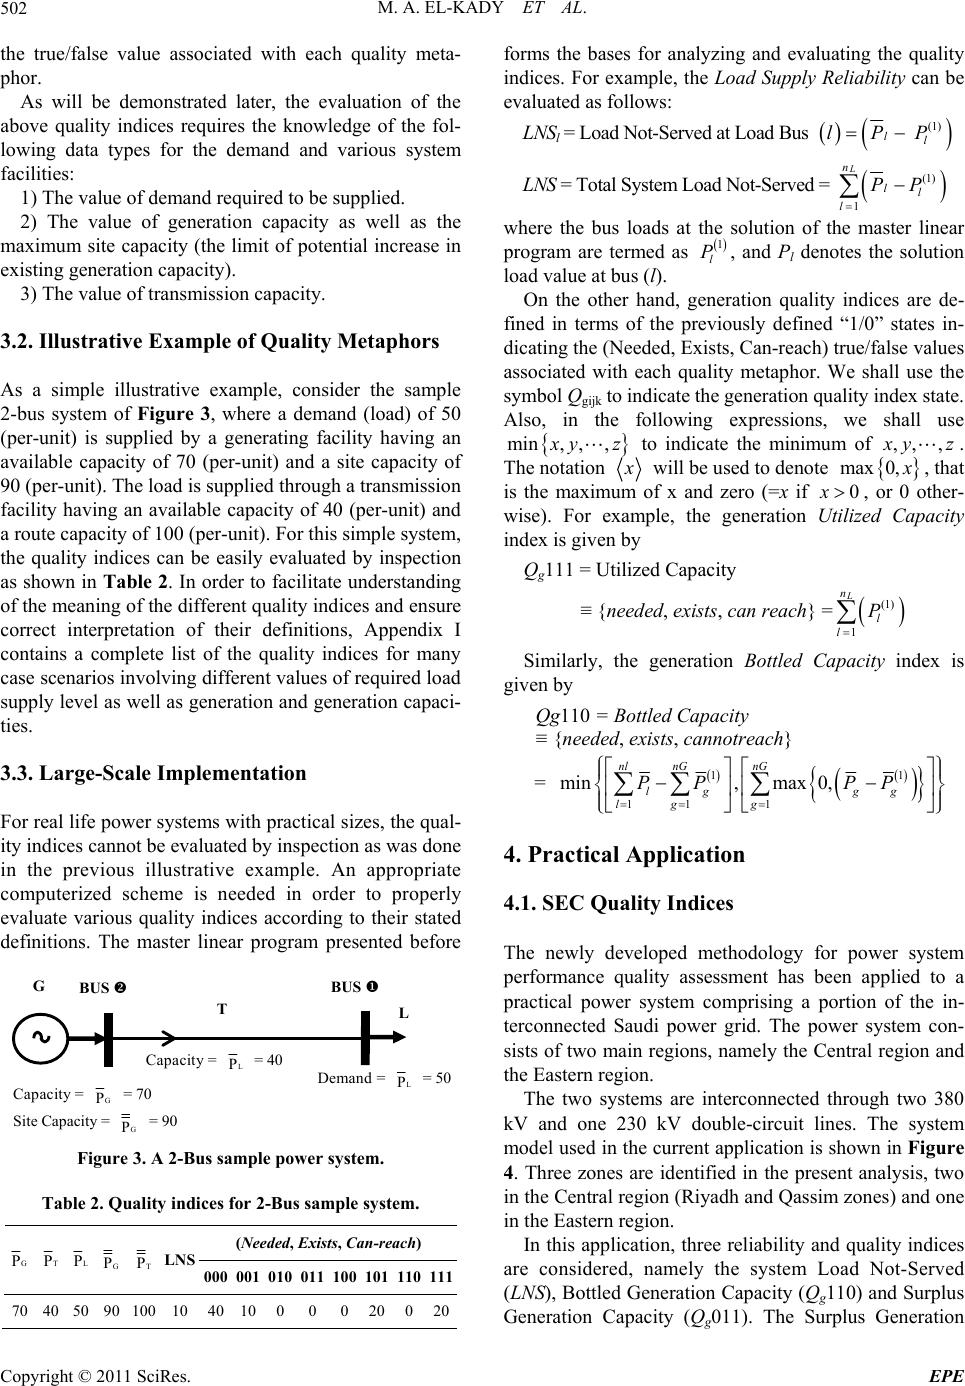 M. A. EL-KADY ET AL. 502 the true/false value associated with each quality meta- phor. As will be demonstrated later, the evaluation of the above quality indices requires the knowledge of the fol- lowing data types for the demand and various system facilities: 1) The value of demand required to be supplied. 2) The value of generation capacity as well as the maximum site capacity (the limit of potential increase in existing generation capacity). 3) The value of transmission capacity. 3.2. Illustrative Example of Quality Metaphors As a simple illustrative example, consider the sample 2-bus system of Figure 3, where a demand (load) of 50 (per-unit) is supplied by a generating facility having an available capacity of 70 (per-unit) and a site capacity of 90 (per-unit). The load is supplied through a transmission facility having an available capacity of 40 (per-unit) and a route capacity of 100 (per-unit). For this simple system, the quality indices can be easily evaluated by inspection as shown in Table 2. In order to facilitate understanding of the meaning of the different quality indices and ensure correct interpretation of their definitions, Appendix I contains a complete list of the quality indices for many case scenarios involving different values of required load supply level as well as generation and generation capaci- ties. 3.3. Large-Scale Implementation For real life power systems with practical sizes, the qual- ity indices cannot be evaluated by inspection as was done in the previous illustrative example. An appropriate computerized scheme is needed in order to properly evaluate various quality indices according to their stated definitions. The master linear program presented before Capacity = G P = 70 Site Capacity = G P = 90 Demand = L P = 50 L G Capacity = L P = 40 BUS BUS T Figure 3. A 2-Bus sample power system. Table 2. Quality indices for 2-Bus sample system. (Needed, Exists, Can-reac h) G P T P L P G P T P LNS 000 001 010 011 100 101110111 70 40 50 90 100 10 40 10 0 0 0 20 0 20 forms the bases for analyzing and evaluating the quality indices. For example, the Load Supply Reliability can be evaluated as follows: LNSl = Load Not-Served at Load Bus (1) ll lPP LNS = Total System Load Not-Served = (1) 1 L n ll l PP where the bus loads at the solution of the master linear program are termed as , and Pl denotes the solution load value at bus (l). 1 l P On the other hand, generation quality indices are de- fined in terms of the previously defined “1/0” states in- dicating the (Needed, Exists, Can-reach) true/false values associated with each quality metaphor. We shall use the symbol Qgijk to indicate the generation quality index state. Also, in the following expressions, we shall use min, ,, yz to indicate the minimum of ,,, yz. The notation will be used to denote 0,max , that is the maximum of x and zero (=x if , or 0 other- wise). For example, the generation Utilized Capacity index is given by 0x Qg111 = Utilized Capacity ≡ {needed, exists, can reach} = (1) 1 L n l l P Similarly, the generation Bottled Capacity index is given by Qg110 = Bottled Capacity ≡ {needed, exists, cannotreach} = 11 11 1 min,max 0, nl nGnG lg gg lg g PP PP 4. Practical Application 4.1. SEC Quality Indices The newly developed methodology for power system performance quality assessment has been applied to a practical power system comprising a portion of the in- terconnected Saudi power grid. The power system con- sists of two main regions, namely the Central region and the Eastern region. The two systems are interconnected through two 380 kV and one 230 kV double-circuit lines. The system model used in the current application is shown in Figure 4. Three zones are identified in the present analysis, two in the Central region (Riyadh and Qassim zones) and one in the Eastern region. In this application, three reliability and quality indices are considered, namely the system Load Not-Served (LNS), Bottled Generation Capacity (Qg110) and Surplus Generation Capacity (Qg011). The Surplus Generation Copyright © 2011 SciRes. EPE 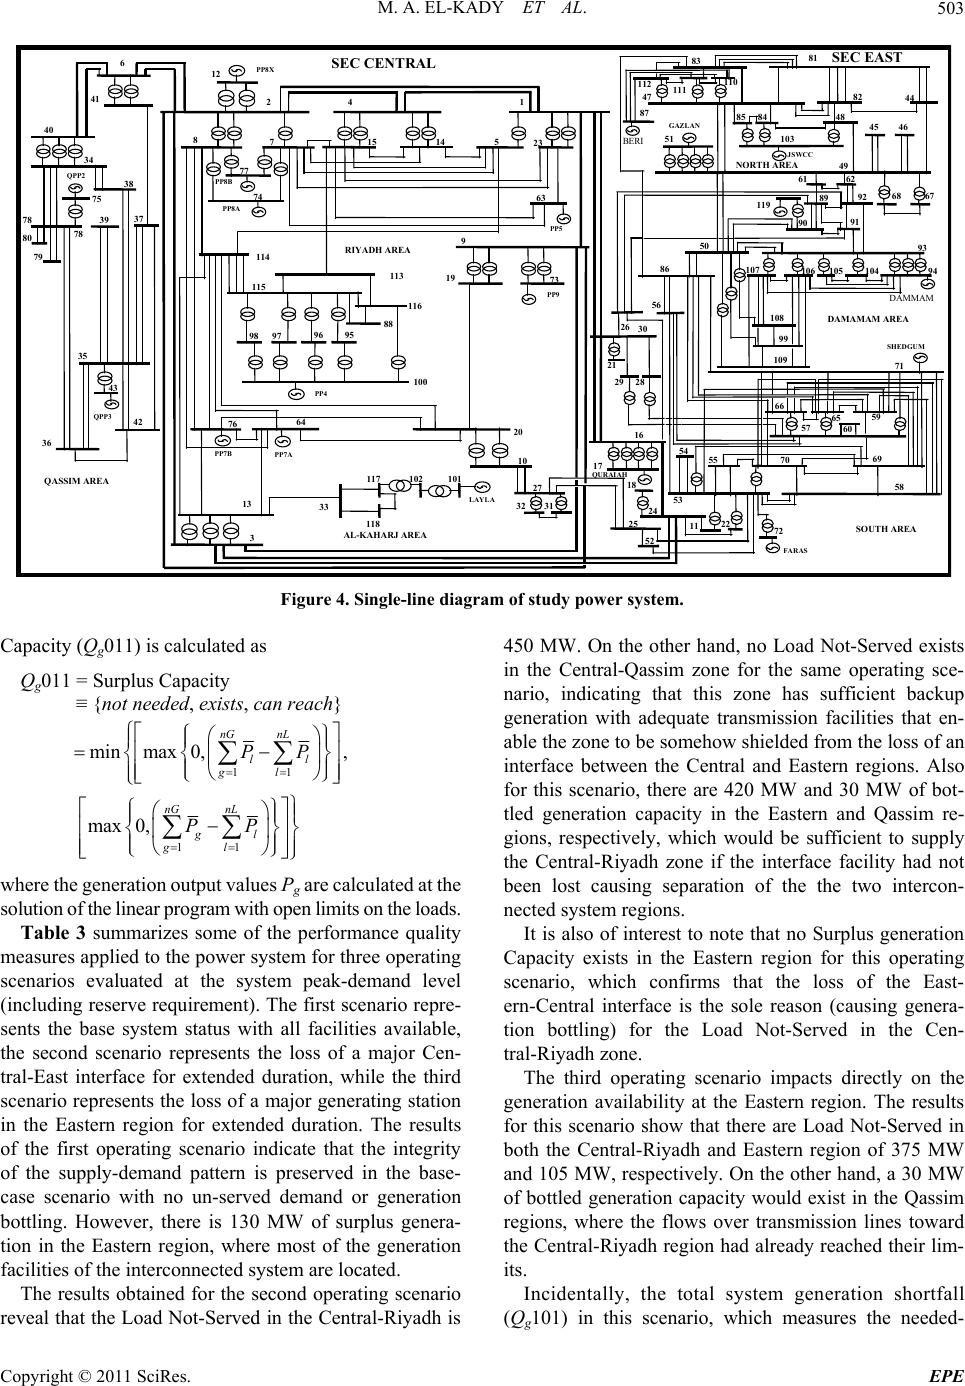 M. A. EL-KADY ET AL. Copyright © 2011 SciRes. EPE 503 10 20 3 13 33 117 102 101 118 64 9 73 19 1 23 5 4 1415 7 8 63 77 74 76 114 115 113 116 95 88 96 98 100 2 12 6 41 40 34 78 42 35 37 38 75 80 79 43 36 81 44 82 48 47 84 85 103 110 111 112 83 87 49 61 62 89 92 91 90 93 94104 105 106 107 50 86 108 99 109 56 30 16 26 54 53 24 25 97 27 32 31 52 119 72 58 69 70 59 65 66 71 57 39 60 18 11 22 21 51 6768 45 46 29 28 55 17 78 SEC EAST GAZLAN BERI JSWCC DAMMAM SHED GUM FARAS QUR AIA H SOUTH AREA DAMAMAM AREA NORTH AREA PP5 PP9 PP4 PP7A LAYLA PP7B PP8X PP8A PP8B QPP2 QPP3 QASSIM AREA AL-KAH AR J ARE A RIYADH AREA SEC CENTRAL Figure 4. Single-line diagram of study pow er system. Capacity (Qg011) is calculated as Qg011 = Surplus Capacity ≡ {not need ed , exists, can reach} 11 11 minmax 0,, max 0, nG nL ll gl nG nL gl gl PP PP where the generation output values Pg are calculated at the solution of the linear program with open limits on the loads. Table 3 summarizes some of the performance quality measures applied to the power system for three operating scenarios evaluated at the system peak-demand level (including reserve requirement). The first scenario repre- sents the base system status with all facilities available, the second scenario represents the loss of a major Cen- tral-East interface for extended duration, while the third scenario represents the loss of a major generating station in the Eastern region for extended duration. The results of the first operating scenario indicate that the integrity of the supply-demand pattern is preserved in the base- case scenario with no un-served demand or generation bottling. However, there is 130 MW of surplus genera- tion in the Eastern region, where most of the generation facilities of the interconnected system are located. The results obtained for the second operating scenario reveal that the Load Not-Served in the Central-Riyadh is 450 MW. On the other hand, no Load Not-Served exists in the Central-Qassim zone for the same operating sce- nario, indicating that this zone has sufficient backup generation with adequate transmission facilities that en- able the zone to be somehow shielded from the loss of an interface between the Central and Eastern regions. Also for this scenario, there are 420 MW and 30 MW of bot- tled generation capacity in the Eastern and Qassim re- gions, respectively, which would be sufficient to supply the Central-Riyadh zone if the interface facility had not been lost causing separation of the the two intercon- nected system regions. It is also of interest to note that no Surplus generation Capacity exists in the Eastern region for this operating scenario, which confirms that the loss of the East- ern-Central interface is the sole reason (causing genera- tion bottling) for the Load Not-Served in the Cen- tral-Riyadh zone. The third operating scenario impacts directly on the generation availability at the Eastern region. The results for this scenario show that there are Load Not-Served in both the Central-Riyadh and Eastern region of 375 MW and 105 MW, respectively. On the other hand, a 30 MW of bottled generation capacity would exist in the Qassim regions, where the flows over transmission lines toward the Central-Riyadh region had already reached their lim- its. Incidentally, the total system generation shortfall (Qg101) in this scenario, which measures the needed- 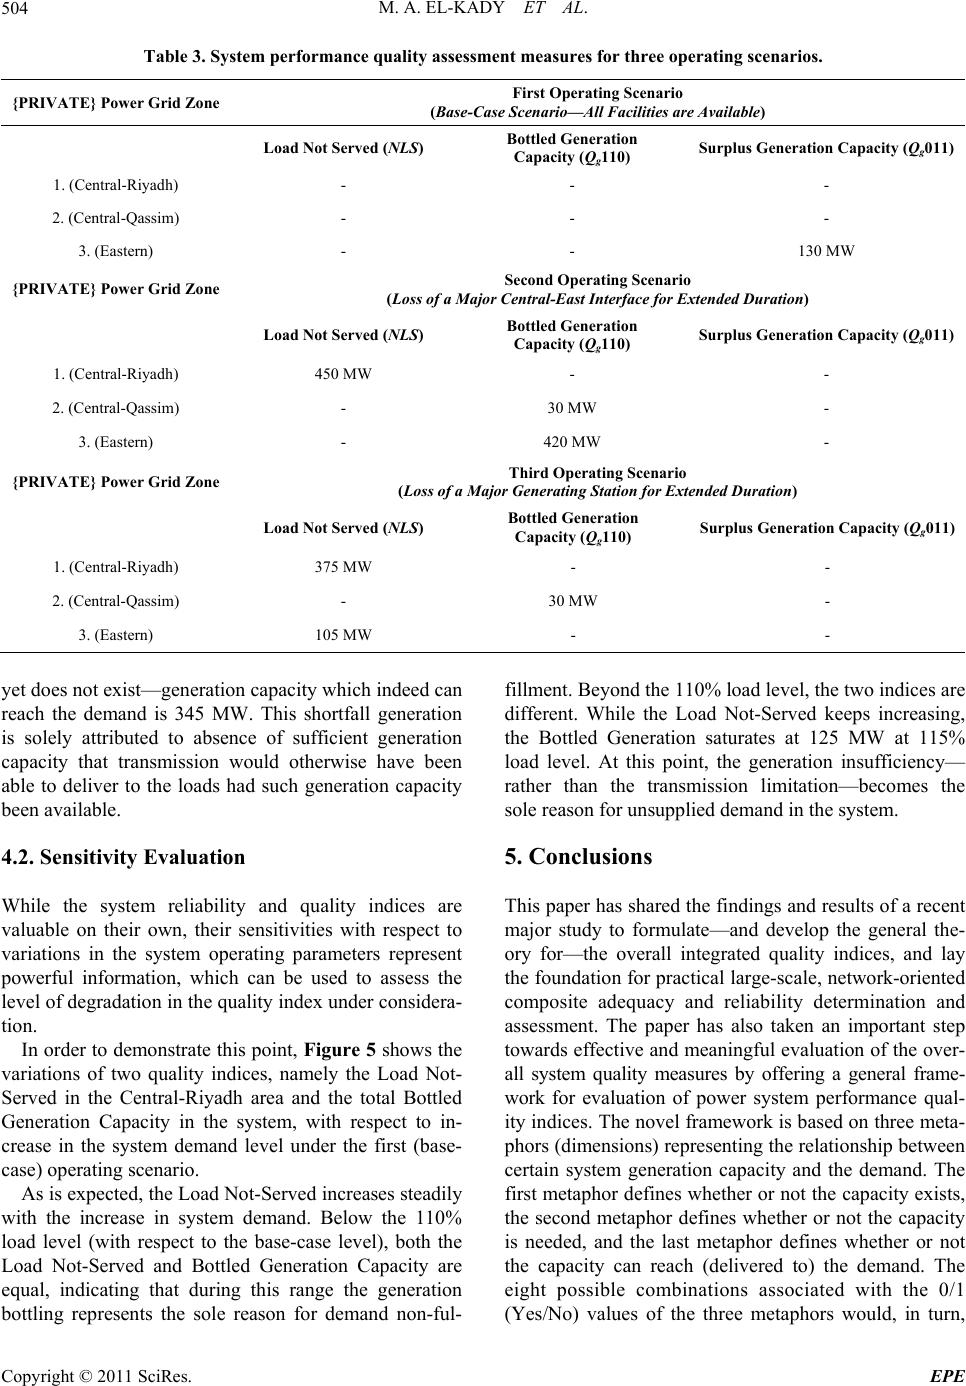 M. A. EL-KADY ET AL. 504 Table 3. System performance quality assessment measures for three operating scenarios. {PRIVATE} Power Grid Zone First Operating Scenario (Base-Case Scenario—All Facilities are Available) Load Not Served (NLS) Bottled Generation Capacity (Qg110) Surplus Generation Capacity (Qg011) 1. (Central-Riyadh) - - - 2. (Central-Qassim) - - - 3. (Eastern) - - 130 MW {PRIVATE} Power Grid Zone Second Operating Scenario (Loss of a Major Central-East Interface for Extended Duration) Load Not Served (NLS) Bottled Generation Capacity (Qg110) Surplus Generation Capacity (Qg011) 1. (Central-Riyadh) 450 MW - - 2. (Central-Qassim) - 30 MW - 3. (Eastern) - 420 MW - {PRIVATE} Power Grid Zone Third Operating Scenario (Loss of a Major Generating Station for Extended Duration) Load Not Served (NLS) Bottled Generation Capacity (Qg110) Surplus Generation Capacity (Qg011) 1. (Central-Riyadh) 375 MW - - 2. (Central-Qassim) - 30 MW - 3. (Eastern) 105 MW - - yet does not exist—generation capacity which indeed can reach the demand is 345 MW. This shortfall generation is solely attributed to absence of sufficient generation capacity that transmission would otherwise have been able to deliver to the loads had such generation capacity been available. 4.2. Sensitivity Evaluation While the system reliability and quality indices are valuable on their own, their sensitivities with respect to variations in the system operating parameters represent powerful information, which can be used to assess the level of degradation in the quality index under considera- tion. In order to demonstrate this point, Figure 5 shows the variations of two quality indices, namely the Load Not- Served in the Central-Riyadh area and the total Bottled Generation Capacity in the system, with respect to in- crease in the system demand level under the first (base- case) operating scenario. As is expected, the Load Not-Served increases steadily with the increase in system demand. Below the 110% load level (with respect to the base-case level), both the Load Not-Served and Bottled Generation Capacity are equal, indicating that during this range the generation bottling represents the sole reason for demand non-ful- fillment. Beyond the 110% load level, the two indices are different. While the Load Not-Served keeps increasing, the Bottled Generation saturates at 125 MW at 115% load level. At this point, the generation insufficiency— rather than the transmission limitation—becomes the sole reason for unsupplied demand in the system. 5. Conclusions This paper has shared the findings and results of a recent major study to formulate—and develop the general the- ory for—the overall integrated quality indices, and lay the foundation for practical large-scale, network-oriented composite adequacy and reliability determination and assessment. The paper has also taken an important step towards effective and meaningful evaluation of the over- all system quality measures by offering a general frame- work for evaluation of power system performance qual- ity indices. The novel framework is based on three meta- phors (dimensions) representing the relationship between certain system generation capacity and the demand. The first metaphor defines whether or not the capacity exists, the second metaphor defines whether or not the capacity is needed, and the last metaphor defines whether or not the capacity can reach (delivered to) the demand. The eight possible combinations associated with the 0/1 (Yes/No) values of the thre metaphors would, in turn, e Copyright © 2011 SciRes. EPE 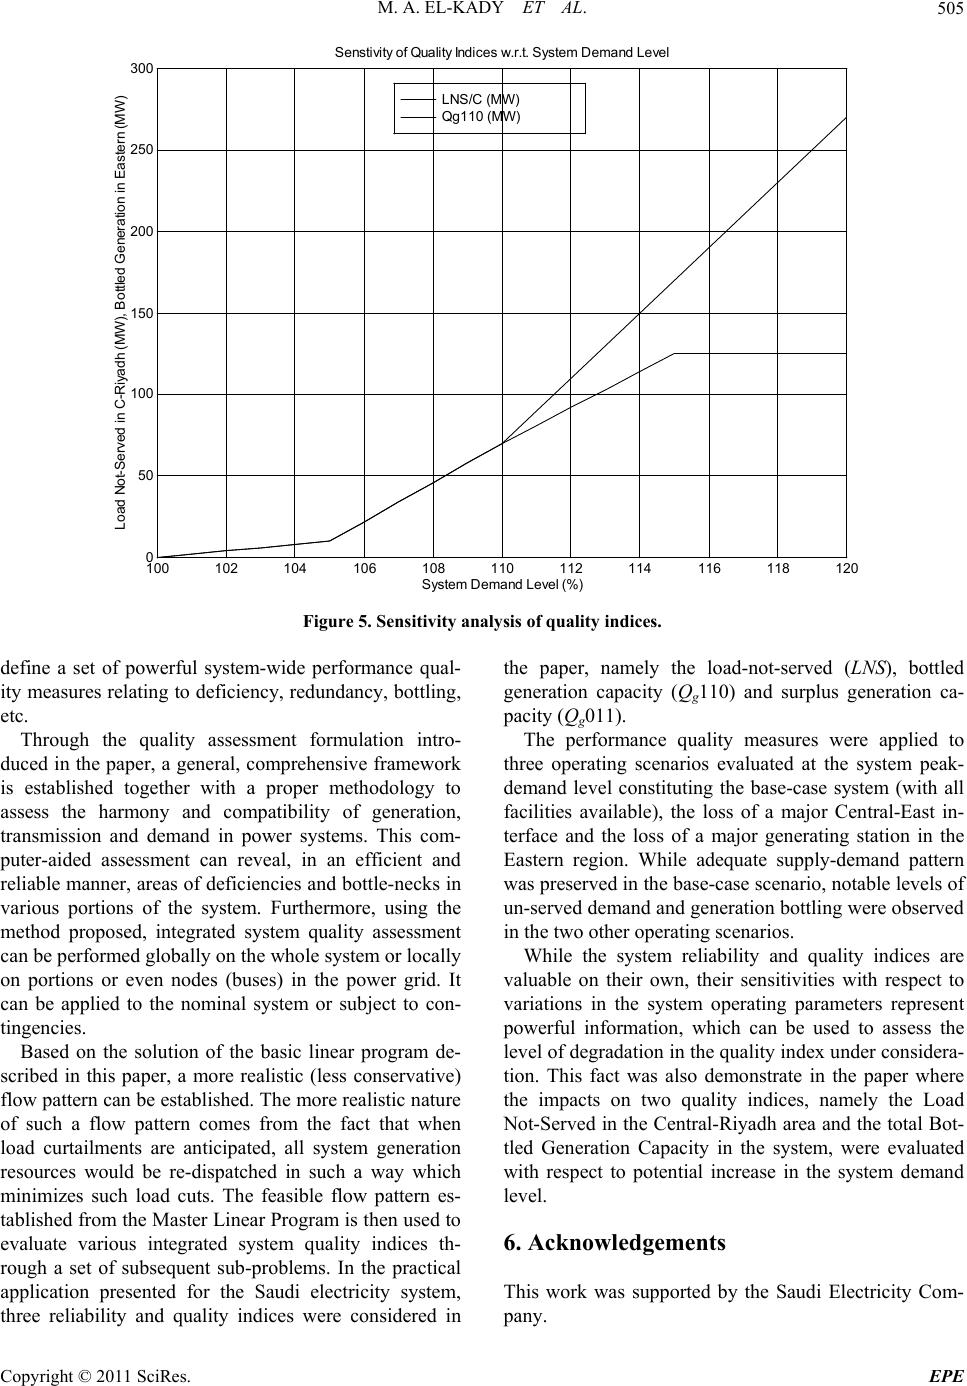 M. A. EL-KADY ET AL.505 LN S/ C ( M W ) Qg110 ( M W) 100 102 104106 108 110 112 114116 118 120 0 50 100 150 200 250 300 Sy st em Demand Level ( % ) Load N ot - Served in C- R iyadh (M W) , Bot t led G ene r at ion in East er n (M W) Senstivity of Quality In dices w.r.t. System Demand Level Figure 5. Sensitivity analysis of quality indices. define a set of powerful system-wide performance qual- ity measures relating to deficiency, redundancy, bottling, etc. Through the quality assessment formulation intro- duced in the paper, a general, comprehensive framework is established together with a proper methodology to assess the harmony and compatibility of generation, transmission and demand in power systems. This com- puter-aided assessment can reveal, in an efficient and reliable manner, areas of deficiencies and bottle-necks in various portions of the system. Furthermore, using the method proposed, integrated system quality assessment can be performed globally on the whole system or locally on portions or even nodes (buses) in the power grid. It can be applied to the nominal system or subject to con- tingencies. Based on the solution of the basic linear program de- scribed in this paper, a more realistic (less conservative) flow pattern can be established. The more realistic nature of such a flow pattern comes from the fact that when load curtailments are anticipated, all system generation resources would be re-dispatched in such a way which minimizes such load cuts. The feasible flow pattern es- tablished from the Master Linear Program is then used to evaluate various integrated system quality indices th- rough a set of subsequent sub-problems. In the practical application presented for the Saudi electricity system, three reliability and quality indices were considered in the paper, namely the load-not-served (LNS), bottled generation capacity (Qg110) and surplus generation ca- pacity (Qg011). The performance quality measures were applied to three operating scenarios evaluated at the system peak- demand level constituting the base-case system (with all facilities available), the loss of a major Central-East in- terface and the loss of a major generating station in the Eastern region. While adequate supply-demand pattern was preserved in the base-case scenario, notable levels of un-served demand and generation bottling were observed in the two other operating scenarios. While the system reliability and quality indices are valuable on their own, their sensitivities with respect to variations in the system operating parameters represent powerful information, which can be used to assess the level of degradation in the quality index under considera- tion. This fact was also demonstrate in the paper where the impacts on two quality indices, namely the Load Not-Served in the Central-Riyadh area and the total Bot- tled Generation Capacity in the system, were evaluated with respect to potential increase in the system demand level. 6. Acknowledgements This work was supported by the Saudi Electricity Com- pany. Copyright © 2011 SciRes. EPE  M. A. EL-KADY ET AL. 506 7. References [1] S. Torre, A. Conejo and J. Contreras, “Transmission Ex- pansion Planning in Electricity Markets,” IEEE Transac- tions on Power Systems, Vol. 23, No. 1, 2008, pp. 238- 248. doi:10.1109/TPWRS.2007.913717 [2] M. El-Kady, M. El-Sobki and N. Sinha, “Reliability Evaluation for Optimally Operated Large Electric Power Systems,” IEEE Transactions on Reliability, Vol. R35, No. 1, 1986, pp. 41-47. doi:10.1109/TR.1986.4335340 [3] M. El-Kady, M. El-Sobki and N. Sinha, “Loss of Load Probability Evaluation Based on Real Time Emergency Dispatch,” Canadian Electrical Engineering Journal, Vol. 10, 1985, pp. 57-61. [4] Q. M. Chen, L. Yan and J. McCalley, “The Risk of High-Order Transmission Contingencies,” Proceedings of the IEEE Power Engineering Society General Meeting, Norristown, 23 July 2007, pp. 1-7. [5] M. El-Kady, B. Alaskar, A. Shaalan and B. Al-Shammri, “Composite Reliability and Quality Assessment of Inter- connected Power Systems,” International Journal for Computation and Mathematic in Electrical and Elec- tronic Engineering (COMPEL), Vol. 26, No. 1, 2007, Paper #SSD05-PES-12. [6] B. Alshammari, M. El-Kady and Y. Al-Turki, “Com- puter-Aided Optimization of Power System Performance Quality Indices,” Proceedings of 3rd Global Conference on Power Control and Optimization, Gold Coast, 2-4 February 2010, p. 51. [7] J. Choi, T. Mount and R. Thomas, “Transmission Expan- sion Planning Using Contingency Criteria,” IEEE Trans- actions on Power Systems, Vol. 22, No. 4, 2007, pp. 2249-2261. doi:10.1109/TPWRS.2007.908478 [8] P. Jirutitijaroen and C. Singh, “Reliability Constrained Multi-Area Adequacy Planning Using Stochastic Pro- gramming with Sample-Average Approximations,” IEEE Transactions on Power Systems, Vol. 23, No. 2, 2008, pp. 405-513. doi:10.1109/TPWRS.2008.919422 [9] R. Billinton and D. Huang, “Effects of Load Forecast Uncertainty on Bulk Electric System Reliability Evalua- tion,” IEEE Transactions on Power Systems, Vol. 23, No. 2, 2008, pp. 418-425. doi:10.1109/TPWRS.2008.920078 [10] H. Jun, Y. Zhao, P. Lindsay and P. Kit, “Flexible Trans- mission Expansion Planning with Uncertainties in an Electricity Market,” IEEE Transactions on Power Sys- tems, Vol. 24, No. 1, 2009, pp. 479-488. doi:10.1109/TPWRS.2008.2008681 [11] P. Gill, W. Murray and M. Wright, “Practical Optimiza- tion,” Academic Press, London, 1981. Copyright © 2011 SciRes. EPE  M. A. EL-KADY ET AL.507 Copyright © 2011 SciRes. EPE Appendix Quality Indices for 2-Bus Sample System GENERATION INDICES (Needed-Exist-Can-reach) L P G P T P G PT P LNS SA 000 SP 001 RE 010 SU 011 DE 100 SF 101 BO 110 UT 111 50 70 40 90 100 10 20 0 20 0 0 0 10 40 105 70 100 90 110 35 0 0 0 0 0 20 0 70 105 70 100 120 110 35 15 0 0 0 5 30 0 70 100 10 70 95 90 90 0 0 0 0 25 60 0 10 100 10 70 195 90 90 95 0 0 0 30 60 0 10 100 10 70 95 130 90 0 0 0 0 25 60 0 10 100 10 70 195 130 90 95 0 0 0 30 60 0 10 100 80 70 95 110 30 0 0 0 0 15 0 10 70 100 80 70 115 110 30 51 0 0 0 20 0 10 70 90 70 100 95 120 20 0 5 0 0 0 20 0 70 90 70 100 145 120 20 45 10 0 0 0 20 0 70 90 120 100 125 135 0 5 0 20 10 0 0 0 90 50 70 300 80 305 0 0 10 0 20 0 0 0 50 50 70 300 310 305 0 10 230 0 20 0 0 0 50 90 100 40 100 80 50 0 0 10 0 0 0 50 40 90 100 40 130 80 50 30 0 10 0 0 0 50 40 90 100 40 100 250 50 0 0 10 0 0 0 50 40 90 100 40 130 250 50 30 0 10 0 0 0 50 40 140 130 70 140 135 70 0 0 0 0 10 0 60 70 140 130 70 170 135 70 30 0 0 0 10 0 60 70 140 130 70 140 145 70 0 0 0 0 10 0 60 70 140 130 70 170 145 70 30 0 0 0 10 0 60 70 130 70 140 80 150 60 0 0 0 0 0 10 0 70 130 70 140 150 150 60 10 10 0 0 0 60 0 70 90 200 190 210 220 0 10 0 10 100 0 0 0 90 50 90 100 95 105 0 0 5 0 40 0 0 0 50 50 90 100 105 105 0 5 10 0 40 0 0 0 50 G = Generation T = Transmission L = Load LNS = load Not Served UT = Utilized BO = Bottled SF = Short-fall DE = Deficient SU = Surplus RE = Redundant SP = Spared SA = Saved
|