Paper Menu >>
Journal Menu >>
 Energy and Power Engineering, 2011, 3, 450-477 doi:10.4236/epe.2011.34056 Published Online September 2011 (http://www.SciRP.org/journal/epe) Copyright © 2011 SciRes. EPE Analytical Approach for the Systematic Research of the Periodic Ferroresonant Solutions in the Power Networks Fathi Ben Amar1,2, Rachid Dhifaoui2 1Department of Technology, Preparatory Institute for Engineering Studies of Sfax (IPEIS), Sfax, Tunisia 2Electric Networks and Machines Research Unit, Insat, Tunisia E-mail: Fathi.Benamar@ipeis.rnu.tn, Rachid.Dhifaoui@insat.rnu.tn Received June 7, 2011; revised July 17, 2011; accepted July 24, 2011 Abstract Ferroresonance is a complex and little known electrotechnical phenomenon. This lack of knowledge means that it is voluntarily considered responsible for a number of unexplained destructions or malfunctioning of equipment. The mathematical framework most suited to the general study of this phenomenon is the bifurca- tion theory, the main tool of which is the continuation method. Nevertheless, the use of a continuation proc- ess is not devoid of difficulties. In fact, to continue the solutions isolats which are closed curves, it is neces- sary to know a solution belonging to this isolated curve (isolat) to initialise the continuation method. The principal contribution of this article is to develop an analytical method allowing systematic calculation of this initial solution for various periodic ferroresonant modes (fundamental, harmonic and subharmonic) appear- ing on nonlinear electric system. The approach proposed uses a problem formulation in the frequency do- main. This method enables to directly determine the solution in steady state without computing of the tran- sient state. When we apply this method to the single-phase ferroresonant circuits (series and parallels con- figurations), we could easily calculate an initial solution for each ferroresonant mode that can be established. Knowing this first solution, we show how to use this analytical approach in a continuation technique to find the other solutions. The totality of the obtained solutions is represented in a plane where the abscissa is the amplitude of the supply voltage and the ordinate the amplitude of the system’s state variable (flux or voltage). The curve thus obtained is called “bifurcation diagram”. We will be able to then obtain a synthetic knowl- edge of the possible behaviors of the two circuits and particularly the limits of the dangerous zones of the various periodic ferroresonant modes that may appear. General results related to the series ferroresonance and parallel ferroresonance, obtained numerically starting from the theoretical and real cases, are illustrated and discussed. Keywords: Transformer, Ferroresonance, Fundamental Mode, Harmonic Mode, Subharmonic Mode, Fractional Mode, Isolat, Limit Point, Bifurcation, Dangerous Zone 1. Introduction The ferroresonance is a nonlinear resonance phenome- non that can affect the electrical transmission and distri- bution networks. It indicates all oscillating phenomena, generally periodic, which particularly appear on all net- works at capacitive dominant (single-phase or polyphase) in interaction with a ferromagnetic nonlinear element (unloaded transformer). This phenomenon is characterized by the possibility of existence of several stable steady states for a given con- figuration and parameter values. These various operating modes, except the normal state, are obviously undesir- able. They lead indeed either to out-of-tolerance over- voltages with values several times in excess of the net- work nominal voltage (case of fundamental or harmonic ferroresonance), or to overcurrents not less dangerous for the material (case of subharmonic ferroresonance) [1-4]. Modeling a ferroresonant circuit leads to a set of nonlinear differential Equations depending on various physical parameters. The mathematical framework ada- pted to the study of these dynamic systems is the bifurca- tion theory [4-7]. The essential tool within this frame- work is the continuation method. It makes it possible to obtain a global view of the phenomenon and to answer to concrete problems faced by the power system operator. However, in order that this continuation method can function correctly, we must have an initial solution be- 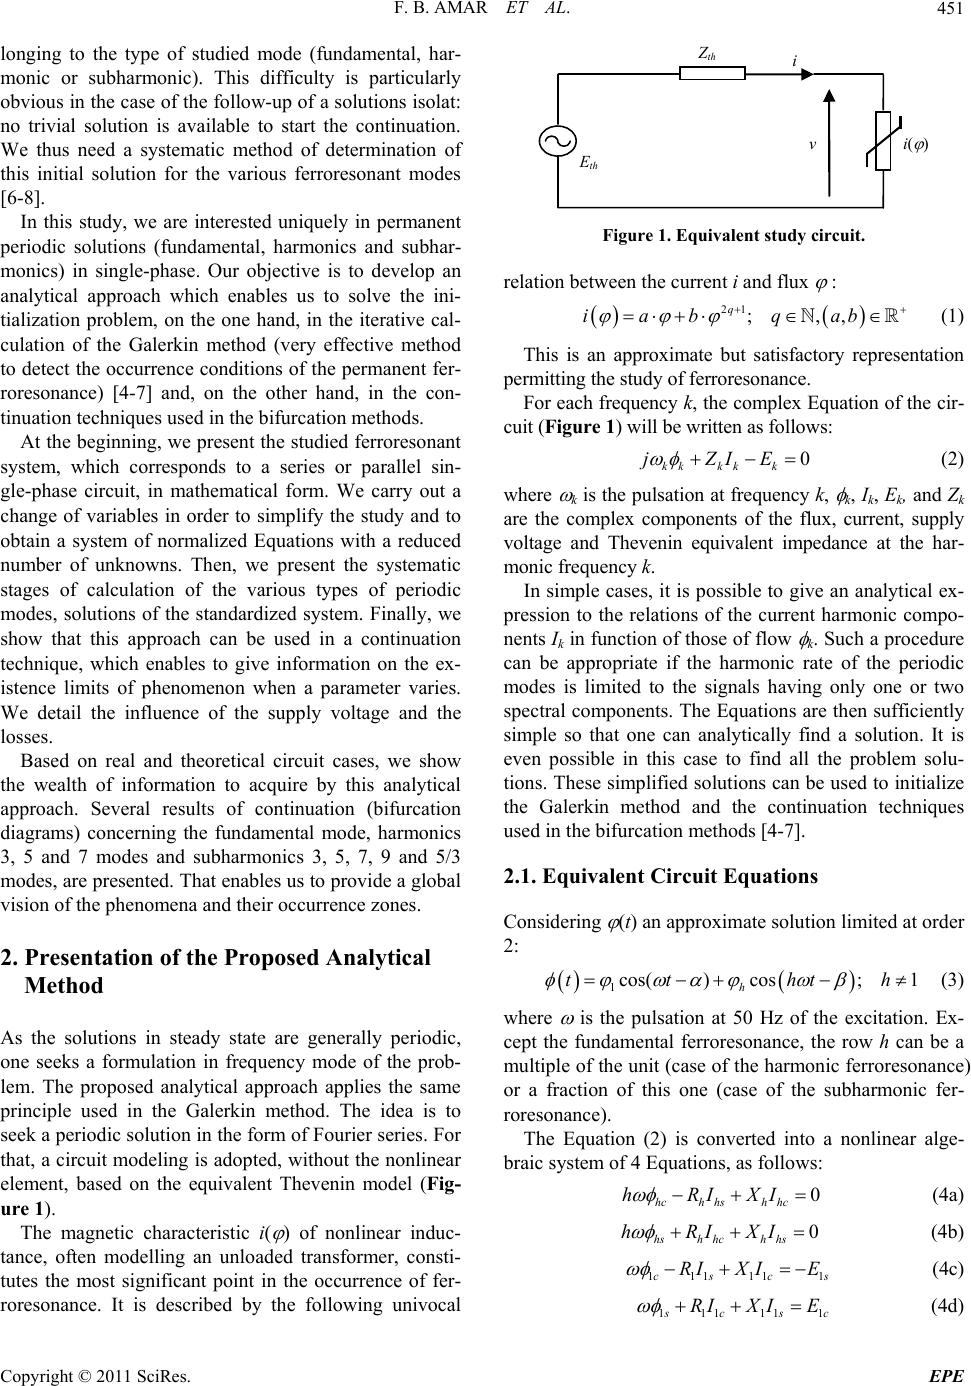 F. B. AMAR ET AL.451 longing to the type of studied mode (fundamental, har- monic or subharmonic). This difficulty is particularly obvious in the case of the follow-up of a solutions isolat: no trivial solution is available to start the continuation. We thus need a systematic method of determination of this initial solution for the various ferroresonant modes [6-8]. In this study, we are interested uniquely in permanent periodic solutions (fundamental, harmonics and subhar- monics) in single-phase. Our objective is to develop an analytical approach which enables us to solve the ini- tialization problem, on the one hand, in the iterative cal- culation of the Galerkin method (very effective method to detect the occurrence conditions of the permanent fer- roresonance) [4-7] and, on the other hand, in the con- tinuation techniques used in the bifurcation methods. At the beginning, we present the studied ferroresonant system, which corresponds to a series or parallel sin- gle-phase circuit, in mathematical form. We carry out a change of variables in order to simplify the study and to obtain a system of normalized Equations with a reduced number of unknowns. Then, we present the systematic stages of calculation of the various types of periodic modes, solutions of the standardized system. Finally, we show that this approach can be used in a continuation technique, which enables to give information on the ex- istence limits of phenomenon when a parameter varies. We detail the influence of the supply voltage and the losses. Based on real and theoretical circuit cases, we show the wealth of information to acquire by this analytical approach. Several results of continuation (bifurcation diagrams) concerning the fundamental mode, harmonics 3, 5 and 7 modes and subharmonics 3, 5, 7, 9 and 5/3 modes, are presented. That enables us to provide a global vision of the phenomena and their occurrence zones. 2. Presentation of the Proposed Analytical Method As the solutions in steady state are generally periodic, one seeks a formulation in frequency mode of the prob- lem. The proposed analytical approach applies the same principle used in the Galerkin method. The idea is to seek a periodic solution in the form of Fourier series. For that, a circuit modeling is adopted, without the nonlinear element, based on the equivalent Thevenin model (Fig- ure 1). The magnetic characteristic i( ) of nonlinear induc- tance, often modelling an unloaded transformer, consti- tutes the most significant point in the occurrence of fer- roresonance. It is described by the following univocal E th i( ) Z th v i Figure 1. Equivalent study circuit. relation between the current i and flux : 21 ;,, q iab qab (1) This is an approximate but satisfactory representation permitting the study of ferroresonance. For each frequency k, the complex Equation of the cir- cuit (Figure 1) will be written as follows: 0 kk kk k jZIE (2) where k is the pulsation at frequency k, k, Ik, Ek, and Zk are the complex components of the flux, current, supply voltage and Thevenin equivalent impedance at the har- monic frequency k. In simple cases, it is possible to give an analytical ex- pression to the relations of the current harmonic compo- nents Ik in function of those of flow k. Such a procedure can be appropriate if the harmonic rate of the periodic modes is limited to the signals having only one or two spectral components. The Equations are then sufficiently simple so that one can analytically find a solution. It is even possible in this case to find all the problem solu- tions. These simplified solutions can be used to initialize the Galerkin method and the continuation techniques used in the bifurcation methods [4-7]. 2.1. Equivalent Circuit Equations Considering (t) an approximate solution limited at order 2: 1cos() cos;1 h tt ht h (3) where is the pulsation at 50 Hz of the excitation. Ex- cept the fundamental ferroresonance, the row h can be a multiple of the unit (case of the harmonic ferroresonance) or a fraction of this one (case of the subharmonic fer- roresonance). The Equation (2) is converted into a nonlinear alge- braic system of 4 Equations, as follows: 0 hch hsh hc hRIXI (4a) 0 hsh hch hs hRIXI (4b) 111 111cs c RIX IEs (4c) 11111 1 s cs RIX IEc (4d) Copyright © 2011 SciRes. EPE 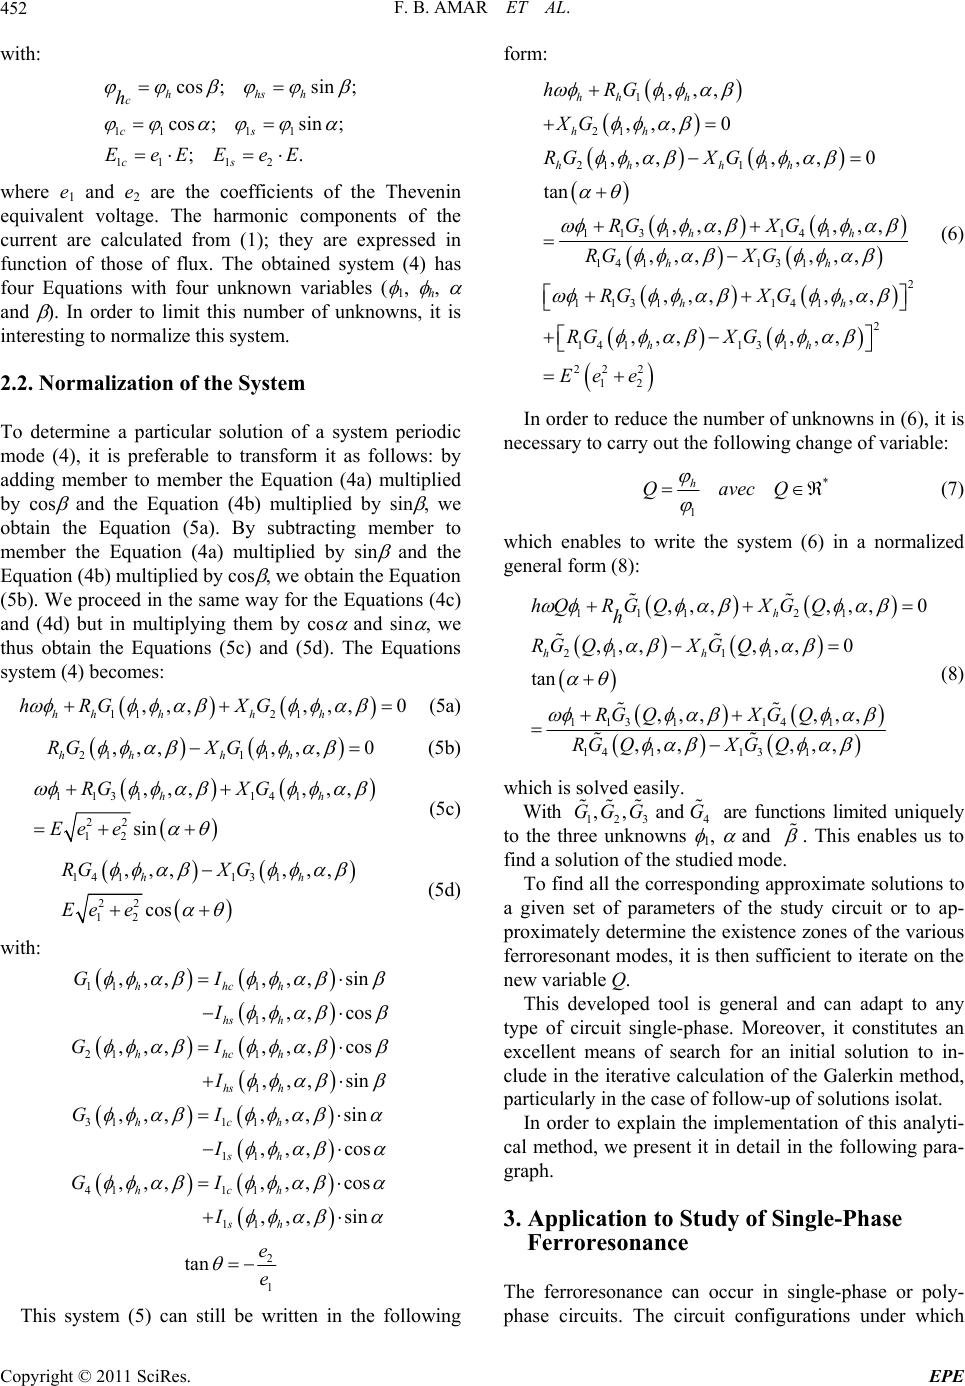 F. B. AMAR ET AL. 452 with: 11 11 11 12 cos ;sin; cos ;sin; ;. hhsh c cs cs h EeEEeE where e1 and e2 are the coefficients of the Thevenin equivalent voltage. The harmonic components of the current are calculated from (1); they are expressed in function of those of flux. The obtained system (4) has four Equations with four unknown variables ( 1, h, and ). In order to limit this number of unknowns, it is interesting to normalize this system. 2.2. Normalization of the System To determine a particular solution of a system periodic mode (4), it is preferable to transform it as follows: by adding member to member the Equation (4a) multiplied by cos and the Equation (4b) multiplied by sin , we obtain the Equation (5a). By subtracting member to member the Equation (4a) multiplied by sin and the Equation (4b) multiplied by cos , we obtain the Equation (5b). We proceed in the same way for the Equations (4c) and (4d) but in multiplying them by cos and sin , we thus obtain the Equations (5c) and (5d). The Equations system (4) becomes: 11 21 ,,,,,, 0 hh hhh hRG XG (5a) 21 11 ,,,,,, 0 hh hh RGX G (5b) 1131 141 22 12 ,,, ,,, sin hh RGX G Ee e (5c) 14 113 1 22 12 ,,, ,,, cos h RGX G Ee e h (5d) with: 11 1 1 21 1 1 311 1 11 4111 11 ,,,,,, sin ,,, cos ,,,,,, cos ,,, sin ,,,,,, sin ,,, cos ,,,,,, cos ,,, sin hhch hs h hhch hs h hch sh hch sh GI I GI I GI I GI I 2 1 tane e This system (5) can still be written in the following form: 11 21 21 11 1131141 14 113 1 2 1131141 2 14 113 1 2 ,,, ,,, 0 ,,,,,, 0 tan ,,, ,,, ,,, ,,, ,,, ,,, ,,, ,,, hh h hh hh hh hh hh hh hh hRG XG RGXG RGX G RGX G RGX G RGX G E 22 12 ee (6) In order to reduce the number of unknowns in (6), it is necessary to carry out the following change of variable: * 1 h QavecQ (7) which enables to write the system (6) in a normalized general form (8): 111 21 21 11 113 114 1 14 1131 ,,,,,, 0 ,,,,,, 0 tan ,,, ,,, ,,, ,,, h hh hQRG QXGQ h RGQX GQ RGQXGQ RGQX GQ (8) which is solved easily. With 123 are functions limited uniquely to the three unknowns 1, and 4 ,, and GG GG . This enables us to find a solution of the studied mode. To find all the corresponding approximate solutions to a given set of parameters of the study circuit or to ap- proximately determine the existence zones of the various ferroresonant modes, it is then sufficient to iterate on the new variable Q. This developed tool is general and can adapt to any type of circuit single-phase. Moreover, it constitutes an excellent means of search for an initial solution to in- clude in the iterative calculation of the Galerkin method, particularly in the case of follow-up of solutions isolat. In order to explain the implementation of this analyti- cal method, we present it in detail in the following para- graph. 3. Application to Study of Single-Phase Ferroresonance The ferroresonance can occur in single-phase or poly- phase circuits. The circuit configurations under which Copyright © 2011 SciRes. EPE  F. B. AMAR ET AL.453 249 this phenomenon can occur are endless [9-11]. We dis- tinguish the configurations known as series (resp. paral- lel), where we find a capacity in series (resp. in parallel) with the nonlinear element and the source voltage. Frequently, the encountered practical situations are generally three-phase but, thanks to an adapted modeling, they can be transformed into single-phase ferroresonance cases [2-4]. This is why we have chosen in our study a single-phase representation of the studied system (series or parallel type). 3.1. Study of Parallel Ferroresonance We apply the proposed approach to the research of the periodic ferroresonant modes of the circuit of Figure 2, which enables to study the problems of the parallel fer- roresonance. It is about a single-phase model of an op- eration of voltage restoration between a sinusoidal volt- age source and an unloaded power transformer, through an underground cable or a long overhead line [10]. It is the capacity of the line which is the responsible element revealing the phenomenon. The physical parameters of this circuit are: E: amplitude of the supply voltage e(t) = E cos(100t), Ct: equivalent capacitance of the circuit, Lg, Ld: linear inductances of the circuit, Rg, Rd: series losses of the circuit, Rt: parallel losses of the circuit. The magnetic characteristic is defined by: 3 1,841061 10i . It corresponds to a real power transformer, single-phase, of 360 MVA and nominal primary voltage 130 kV. By a judicious choice of the circuit parameters, we can determine the various possible modes of fundamental, harmonic and subharmonic ferroresonance [12-15]. 3.1.1. Search for Integer Subharmonics Modes In this case, the row h is a simple fraction of the unit. To fix the ideas, we detail here the example of the subhar- monic mode 3 (h = 1/3, we use the notation SH3). We choose the case where the study circuit parameters (Fig- ure 2) are: Lg = 2.25 H; Rg = 4 ; Ct = 43.5 F; Rt = 0.1 M; Ld = 0.1 H; Rd = 1 , which represent a theoretical case allowing the study of the SH3. i= f( ) e(t) R g L g R d L d R t Figure 2. Parallel, single-phase, nonlinear ferroresonant cir- cuit. We start then by calculating the Fourier coefficients of the harmonic currents I1 and I1/3 by virtue of relation i( ). We obtain: 11 1223 3 4455 11 12233 3 4455 16 67 78 991010 16 67 78 8 991010 cos coscos cos cos sin sinsin sin sin coscos cos cos cos sinsin sin sin sin c s c s 3 8 I BB B BB IB BB BB IB B B BB IB B B BB (9) with: 98 27 1111 1111 333 3 63 45 11 11 33 872 365 9 2111111 33 3 83654 9 3111111 333 2 9 411 126 6302520 256 5040 7560 504 126037805040 256 252 15121260 256 252 256 b Bk k B k B k B 4 11 3 745 11 33 27 9 511 3 9872 6111 1111 33 36 54 111 3 9276345 9 71 111111 3333 504 36 256 126 6302520 256 5040 7560 84 151216803780 256 h k B b Bk k B 27 6345 9 8111111 333 836 9 91111 33 36 9 101 1 3 12 3 4 5678 910 756 12602520 256 72 252 256 84 256 ;2;4;2 72;;3,23; 6; 36 k B k B k B 5; Copyright © 2011 SciRes. EPE 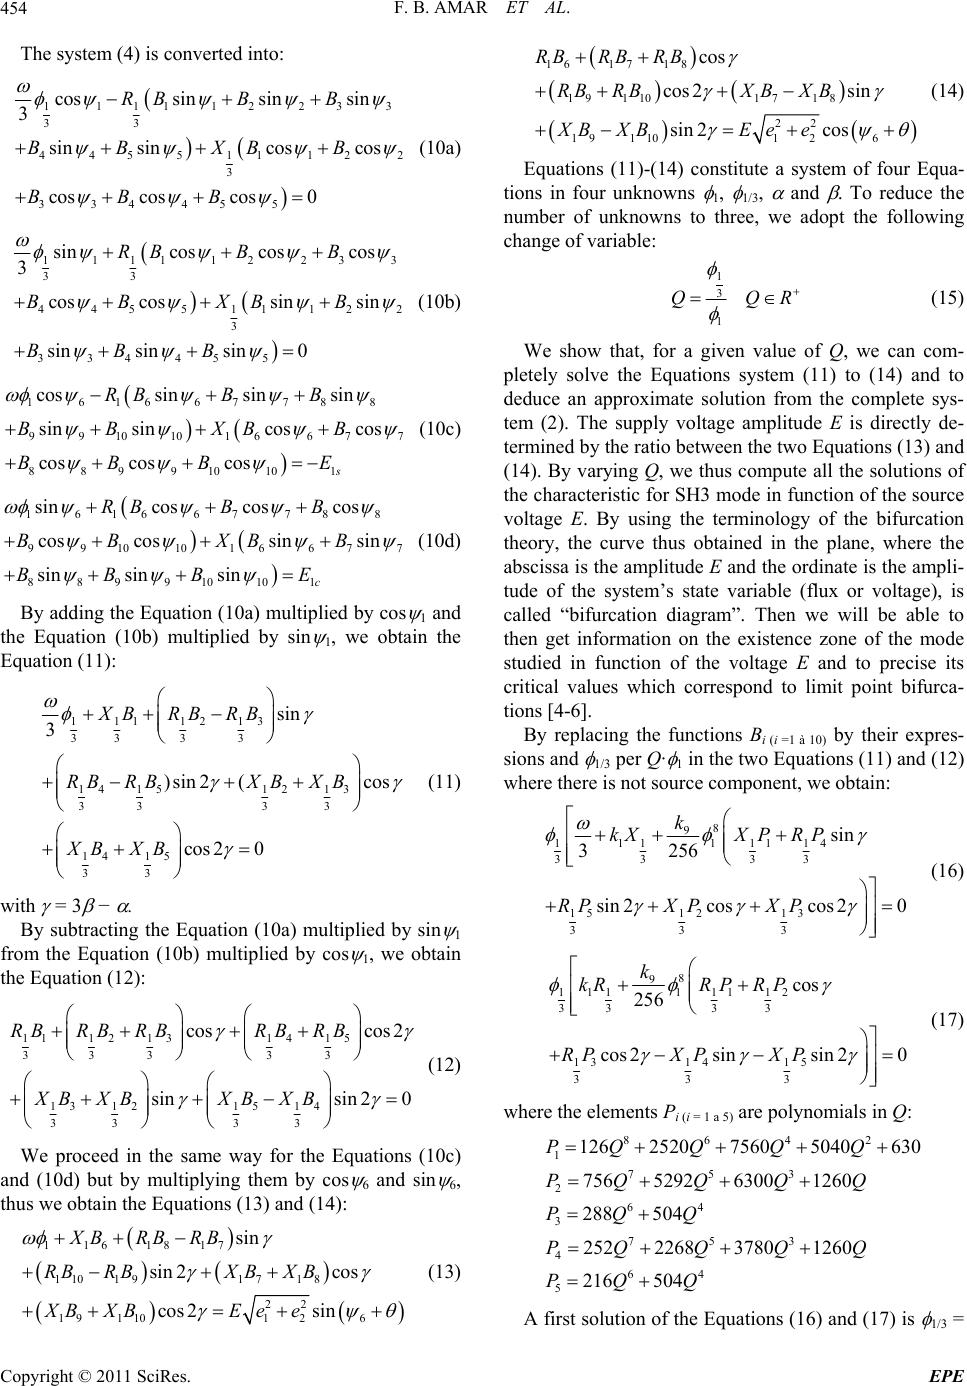 F. B. AMAR ET AL. 454 The system (4) is converted into: 111112233 33 44551112 3 334455 cossinsinsin 3 sinsincos cos cos cos cos0 RB BB BB XBB BBB 2 (10a) 111112 23 33 44551112 3 334455 sincoscoscos 3 coscossin sin sinsinsin 0 RB BB BB XBB BBB 3 2 (10b) 161667788 9910101 6677 8899 10101 cossin sin sin sinsincos cos cos coscoss RB B B BBXB B BBB E (10c) 16166778 8 9910101 6677 8899 10101 sincos cos cos coscossin sin sin sinsinc RB B B BB XBB BBB E (10d) By adding the Equation (10a) multiplied by cos th 1 and e Equation (10b) multiplied by sin 1, we obtain the Equation (11): 111 1213 3333 14 151213 333 3 14 15 33 sin 3 )sin2 (cos cos 20 XBRB RB RBRBX BXB XB XB (11) with = 3 − . the Equation (10a) multiplied by sin 1 fr By subtracting om the Equation (10b) multiplied by cos 1, we obtain the Equation (12): 1112 1314 15 333 33 13 1215 14 33 33 coscos 2 sinsin 20 RBRB RBRB RB XB XBXB XB (12) We proceed in the same way for the Equations (10c) and (10d) but by multiplying them by cos 6 and sin 6, thus we obtain the Equations (13) and (14): 116 1817 110 191718 22 191101 26 sinX BRBRB 1617 18 19 1101718 22 191101 26 cos cos 2sin sin 2cos RBRB RB RBRBXBXB XBXBEee (14) Equations (11)-(14) constitute a system of four Equa- tions in four unknowns 1, 1/3, and . To reduc number of unknowns to three, we adopt the follo change of variable: e the wing 1 3 1 QQR (15) We show that, forQ a given value of , we can com- pletely solve the Equations system (11) to (14) and to deduce an approximate solution from tem (2). The supply voltage amplitu termined by the ratio between the two Equations (13) and (1 the complete sys- de E is directly de- 4). By varying Q, we thus compute all the solutions of the characteristic for SH3 mode in function of the source voltage E. By using the terminology of the bifurcation theory, the curve thus obtained in the plane, where the abscissa is the amplitude E and the ordinate is the ampli- tude of the system’s state variable (flux or voltage), is called “bifurcation diagram”. Then we will be able to then get information on the existence zone of the mode studied in function of the voltage E and to precise its critical values which correspond to limit point bifurca- tions [4-6]. By replacing the functions Bi (i =1 à 10) by their expres- sions and 1/3 per Q· 1 in the two Equations (11) and (12) where there is not source component, we obtain: 8 9 111 11114 33 33 1512 13 sin 3 256 sin2coscos 20 kXXP RPX PXP 33 3 kRP (16) 8 9 1111 1112 333 3 1314 15 333 cos 256 cos 2sinsin20 k kRR PR P RPXPX P sin 2cos cos 2sin RBRBX BXB XBXBEee (17) where the elements Pi (i = 1 a 5) are polynomials in Q: A first solution of the Equations (16) and (17) is 1/3 = 8642 1 753 2 64 4 64 5 126 25207560 5040 63 75652926300 1260 25222683780 1260 216 504 PQQQQ PQQQ Q Q PQQQQ PQQ 3 753 288 504PQ 0 (13) Copyright © 2011 SciRes. EPE  F. B. AMAR ET AL. Copyright © 2011 SciRes. EPE 455 0: it corresponds to the harmonic modes. To calculate the subharmonic modes, let us eliminate component -2 -1 0 3 8 9 1 256 k between the Equations (16) and (17). We obtain a rela- tion in of type: ecossincos2sin2abc d (18) with: 12 33 22 14 114114 33 3 bX P XkPkRP 3 13 3 22 15 115115 33 3 11 3 3 3 3 cRP dXPXkPkR P eR P aRP In order to solve relation (18), we make the following change of variables: (19) which enables to write the relation (18) in form of a sys- tem of two nonlinear Equations to two unknowns (x and y): (20) In order to determine whether the system admi y) = 0 is the Equation of unit circle. For a fixed value of Q and under condition x2 + y2 = 1 (condition which fixes the interval of Q for whic mode exists), the tracing of the representative curves of th 22 sin telque1 avec ,1,1 cos xxy xy y 2 22 ,22 0fxycx bxaydxyce ,1 0gxyxy ts solu- tions on [–1, 1], we will plot the representative curves of the two functions f and g in order to show the existence of a couple (x, y) where they intersect. Let us note that g(x, h a SH3 e two functions f and g of the system (20) shows the existence of two intersection points S1(x1, y1) et S2(x2, y2) (Figure 3). Knowing , the Equation (17) enables to calculate 1. Then 1/3 is given by the relation (15): 11 3 Q Parameter α is deduced by the ratio between the two 1 2 -3 -2 -1 01 23 x = sin y = cos f,y)=0(x S 1 g (x,y)=0 S 2 Figure 3. Intersection of the two representative curves of the functions f(x, y) = 0 and g(x, y) = 0. Equations (13) and (14): (see Equation (21)) Knowing , the same Equations (13) and (14) also enable to calculate the amplitude of source voltage E. Finally, the parameter is deduced starting from the relation (13): 1 3 In this way, we can easily solve the initialization prob- lem observed in the continuation procedures used in the bifurcation method, and in the iterative calculation pro- cedure used in the Galerkin method. The latter method enables to calculate precisely the ferroresonant modes. We present, in Figure 4, the solution waveforms ob- tained by the proposed approach (flux (t) in the target transformer and the voltage V(t) on its terminals), over a period, for the peak value of the nominal voltage (E = 183 kV): it is about a solution of SH3 mode. Indeed, its basic period is three times as equal as the excitation pe- riod T0 = 20 ms. It is then easy to note that, under the influence of the presence of the 1/3 harmonic component, the solution waveform is obviously deformed. From this solution, we vary progressively the parame- ter Q, the two intersection points and system (20) solu- tions. Then, we generate two SH3 solution branches which meet in two limit points BP1 and BP2 (Figure 5(a)), called bifurcation points for which there is stability change. Thus, we obtain a bifurcation diagram of the SH3 ferroresonant mode (noted DB-SH3). To have an overall view of the results, we present this bifurcation diagram in function of voltage E for each variable ( , V, 1, V1, 1/3, V1/3): they are solution isolats (Figures 5(a) and (b)). On the other hand, the diagram surface (in other words 116 181711019171819110 1617 1819 110 ncosRBRB RBRB RB17 1819110 sinsin2cos cos2 cos 2sinsin2 X BRBRBRBRBXBXBX BX B X BX BX BX B ta (21) 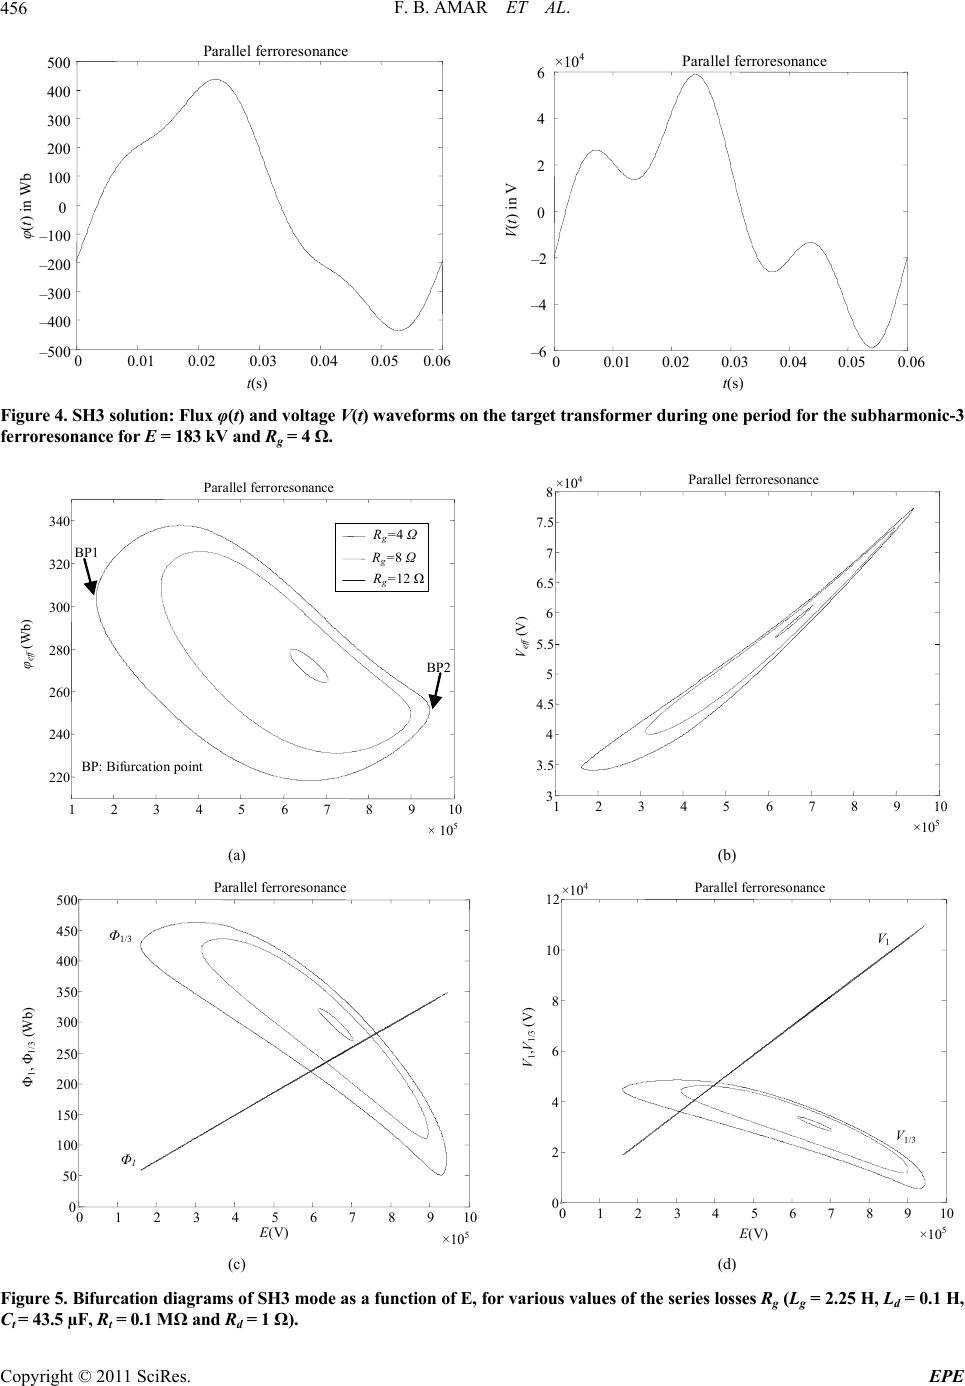 F. B. AMAR ET AL. 456 0 0.01 0.02 0.03 0.04 0.050.06 – 500 – 400 – 300 – 200 – 100 0 100 200 300 400 500 t ( s ) φ(t) in Wb Parallel ferroresonance 00.01 0.02 0.03 0.04 0.05 0.06 –6 6×10 4 Parallel ferroresonance – 4 –2 0 2 4 V (t) in V t(s) e target transformer during one period for the subharmonic-3 Figure 4. SH3 solution: Flux φ(t) and voltage V(t ferroresonance for E = 183 kV and R = 4 Ω. ) waveforms on th g 1 2 3 4 56 7 8 910 × 10 5 220 240 260 280 300 320 340 Parallel ferroresonance φ e ff (Wb) R g =4 Ω R g =8 Ω R g =12 Ω BP1 BP2 BP: Bifurcation point 12345 6 7 8 910 ×10 5 3 3.5 4 4.5 5 5.5 6 6.5 7 7.5 8×10 4 Parallel ferroresonance (V) ff V e (a) (b) 0 1 2 3 45 6 7 89 10 ×10 5 0 50 100 150 200 250 300 350 400 450 500 E (V) Φ 1 , Φ 1/3 (Wb) Parallel ferroresonance Φ 1 Φ 1/3 01 2 3 45 6 7 89 1 0 ×10 5 0 2 4 6 8 10 12 ×10 4 E (V) V 1 ,V 1/3 (V) Parallel ferroresonance V 1/3 V 1 (c) (d) Figure 5. Bifurcation diagrams of SH3 mode as a function of E, for various values of the series losses Rg (Lg = 2.25 H, Ld = 0.1 H, Ct = 43.5 µF, Rt = 0.1 MΩ and Rd = 1 Ω). Copyright © 2011 SciRes. EPE  F. B. AMAR ET AL. Copyright © 2011 SciRes. EPE 457 the existence zone of mode SH3) is more reduced when series losses Rg of system are large. In addition, the minimum voltage of the existence of this ferroresonant mode (where the first bifurcation BP1) increases. In con- trast, the maximum voltage of existence (where the sec- ond bifurcation BP2) decreases. Indeed, in order that this mode persists, it is necessary that the source energy can compensate for the network losses [16,17]. This remains possible for strong voltages. But these voltages are not realistic for an electrical power network. The considera- tions above also apply to the other types of periodic fer- roresonant modes. Let us announce that, for certain values of E, the am- plitude of SH3 component can exceed considerably the amplitude of the 50 Hz component (Figure 5(b)). In fact, the ratio Q (15), which enab pared to that 50 Hz, has for valu The same reasoning is equally applied to calculate the other subharmonics modes. On Figures 6-11, we sum- marize the results of the proposed approach concerning modes SH5, SH7 and SH9 (these are theoretical cases). Qualitatively, the remarks previously quoted on the DB-SH3 are retained for the DB-SH5, DB-SH7 and DB-SH9. On Figure 12, we compare the bifurcation diagrams of the subharmonics 3, 5, 7, 9 modes and the fundamental mode, which can exist simultaneously for the following theoretical case: Lg = 2.25 H, Rg = 1 , Ct = 1100 F, Rt = 0.1 M and Ld = Rd = 0. We then conclude that: Contrary to the fundamental ferroresonance mode, the bifurcation diagrams of the subharmonics modes are solution isolats and no intersection with trivial solutions. The existence domains o e flux (t) and the voltage V(t) decrease when the row of subharmonic increases. These values are always lower than those reached by the fundamental ferroresonance mode. For the same excitation voltage E, different subhar- monic solutions can exist. One or the other of the so- lutions appears according to the value of the initial conditions (initial charge on capacitor, remanent flux in the core of the target transformer, switching instant, etc.). This methodology permits to treat effectively the ini- tialization problems encountered in the Galerkin method and the continuation methods. 3.1.2. Search for Fractional Subharmonics Modes 1982, EDF recorded a ferroresonance case during th lectric generators of Chas- tang on transformers of nuclear power stations of Chinon [5]. Abnormal oscillations at a preponderant frequency of 83.33 Hz are observed. This frequency corresponds to a period les to relativize the SH3 com- e several times the unit. voltage feedback from hydroe In e 0 3 5 T (with T0 = 20 ms is the source period). We apply the proposed analytical method to simulate this mode type, solution of the circuit of Figure 2 mod- eling the voltage feedback. We consider two flux components 1 and 5/3 (h = 5/3 is not a simple unit fraction) and we adopt the following values: Lg = 2.25 H, Rg = 20 , Ct = 4.5 F, Rt = 0.1 M, Ld = 0.1 H and Rd = 7 , which correspond to a line of nominal voltage 225 kV of 370 km and give a network natural frequency of 150 Hz 2π r f gt LC (22) The Galerkin Equations system of is: f these oscillation modes decrease when the row of subharmonic increases. The effective values reaching by th 0 0.01 0.02 0.03 0.040.05 0.06 0.070.080.09 0.1 -500 -400 -300 -200 -100 0 100 200 300 400 500 Parallel ferroresonance 00.01 0.020.03 0.040.050.06 0.07 0.08 0.090.1 -4 -3 t ( s ) φ(t) in Wb -2 -1 0 1 2 3 4×10 4 Parallel ferroresonance V n V(t) i t(s) Figure 6. SH5 solution: Flux φ(t) and voltage V(t) waveforms ferroresonance for E = 183 kV. on the target transformer during one period for the subharmonic-5  F. B. AMAR ET AL. 458 0 0.5 1 1.5 2 2.53 240 250 260 270 280 290 300 310 320 330 340 Parallel ferroresonance 00.511.5 2 2.53 E (V) φ e ff (Wb) BP1 BP2 BP: Bifurcation point ×10 6 ×10⁶ 2 3 4 5 6 7 8×10⁴Parallel ferroresonance Ve ff (V) E (V) (a) 0 0.5 1 1.5 2 2.5 3 ×10⁶ 0 50 100 150 200 250 300 350 400 450 500 Parallel ferroresonance E (V) Φ1, Φ1/5 (Wb) Φ1 Φ1/5 00.5 11.52 2.5 3 ×10 6 0 2 4 6 8 10 12×10 4 Parallel ferroresonance V 1 V 1 , V 1/5 (V) E ( V ) V 1/5 (b) Figure 7. Bifurcation diagrams of SH5 mode as a function of E, for the circuit parameters: Lg = 2.25 H, Ld = 0.1 H, Rt = 0.1 MΩ, Rg = 1 Ω and Rd = 0.5 Ω. (a) Existence zones of the SH5 mode versus applied voltage E. (b) Continuation plitudes of SH5 component and the 50 Hz component. Ct = 129 µF, of the am- 0 0.020.040.060.08 0.10.120.14 -500 -400 -300 -200 -100 0 100 200 300 400 500 Parallel ferroresonance φ(t) in Wb t(s) 00.020.040.060.08 0.1 0.120.14 -2.5 -2 -1.5 -1 -0.5 0 0.5 1 1.5 2 2.5 ×10 4 Parallel ferroresonance V ( t ) in V t ( s ) Figure 8. SH7 solution: Flux φ(t) and voltage V(t) waveforms on the target transformer during one period for the subharmonic-7 ferroresonance for E = 183 kV. Copyright © 2011 SciRes. EPE 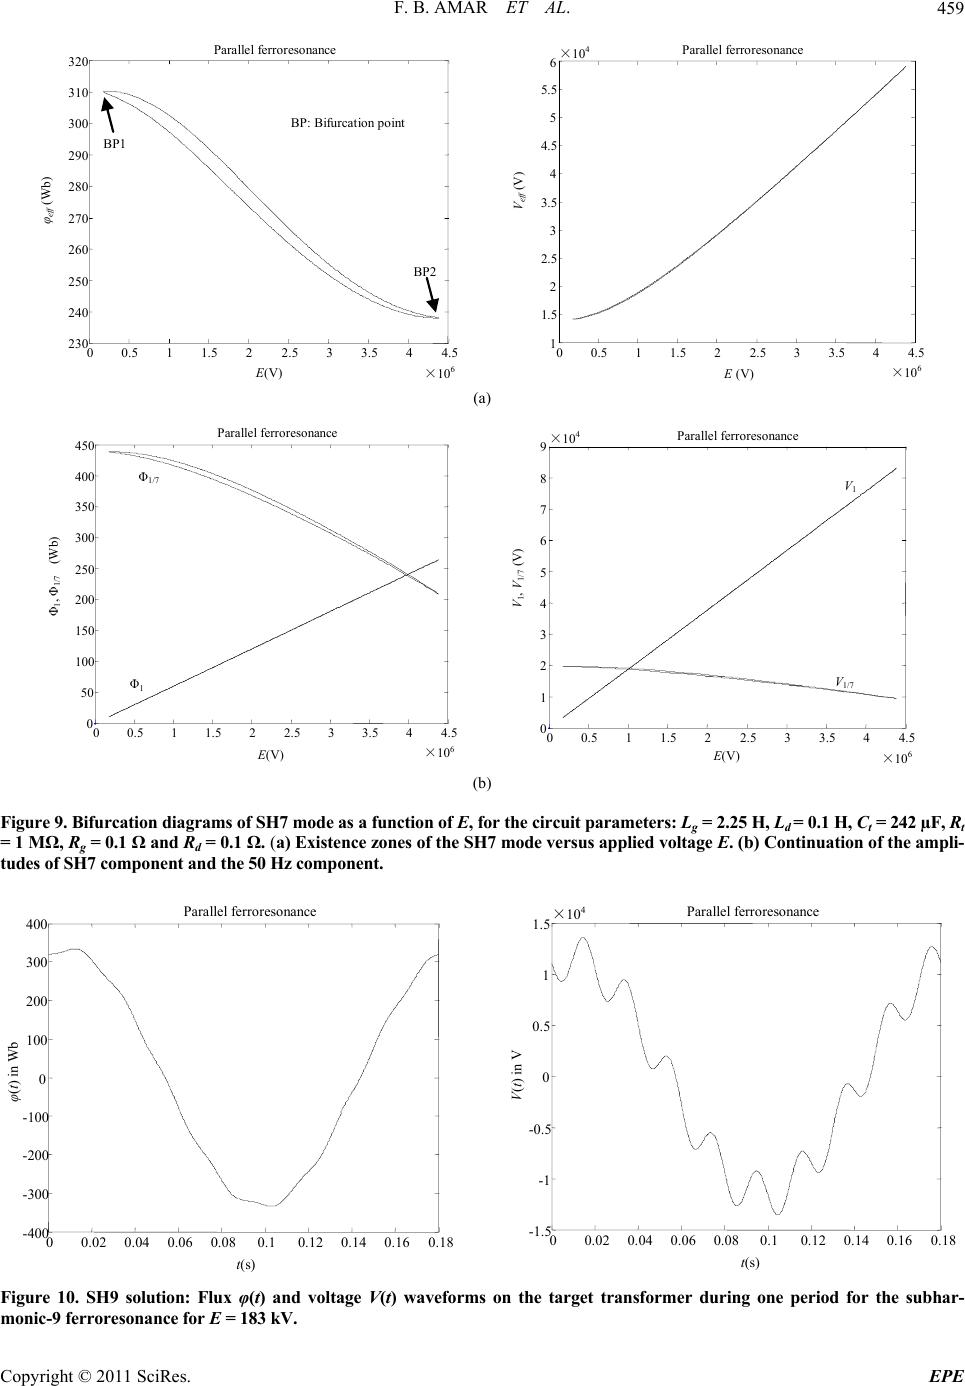 F. B. AMAR ET AL.459 0 0.5 1 1.5 22.5 3 3.5 44.5 ×10 6 230 240 250 260 270 280 290 300 310 320 Parallel ferroresonance φ e ff (Wb) E (V) BP: Bifurcation p oint BP1 BP2 00.511.5 22.5 3 3.5 44.5 ×10⁶ 1 1.5 2 2.5 3 3.5 4 4.5 5 5.5 6×10⁴Parallel ferroresonance Ve ff (V) E (V) (a) 0 0.51 1.52 2.5 3 3.544.5 ×10 6 0 50 100 150 200 250 300 350 400 450 Parallel ferroresonance Φ 1 , Φ 1/7 (Wb) E (V) Φ 1 Φ 1/7 00.5 11.5 22.5 3 3.5 4 4.5 ×10 6 0 1 2 3 4 5 6 7 8 9×10 4 Parallel ferroresonance E (V) V 1 , V 1/7 (V) V 1/7 V 1 (b) Figure 9. Bifurcation diagrams of SH7 mode as a function of E, for the circuit parameters: Lg = 2.25 H, Ld = 0.1 H, Ct = 242 µF, Rt = 1 MΩ, Rg = 0.1 Ω and Rd = 0.1 Ω. (a) Existence zones of the SH7 mode versus applied voltage E. (b) Continuation of the ampli- tudes of SH7 component and the 50 Hz component. 00.02 0.04 0.060.080.1 0.120.140.160.18 -1.5 -1 -0.5 0 0.5 1 1.5×10 4 Parallel ferroresonance V(t) in V t(s) 0 0.02 0.04 0.06 0.08 0.10.120.140.160.18 -400 -300 -200 -100 0 100 200 300 400 Parallel ferroresonance φ(t) in Wb t(s) Figure 10. SH9 solution: Flux φ(t) and voltage V(t) waveforms on the target transformer during one period for the subhar- monic-9 ferroresonance for E = 183 kV. Copyright © 2011 SciRes. EPE 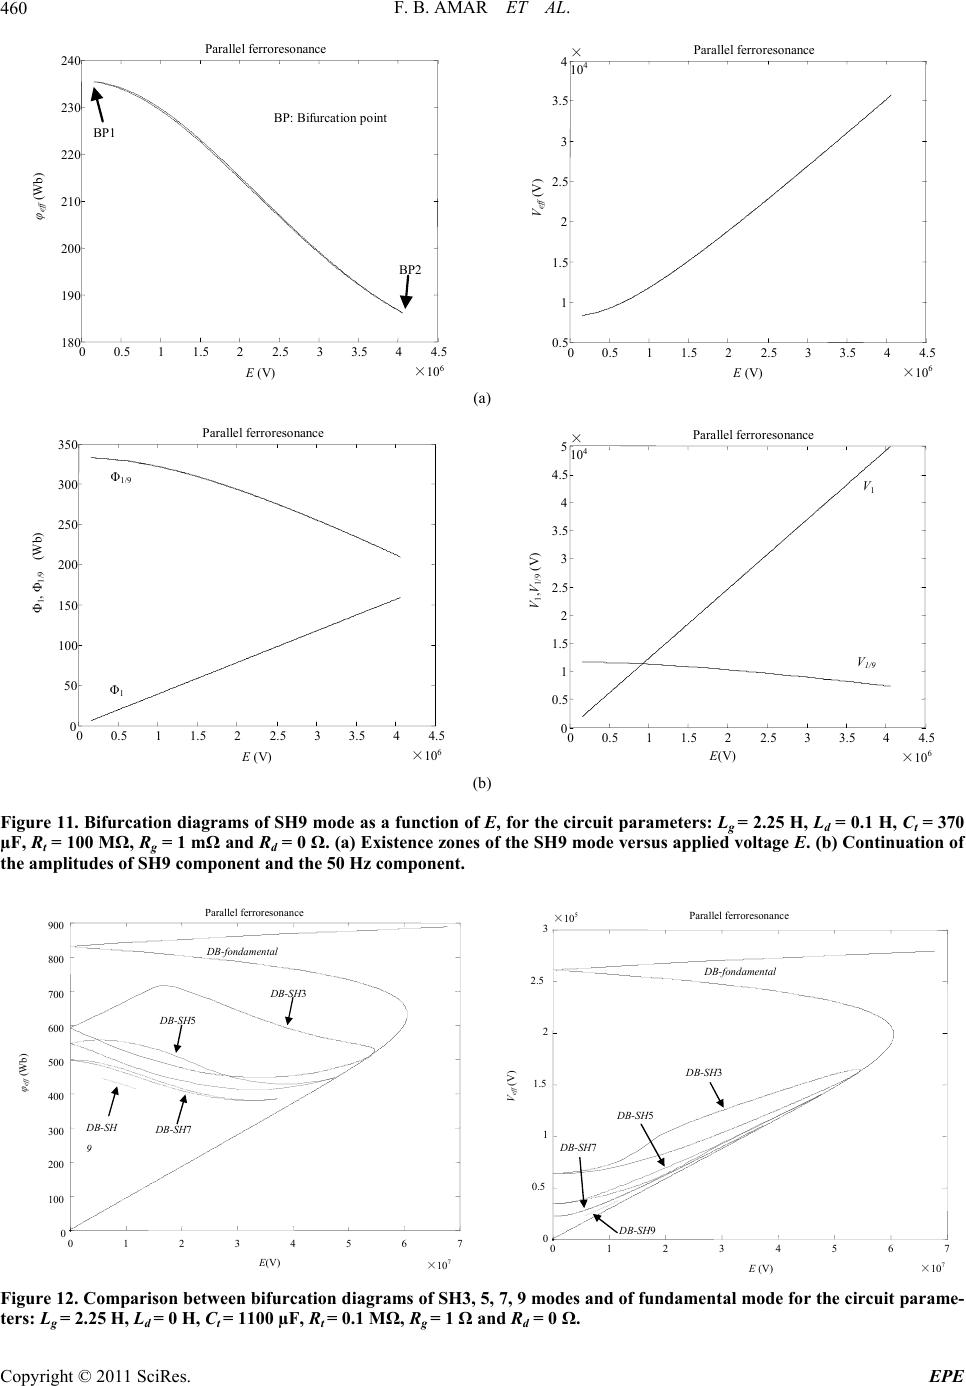 F. B. AMAR ET AL. 460 0 0.5 1 1.5 22.5 3 3.544.5 ×10 6 180 190 200 210 220 230 240 Parallel ferroresonance φ e ff (Wb) E (V) BP: Bifurcation point BP1 BP2 Parallel ferroresonance 00.5 11.5 2 2.5 3 3.5 44.5 ×10 4× 10 4 3.5 6 0.5 1 1.5 2 2.5 3 (V) ff e V (V) E (a) 0 0.5 1 1.5 22.53 3.544.5 ×10 6 0 50 100 150 200 250 300 350 Parallel ferroresonance E (V) Φ 1 , Φ 1/9 (Wb) Φ 1 Φ 1 /9 00.511.52 2.53 3.5 44.5 ×10 6 0 0.5 1 1.5 2 2.5 3 3.5 4 4.5 5× 10 4 Parallel ferroresonance V 1 ,V 1/9 (V) E (V) V 1 V 1/9 (b) Figure 11. Bifurcation diagrams of SH9 mode as a function of E, for the circuit parameters: Lg = 2.25 H, Ld = 0.1 H, Ct = 370 µF, Rt = 100 MΩ, Rg = 1 mΩ and Rd = 0 Ω. (a) Existence zones of the SH9 mode versus applied voltage E. (b) Continuation of the amplitudes of SH9 component and the 50 Hz component. 01 2345 67 ×10 7 0 100 200 300 400 500 600 700 800 900 Parallel ferroresonance D B-fondamental D B-SH7 D B-SH5 D B-SH3 D B-SH 9 φ eff (Wb) E(V) 0 1 2 3 4 5 6 7 ×10 7 0 0.5 1 1.5 2 2.5 3 ×10 5 Parallel ferroresonance D B- f ondamental D B-SH3 D B-S H 5 D B-SH7 D B-SH9 V eff (V) E (V) Figure 12. Comparison between bifurcation diagrams of SH3, 5, 7, 9 modes and of fundamental mode for the circuit parame- ters: Lg = 2.25 H, Ld = 0 H, Ct = 1100 µF, Rt = 0.1 MΩ, Rg = 1 Ω and Rd = 0 Ω. Copyright © 2011 SciRes. EPE  F. B. AMAR ET AL. Copyright © 2011 SciRes. EPE 461 555 55 333 33 555 55 333 33 111111 111 11 1 50 3 50 3 cs c scs cs c sc sc RIX I RIX I RIX IE RIX IE s (23) We obtain a subharmonic 3 mode (Figure 13) whose harmonic 5 of frequency 0 583.33 Hz 3 ff (with 0 0 150 HzfT is the source frequency) is preponderant in its spectrum. It is the synchronization phenomen between the natural period of the free system on 0 3 5 T T without excitation or losses (called Hamiltonian system) and the source period T0, which gives us a fractional subharmonic mode SH3/5 oscillating at a common pe- riod which is here 3T0. We announce that for the ordi- nary ferroresonant circuits, the maximum period of free oscillation is about 100 ms at a few seconds and the minimal period is about of the millisecond. The continuation of this mode in function of the exci- tation E is summarized by the bifurcation diagrams of Figure 14: it is an isolat, result awaited for the subhar- monics modes. These diagrams show that, for the net- work parameters values, ferroresonance may occur for nominal phase-to-neutral network voltage 130 kV (wh ther the possible initial condition values are responsib for initiating ferroresonance). alculation of the periodic modes, of the same excitation period, rich in harmonic h. In this case, flux is described by two harmonic components 1 and h with h positive integer. We speak about the harmonic h mode (we use the notation Hh) when the amplitude h becomes impor- tant and superior to 1. We study, in this paragraph, the harmonic 3, 5 and 7 modes, for real situations of Figure 2. Setting of Equa- tions is similar to that adopted for the subharmonics modes. Figure 15 shows, for Enom = 183 kV, the waveforms of flux (t) and voltage V(t) at the transformer terminals in search case for a H3 mode. By examining these curves, we note that each one contains three similar maximums ource period; that means that the solution - ed is very rich in harmonic 3 (f = 150 Hz). The con- tinuation of this mode, in function of the excitation volt- age E begins with the null trivial solution ( = 0, V = 0) for E = 0 (Figure 16). When E increases, one meets two bifurcations of the limit point type BP1 and BP2 specify- ing the true zone of existence of the H3 mode. In fact, inside this zone where the tension E is understood be- tween 152 kV and 240 kV, the amplitude of the third-harmonic component (V3) is important in front of the fundamental component 50 Hz (V1) (Figure 16(b)) and the corresponding solutions are characterized by dangerous overvoltages (the nominal amplitude of the network voltage is 183 kV). On Figures 17-20, we summarize the results of the H5 and H7 modes (they are real cases). Qualitatively, the arks previously quoted on the DB-H3 are retainedor -H5 and DB-H7. To have an overall view of the results, we compare the real case: Lg = 2.25 H, Rg = 20 , Ct = 1 F, Rt = 0.1 M, Ld = 0.1 H and Rd = 7 . Then we conclude that: over a sob tain e- le rem f the DB 3.1.3. Search for Harmonics Modes e apply the method previously described for systematic bifurcation diagrams of the harmonic 3, 5, 7 modes and the fundamental mode (Figures 21) for the following W c 0 0.01 0.02 0.03 0.04 0.05 0.06 -800 -600 -400 -200 0 200 400 600 800 Parallel ferroresonance φ ( t ) in Wb t (s) 00.010.020.03 0.04 0.05 0.06 -3 -2 -1 0 1 2 3×10 5 Parallel ferroresonance V(t) in V t(s) Figure 13. SH3/5 solution: Flux φ(t) and voltage V(t) waveforms on the target transformer during one period for the frac- tional subharmonic-3/5 ferroresonance for E = 183 kV. 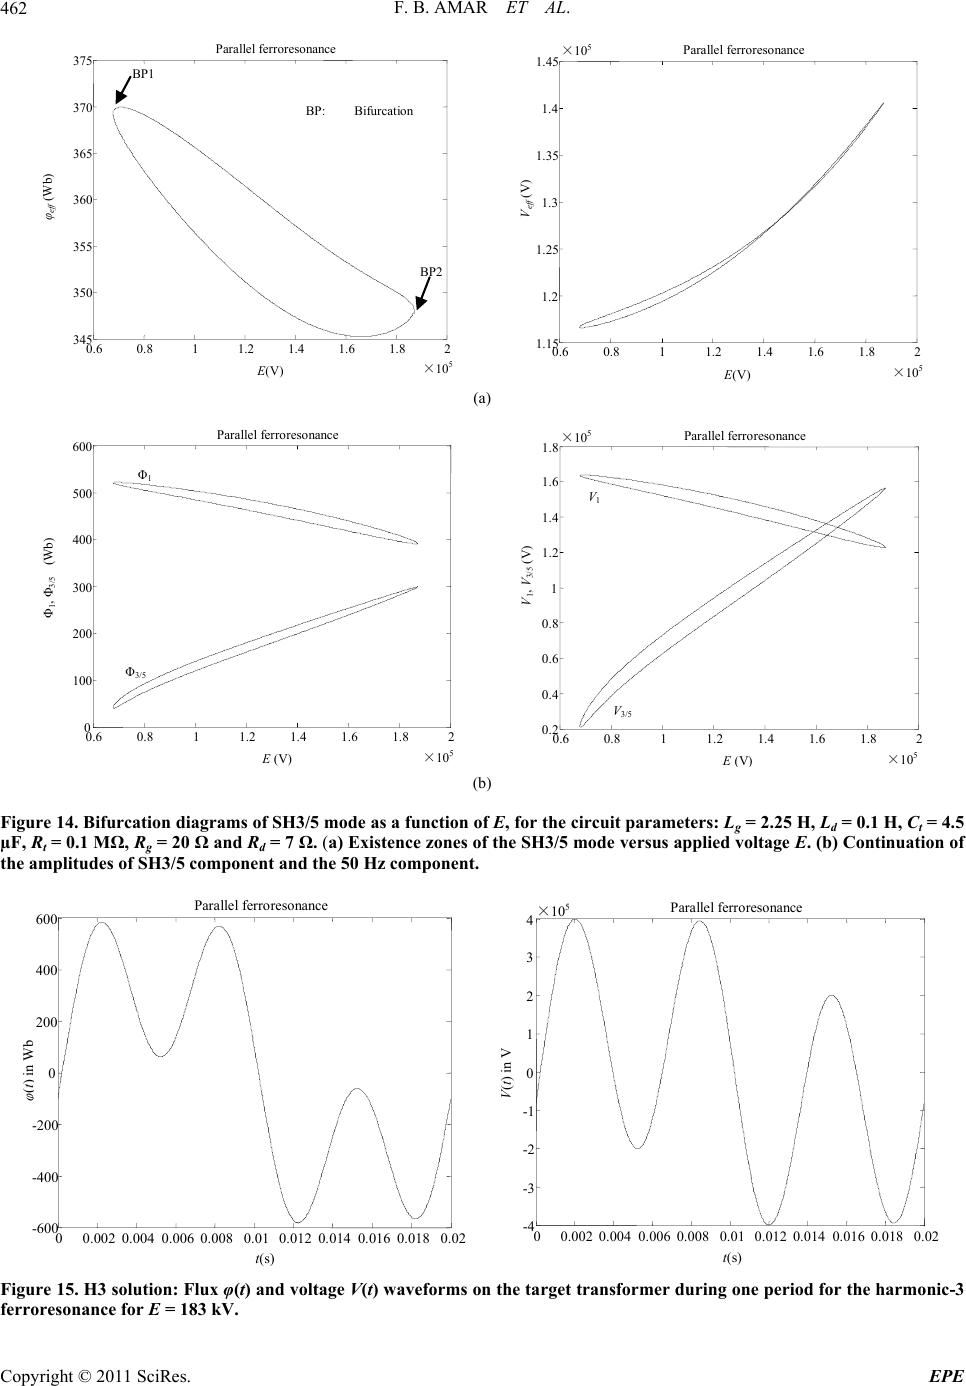 F. B. AMAR ET AL. Copyright © 2011 SciRes. EPE 462 Parallel ferroresonance 0.6 0.8 1 1.2 1.4 1.6 1.82 ×10 5 345 350 355 360 365 370 375 E (V) φ e ff (Wb) BP: Bifurcation BP1 BP2 0.6 0.811.2 1.4 1.6 1.82 ×10 5 1.15 1.2 1.25 1.3 1.35 1.4 1.45 Parallel ferroresonance ×10 5 V e ff (V) E ( V ) (a) 0.6 0.8 1 1.21.4 1.6 1.82 ×10 5 0 100 200 300 400 500 600 Parallel ferroresonance 0.6 0.8 11.2 1.4 1.6 1.82 ×10 5 0.2 0.4 Φ 1 , Φ 3/5 (Wb) E (V) Φ 3/5 Φ 1 0.6 0.8 1 1.2 1.4 1.6 1.8 Parallel ferroresonance V 1 , V 3/5 (V) V 1 ×10 5 E ( V ) V 3/5 (b) Figure 14. Bifurcation diagrams of SH3/5 mode as a function of E . (a) Existence zones of t , for the circuit parameters: Lg = 2.25 H, Ld = 0.1 H, Ct = 4.5 he SH3/5 mode versus applied voltage E. (b) Continuation of µF, Rt = 0.1 MΩ, Rg = 20 Ω and Rd = 7 Ω the amplitudes of SH3/5 component and the 50 Hz component. 0 0.002 0.0040.006 0.008 0.01 0.012 0.0140.0160.0180.02 -600 -400 -200 0 200 400 600 Parallel ferroresonance 00.0020.0040.0060.0080.01 0.012 0.014 0.0160.0180.02 -4 -3 -2 -1 0 1 2 3 4×10 5 Parallel ferroresonance t ( s ) φ ( t ) in Wb t(s) V(t) in V Figure 15. H3 solution: Flux φ(t) and voltage V(t) waveforms on the target transformer during one period for the harmonic-3 ferroresonance for E = 183 kV. 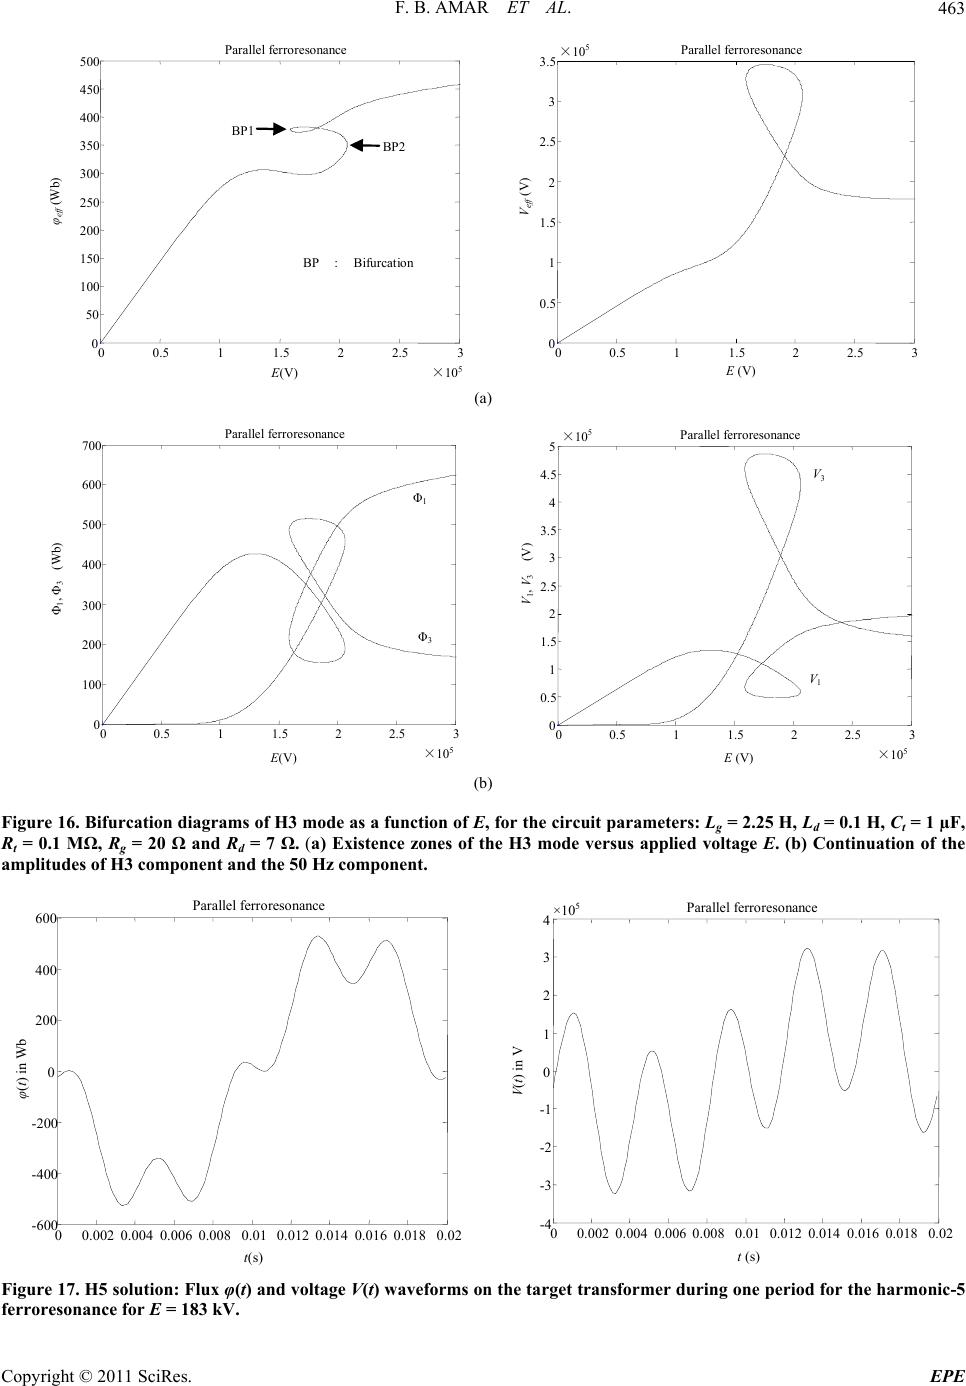 F. B. AMAR ET AL.463 Parallel ferroresonance 0 0.5 1 1.52 2.5 3 ×10 5 0 50 100 150 200 250 300 350 400 450 500 E (V) BP : Bifurcation BP2 BP1 φ e ff (Wb) 00.5 11.52 2.53 ×10 5 0 0.5 1 1.5 2 2.5 3 3.5 Parallel ferroresonance E (V) V e ff (V) (a) 0 0.5 1 1.5 2 2.53 ×10 5 0 100 200 300 400 500 600 700 Parallel ferroresonance E (V) Φ 1 , Φ 3 (Wb) Φ 3 Φ 1 00.5 11.5 2 2.5 3 ×10 5 0 0.5 1 1.5 2 2.5 3 3.5 4 4.5 5 Parallel ferroresonance E (V) V 1 , V 3 (V) V 1 V 3 ×10 5 (b) Figure 16. Bifurcation diagrams of H3 mode as a function of E, for the circuit parameters: Lg = 2.25 H, Ld = 0.1 H, Ct = 1 µF, Rt = 0.1 MΩ, Rg = 20 Ω and Rd = 7 Ω. (a) Existence zones of the H3 mode versus applied voltage E. (b) Continuation of the amplitudes of H3 component and the 50 Hz component. 0 0.002 0.0040.006 0.008 0.01 0.0120.0140.0160.0180.02 -600 -400 -200 0 200 400 600 Parallel ferroresonance φ(t) in Wb t(s) 00.002 0.004 0.006 0.008 0.01 0.012 0.0140.0160.018 0.02 -4 -3 -2 -1 0 1 2 3 4×10 5 Parallel ferroresonance t (s) V (t) in V Figure 17. H5 solution: Flux φ(t) and voltage V(t) waveforms on the target transformer during one period for the harmonic-5 ferroresonance for E = 183 kV. Copyright © 2011 SciRes. EPE  F. B. AMAR ET AL. 464 0 0.51 1.5 2 2.5 3 0 50 100 150 200 250 300 350 400 450 Parallel ferroresonance BP : Bifurcation point E (V) φ e ff (Wb) BP1 BP2 ×10 5 00.5 11.5 2 2.5 3 0 0.5 1 1.5 2 2.5 3 3.5 Parallel ferroresonance E (V) V e ff (V) ×10 5 ×10 5 (a) 0 0.5 1 1.5 2 2.5 3 0 100 200 300 400 500 600 Parallel ferroresonance E (V) Φ 1 , Φ 5 (Wb) Φ 1 Φ 5 ×10 5 00.511.5 2 2.5 3 0 0.5 1 1.5 2 2.5 3 3.5 4 4.5 Parallel ferroresonance E (V) V 1 , V 5 (V) V 5 V 1 ×10 5 ×10 5 (b) Figure 18. Bifurcation diagrams of H5 mode as a function of E, for the circuit parameters: Lg = 2.25 H, Ld = 0.1 H, Ct = 0.333 µF, Rt = 0.1 MΩ, Rg = 20 Ω and Rd = 7 Ω. (a) Existence zones of the H5 mode versus applied voltage E. (b) Continuation of the amplitudes of H5 component and the 50 Hz component. 0 0.0020.004 0.006 0.008 0.01 0.012 0.014 0.0160.0180.02 -600 -400 -200 0 200 400 600 Parallel ferroresonance t (s) φ(t) in Wb 00.0020.0040.0060.0080.01 0.0120.0140.0160.0180.0 2 -4 -3 -2 -1 0 1 2 3 4 Parallel ferroresonance t ( s ) V (t) in V ×10 5 Figure 19. H7 solution: Flux φ(t) and voltage V(t) waveforms on the target transformer uring one period for the harmonic-7 ferroresonance for E = 183 kV. Copyright © 2011 SciRes. EPE  F. B. AMAR ET AL.465 0 0.5 1 1.5 2 2.5 3 0 50 100 150 200 250 300 350 400 Parallel ferroresonance E (V) φ eff (Wb) BP:Bifurcation point BP1 BP2 ×10 5 00.5 11.5 2 2.5 3 0 2 4 6 8 10 12 14 16 18 Parallel ferroresonance V e ff (V) E (V) ×10 5 ×10 4 (a) 0 0.5 1 1.52 2.5 3 0 100 200 300 400 500 600 Parallel ferroresonance E (V) Φ1, Φ7 (Wb) Φ1 Φ7 ×10⁵ 00.5 11.5 2 2.5 3 0 0.5 1 1.5 2 2.5 Parallel ferroresonance E (V) V1, V7 (V) V7 V1 ×105 ×105 (b) Figure 20. Bifurcation diagrams of H7 mode as a function of E, for the circuit parameters: Lg = 2.25 H, Ld = 0.1 H, Ct = 0.178 µF, Rt = 0.1 MΩ, Rg = 20 Ω and Rd = 7 Ω. (a) Existence zones of the H7 mode versus applied voltage E. (b) Continuation of the amplitudes of H7 component and the 50 Hz component. 0 0.2 0.4 0.6 0.8 1 1.2 1.4 1.6 1.8 2 0 100 200 300 400 500 600 Parallel ferroresonance D B-H3 D B-H5 D B-H7 D B-fondamental E (V) φ e ff (Wb) ×10 6 00.2 0.4 0.6 0.8 1 1.2 1.4 1.6 1.8 2 0 1 2 3 4 5 6 Parallel ferroresonance D B-H3 D B-H5 D B-H5 D B-fondamental E (V) V e ff (V) ×10 5 ×10 6 Figure 21. Comparison between bifurcation diagrams of H3, 5, 7 modes and of fundamental mode for the circuit parameters: Lg = 2.25 H, Ld = 0.1 H, Ct = 1 µF, Rt = 0.1 MΩ, Rg = 20 Ω and Rd = 7 Ω. Copyright © 2011 SciRes. EPE  F. B. AMAR ET AL. Copyright © 2011 SciRes. EPE 466 The bifurcation diagrams of the harmonic modes are complex curves always starting with the null trivial solution. The existence domains of these oscillation modes and their voltage levels E increase when the row h of har- monic increases. The existence minimum voltages are much become large as the row h is large. For h > 3, they are clearly higher than the nominal voltage. The voltage domain E situated between the existence superior limit of H3 mode and the existence inferior limit of the H5 mode is probably rich of the four-harmonic component (it is the H4 mode). The source voltage applied is then determining final mode: in fact, while varying in a monotonous way the excitation voltage E, we observe in the increasing or- der the appearance of the various harmonic modes (even and odd). The maximum rms values reached by the voltage V(t) (overvoltages) are always superior to those reached by the fundamental mode. 3.2. Study of Series Ferroresonance We apply this method to computation of the periodic ferroresonant modes of the circuit of Figure 22, which describes correctly the practical problems of the series ferroresonance. Most commonly, this type of situation is achieved when a magnetic voltage transformer (the nonlinear inductance) is connected to busbar separated by the grading capacitance of an open circuit breaker (th series capacitance) [1-4]. This capacitance is the capital element revealing the ferroresonance. by ll capacitances of the circuit breaker, the transformer and the busbar section, l: linear inductance of the circuit, R1 and R2: series and parallel losses of the circuit. The magnetic characteristic is defined by: 49 e The physical parameters of this circuit are: E: amplitude of the supply voltage e(t) = E cos(100t), C: equivalent capacitance of the circuit, constituted a 33 ( )102,34.10i voltage transformer, single . It corresponds to a real -phase, of nominal primary i=f( ) e(t) C R 1 l R 2 s Figure 22. Series, single-phase, nonlinear ferroresonant cir- uit. only two solutions. Obtaining one or another depends on the in voltage 230 kV. We adopt the values R1 = 32 k; C = 400 pF; R2 = 714 M and l = 0 H, which represents a real case allowing the simultaneous study of the various possible ferroreso- nant modes (fundamental, subharmonics 3, 5, 7, 9 and 3/5 and harmonics 3, 5 and 7). 3.2.1. Search for Integer Subharmonics Modes The row h is a simple fraction of the unit. Figures 23-26 respectively give the initial solutions of the SH3, SH5, SH7 and SH9 modes, obtained for the crest value of the nominal voltage Enom = 327 kV. From these initial solutions, we vary step-by-step the ntinuation parameter Q; we obtain the correspding bifurcation diagrams: they are solution isolats compris- ing two bifurcation points as in the case of the parallel ferroresonance (Figures 27-30). Likewise the existence zones of these subharmonics modes are reduced as the parallel losses of the system become large. Indeed, the phenomenon disappears as soon as the losses become important. All this confirms the regulate action that parallel losses have on the vari- ous phenomena of the series ferroresonance; their role is much more important than the series losses. The superposition of the obtained bifurcation dia- grams and that of the fundamental mode is given by Figure 31. We find the same conclusions as that of the parallel ferroresonance. The levels of flux (t) and volt- age V(t), for the same circuit parameter decrease when e row of subharmonic increases and they areways lower than those reached by the fundamental ferroreso- We apply the method to the situation where h is not a simple unit fraction, by studying the case of the frac- tional subharmonic mode SH3/5. We obtain a subhar- monic 3 mode (Figure 32) whose harmonic 5 (83.33 Hz: which represents the frequency of the phenomenon stud- ied SH3/5) is predominating only for unrealistic values of E (Figure 33(b)). By examining the oscillation waveform of the ob- tained solution (Figure 32), for E = Enom = 327 kV, we observe that it contains three maximums over a period; that means that this solution is rich in harmonic 3 (50 Hz). The continuation of this mode as a function of E gives a bifurcation diagram (solutions isolat) comprising 4 singularities BP1, BP2, BP3 and BP4 (Figure 33(a)). We note that for certain excitation voltage values E, four olutions are possible, whereas for others, the system has itial conditions. co on th al nance mode. 3.2.2. Search for Fractional Subharmonics Modes c  F. B. AMAR ET AL. Copyright © 2011 SciRes. EPE 467 0 0.01 0.02 0.03 0.04 0.050.0 6 -4000 -3000 -2000 -1000 0 1000 2000 3000 4000 Series ferroresonance t ( s ) φ(t) in Wb 00.01 0.02 0.03 0.04 0.05 0.06 -8 -6 -4 -2 0 2 4 6 8 Series ferroresonance n V s o ce for E = 327 kV and R = 714 MΩ. V(t) i t (s) n the target transformer during one period for the subhar- ×10 5 Figure 23. SH3 solution: Flux φ(t) and voltage V(t) waveform monic-3 ferroresonan2 0 0.010.02 0.030.040.05 0.060.07 0.080.090.1 -4000 -3000 -2000 -1000 0 1000 2000 3000 4000 Series ferroresonance t (s) φ(t) in Wb 00.01 0.020.03 0.040.05 0.06 0.07 0.080.090.1 -6 -4 -2 0 2 4 6 Series ferroresonance V ×105 V(t) in t (s) Fi s o gure 24. SH5 solution: Flux φ(t) and voltage V(t) waveform monic-5 ferroresonance for E = 327 kV. n the target transformer during one period for the subhar- 0 0.02 0.040.06 0.08 0.10.120.14 -5000 -4000 -3000 -2000 -1000 0 1000 2000 3000 4000 5000 Series ferroresonance φ(t) in t (s) Wb 00.02 0.04 0.06 0.08 0.1 0.120.1 4 -5 -4 -3 -2 -1 0 1 2 3 4 5 Series ferroresonance ×10 5 V(t) in V t (s) n the target transformer during one period for the subhar-Figure 25. SH7 solution: Flux φ(t) and voltage V(t) waveform monic-7 fe s o rroresonance for E = 327 kV.  F. B. AMAR ET AL. 468 0 0.02 0.04 0.06 0.08 0.1 0.12 0.140.160.1 8 -5000 -4000 -3000 -2000 -1000 0 1000 2000 3000 4000 5000 Series ferroresonance φ(t) in Wb t (s) 00.020.040.060.080.10.12 0.14 0.160.18 -5 -4 -3 -2 -1 0 1 2 3 4 5 Series ferroresonance V (t) in V t (s) ×105 Figure 26. SH9 solution: Flux φ(t) and voltage V(t) waveforms on the target transformer during one period for the subhar- monic-9 ferroresonance for E = 327 kV. 0 1 2 3 45 6 7 89 10 1500 2000 2500 3000 3500 Series ferroresonance E (V) φ e ff (Wb) BP: Bifurcation point BP1 BP2 R 2 =32 MΩ R 2 =50 MΩ R 2 =714 MΩ ×10 5 0 12 3 45 6 7 8 910 2 2.5 3 3.5 4 4.5 5 5.5 6 6.5 7 Series ferroresonance E (V) V e ff (V) ×10 5 ×10 5 (a) 0 1 2 3 45 6 7 89 1 0 0 500 1000 1500 2000 2500 3000 3500 4000 4500 Series ferroresonance 0 1 2 3 45 6 7 8 9 1 0 E(V) 0 1 2 3 4 5 6 7 8 9 10 Series ferroresonance V 1 , V 1/3 (V) V 1/3 V 1 ×10 5 ×10 5 Φ 1/3 Φ 1 E (V) Φ 1 , Φ 1/3 (Wb) ×10 5 (b) Figure 27. Bifurcation diagrams of SH3 mode as a function oor various values of the parallel losses R2 (Ct = 400 pF, = f E, fR1 32 kΩ and l = 0 H). (a) Existence zones of the SH3 mode versus applied voltage E. (b) Continuation of the amplitudes of SH3 component and the 50 Hz component. Copyright © 2011 SciRes. EPE 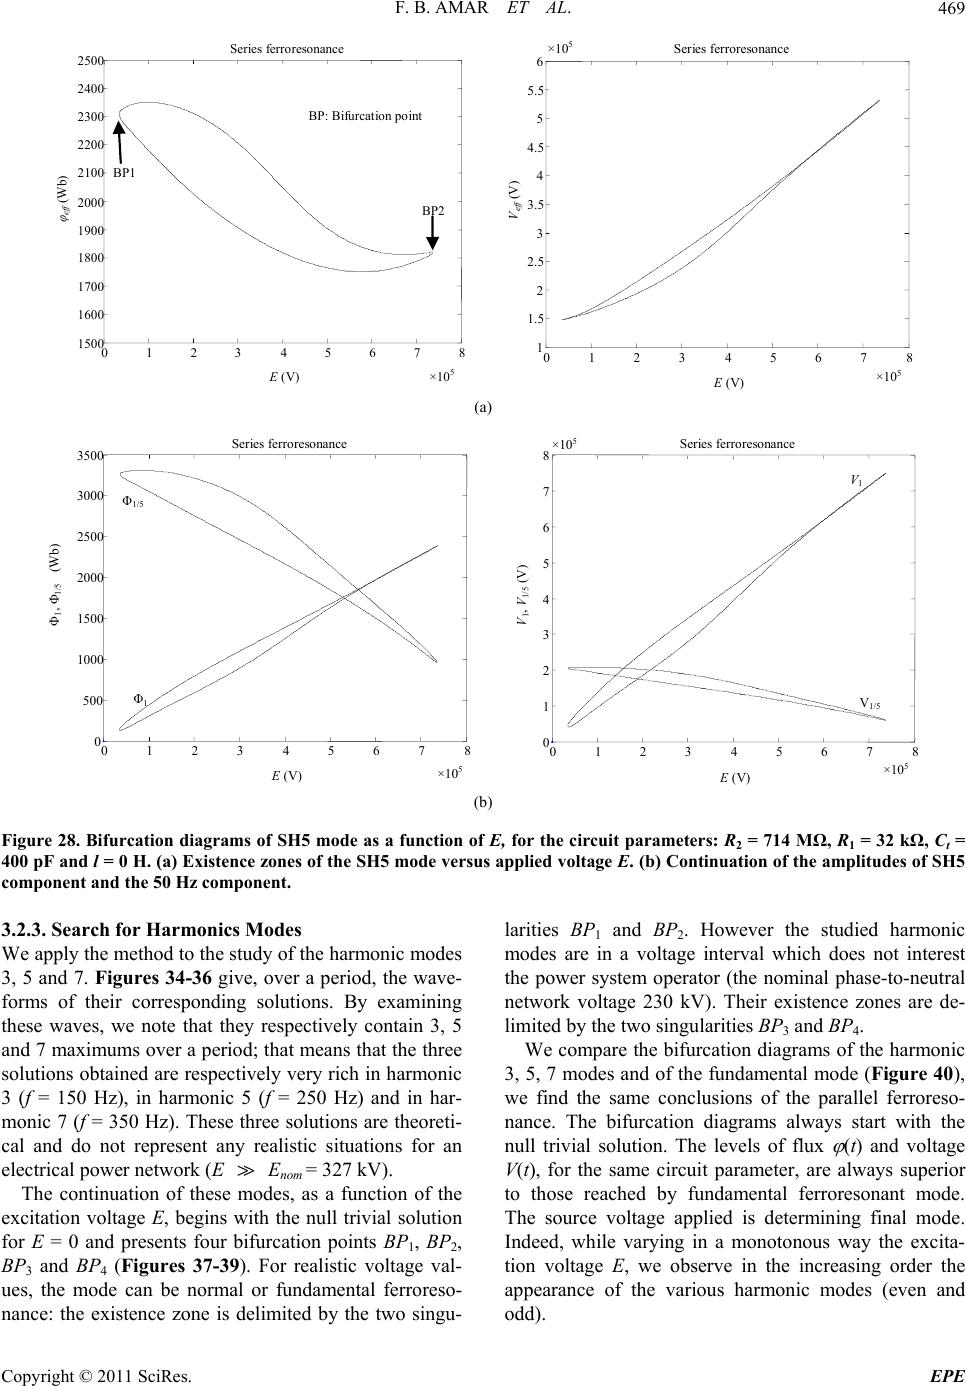 F. B. AMAR ET AL. Copyright © 2011 SciRes. EPE 469 0 1 2 3 4 5 6 7 8 1 1.5 2 2.5 3 3.5 4 4.5 5 5.5 6 Series ferroresonance E (V) V e ff (V) ×10 5 ×10 5 0 1 2 34 5 6 7 8 1500 1600 1700 1800 1900 2000 2100 2200 2300 2400 2500 Series ferroresonance E (V) φ eff (Wb) BP1 BP2 BP: Bifurcation point ×10 5 (a) 0 1 2 34 5 6 78 0 500 1000 1500 2000 2500 3000 3500 Series ferroresonance 0 1 2 34 5 6 7 8 0 1 2 3 4 5 6 7 8 Series ferroresonance E (V) Φ1, Φ1/5 (Wb) Φ1/5 Φ1 ×10⁵ 1 , V 1/5 (V) V E (V) V 1 V 1/5 ×10 5 (b) Figure 28. Bifurcation diagrams of SH5 mode as a function , for the circuit parameters: R2 = 714 MΩ, R1 = 32 kΩ, Ct = 400 pF and l = 0 H. (a) Existence zones of the SH5 mode versus applied voltage E. (b) Continuation of the amplitudes of SH5 component and the 50 Hz component. 3.2.3. Search for Harmonics Modes We apply the method to the study of the harmonic modes 3, 5 and 7. Figures 34-36 give, over a period, the wave- forms of their corresponding solutions. By examining these waves, we note that they respectively contain 3, 5 and 7 maximums over a period; that means that the three solutions obtained are respectively very rich in harmonic 3 (f = 150 Hz), in harmonic 5 (f = 250 Hz) and in har- monic 7 (f = 350 Hz). These three solutions are theoreti- cal and do not represent any realistic situations for an electrical power network (E Enom = 327 kV). The continuation of these modes, as a function of the excitation voltage E, begins with the null trivial solution for E = 0 and presents four bifurcation points BP1, BP2, d by the two singu- larities BP1 and BP2. However the studied harmonic modes are in a voltage interval which does not interest the power system operator (the nominal phase-to-neutral network voltage 230 kV). Their existence zones are de- limited by the two singularities BP3 and BP4. We compare the bifurcation diagrams of the harmonic 3, 5, 7 modes and of the fundamental mode (Figure 40), we find the same conclusions of the parallel ferroreso- nance. The bifurcation diagrams always start with the null trivial solution. The levels of flux (t) and voltage V(t), for the same circuit parameter, are always superior those reached by fundamental ferroresonant mode. e source voltage applied is determining final mode. Indeed, while varying in a monotonous way the excita- odd). ×10 5 of E to Th BP3 and BP4 (Figures 37-39). For realistic voltage val- ues, the mode can be normal or fundamental ferroreso- nance: the existence zone is delimite tion voltage E, we observe in the increasing order the appearance of the various harmonic modes (even and  F. B. AMAR ET AL. 470 In all the treated examples, the ferroresonance phenom- ena appear only in the lightly loaded electrical networks.. In addition, it is necessary that these circuits are under the good initial conditions so that these phenomena are generated. 4. Conclusions Ferrorresonance is a very complex nonlinear phenome- non which affects power transmission system and distri- bution system. It is a particular case of bifurcation of nonlinear dynamic system. We are thus interested in the initialization question of the continuations of several modes types. We have presented in this study an analytical method for research from the periodic ferroresonant solutions. This approach enables us to systematically calculate the periodic modes intervening in the single-phase ferrore- sonance. The association of this method with a continua- tion technique enables to obtain the limits of the exis- tence domains of the dangerous and undesirable modes as a function of source voltage E. We have presented, on real and theoretical configurations, parallel and series, the wealth of the informations brought by this analytical approach. Indeed, several results of continuation con- cerning the fundamental mode, harmonics 1, 3, 5 and 7 modes and subharmonics 3, 5, 7, 9 and 3/5 modes are presented. It comes from this study the following overall conclusions: The risks of ferroresonant phenomena in the electrical power networks have an important appearance prob- ability. 0 1 2 34 5 6 7 8 2100 2200 2300 2400 2500 2600 2700 2800 2900 Series ferroresonance φ e ff (Wb) E (V) BP1 BP2 BP: Bifurcation point ×10 5 0 1 2 34 5 6 7 8 1 1.5 2 2.5 3 3.5 4 4.5 5 5.5 Series ferroresonance V e ff (V) E (V)×10 5 ×10 5 (a) 0 1 2 34 5 6 78 0 500 1000 1500 2000 2500 3000 3500 4000 4500 Series ferroresonance Φ 1 , Φ 1/7 (Wb) E (V) ×10 5 Φ 1/7 Φ 1 0123 4 5 6 7 8 0 1 2 3 4 5 6 7 Series ferroresonance 8 V 1 V 1/7 (V) , E (V) V 1/7 ×10 5 for the circuit parameters: R2 = 714 MΩ, R1 = 32 kΩ, Ct = 4 plied voltage E. (b) Continuation of the amplitudes of SH7 ×10 5 V 1 (b) E, s ap Figure 29. Bifurcation diagrams of SH7 mode as a function of nF and l = 0 H. (a) Existence zones of the SH7 mode versu component and the 50 Hz component. Copyright © 2011 SciRes. EPE 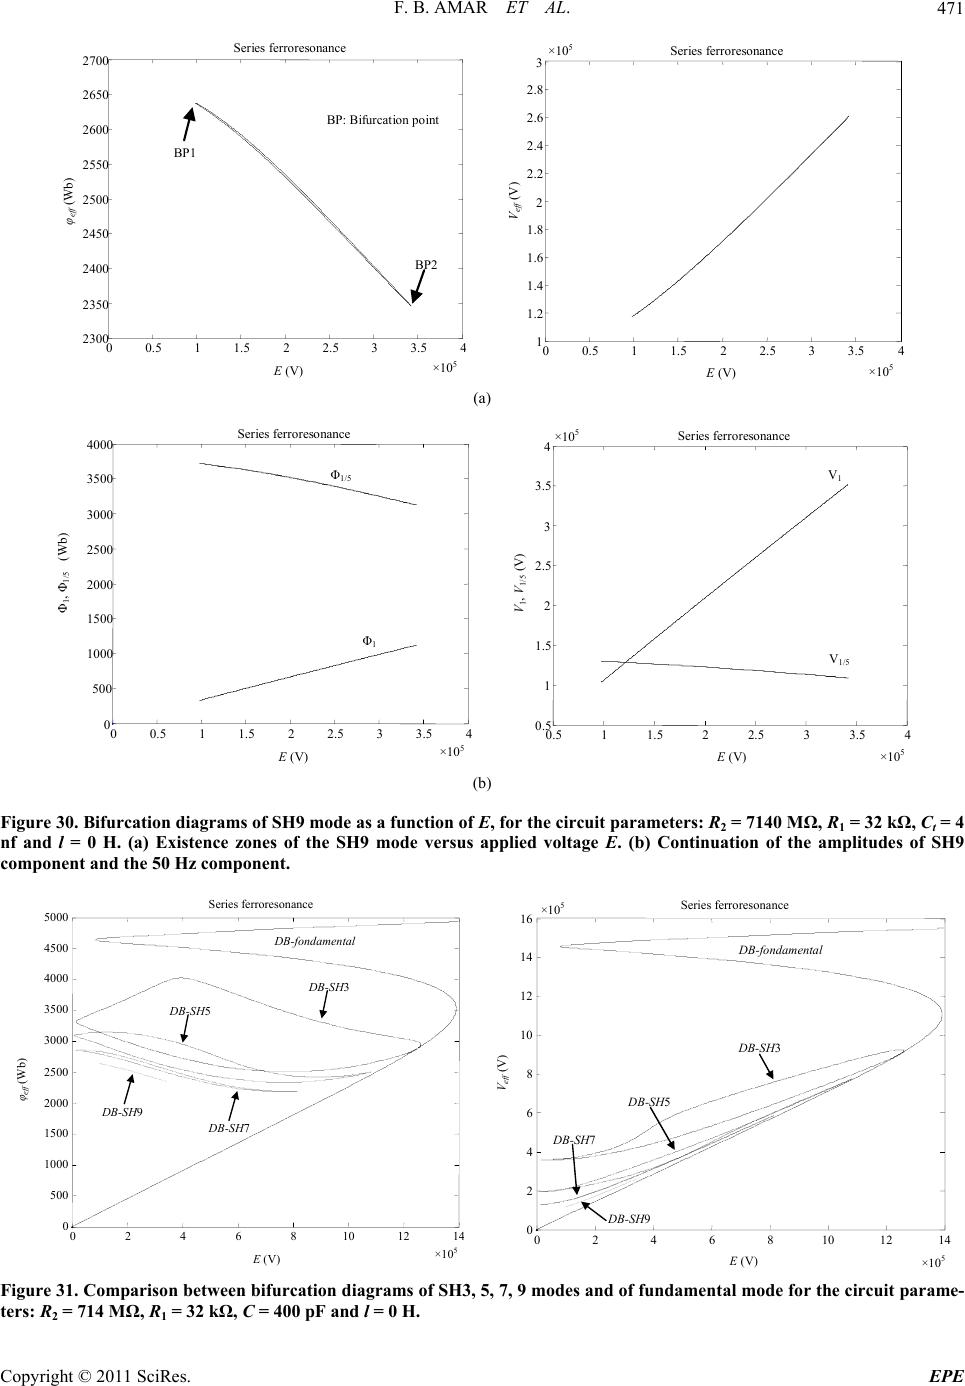 F. B. AMAR ET AL.471 0 0.5 1 1.5 2 2.53 3.5 4 2300 2350 2400 2450 2500 2550 2600 2650 2700 Series ferroresonance BP: Bifurcation point BP1 φ eff (Wb) BP2 E (V) ×10 5 00.5 11.5 22.5 3 3.5 4 1 1.2 1.4 1.6 1.8 2 2.2 2.4 2.6 2.8 3 Series ferroresonance V e ff (V) ×10 5 E (V) ×10 5 ) (a 0 0.5 1 1.52 2.5 33.5 4 0 500 1000 1500 2000 2500 3000 3500 4000 Series ferroresonance E (V) Φ 1 , Φ 1/5 (Wb) Φ 1/5 Φ 1 ×10 5 0.5 11.5 22.5 3 3.5 4 0.5 1 1.5 2 2.5 3 3.5 4Series ferroresonance E (V) V 1 , V 1/5 (V) V 1 V 1/5 ×10 5 ×10 5 (b) Figure 30. Bifurcation diagrams of SH9 mode as a function or the circuit parameters: R2 = 7140 MΩ, R1 = 32 kΩ, Ct = 4 nf and l = 0 H. (a) Existence zones of the SH9 mode versus d voltage E. (b) Continuation of the amplitudes of SH9 component and the 50 Hz component. f E, applie fo 0 24 68 10 121 4 0 500 1000 1500 2000 2500 3000 3500 4000 4500 5000 Series ferroresonance φe ff (Wb) E (V) D B-fondamental D B-SH3 D B-SH5 D B-SH7 D B-SH9 ×105 02468 10 12 14 0 2 4 6 8 10 12 14 16 Series ferroresonance V e ff (V) E ( V ) D B- f ondamenta l D B-SH3 D B-SH5 D B-SH7 D B-SH9 ×10 5 ×10 5 Figure 31. Comparison between bifurcation diagrams of SH3, 5, 7, 9 modes and of fundamental mode for the circuit parame- ters: R2 = 714 MΩ, R1 = 32 kΩ, C = 400 pF and l = 0 H. Copyright © 2011 SciRes. EPE  F. B. AMAR ET AL. 472 0 0.01 0.02 0.030.04 0.050.06 -6000 -4000 -2000 0 2000 4000 6000 Series ferroresonance φ (t) in Wb t (s) 00.01 0.020.03 0.04 0.050.0 6 -2 -1.5 -1 -0.5 0 0.5 1 1.5 2 Series ferroresonance V (t) in V t (s) ×10 6 Figure 32. SH3/5 solution: Flux φ(t) and voltage V(t) waveforms on the target transformer during one period for the frac- tional subharmonic-3/5 ferroresonance for E = 327 kV. 0 0.2 0.4 0.60.81 1.2 1.41.6 1.8 2 2950 3000 3050 3100 3150 3200 3250 Series ferroresonance BP: Bifurcation point BP1 BP2 BP3 BP4 φ eff (Wb) E (V) ×10 5 00.20.40.60.81 1.21.4 1.61.82 1 1.05 1.1 1.15 1.2 1.25 1.3 1.35 Series ferroresonance V e ff (V) E (V) ×10 6 ×10 6 (a) 0 0.20.4 0.60.81 1.21.4 1.61.82 0 500 1000 1500 2000 2500 3000 3500 4000 4500 5000 Series ferroresonance E (V) Φ 1 , Φ 3/5 (Wb) Φ 3/5 Φ 1 ×10 6 00.2 0.40.6 0.8 1 1.21.4 1.61.8 2 0 2 4 6 8 10 12 14 16 18 Series ferroresonance V 1 , V 3/5 (V) E (V) V 1 V 3/5 ×10 5 ×10 6 (b) Figure 33. Bifurcation diagrams of SH3/5 mode as a function of E, for the circuit parameters: R2 = 714 MΩ, R1 = 32 kΩ, Ct = 400 pF and l = 0 H. (a) Existence zones of the SH3/5 mode versus applied voltage E. (b) Continuation of the amplitudes of SH3/5 component and the 50 Hz component. Copyright © 2011 SciRes. EPE  F. B. AMAR ET AL.473 Series ferroresonance Series ferroresonance 0 0.002 0.004 0.0060.0080.010.0120.0140.0160.0180.02 -8000 -6000 -4000 -2000 0 2000 4000 6000 8000 5 00.002 0.0040.0060.0080.01 0.012 0.0140.016 0.018 0 φ ( t ) in Wb t (s) .02 -5 -4 -3 -2 -1 0 1 2 3 4 (t) in V V t ( s ) Figure 34. H3 solution: Flux φ(t) and voltage V(t) wavefo ×10 6 rms on the target transformer during one period for the harmonic-3 rroresonance for E = 10 MV. fe Series ferroresonance 0 0.002 0.004 0.006 0.008 0.01 0.012 0.014 0.016 0.018 0.0 2 -8000 -6000 -4000 -2000 0 2000 4000 6000 8000 6 00.0020.0040.0060.0080.01 0.012 0.014 0.016 0.0180.0 φ ( t ) in Wb t ( s ) 2 -6 -4 -2 0 2 4 Series ferroresonance V(t) in V t ( s ) ×10 6 Figure 35. H5 solution: Flux φ(t) and voltage V(t) waveforms on the target transformer during one period for the harmonic-5 ferroresonance for E = 20 MV. Series ferroresonance 00.0020.0040.0060.0080.010.0120.0140.016 0.0180.0 2 -6 -4 -2 0 2 4 6 Series ferroresonance V(t) in V ×10 6 0 0.002 0.004 0.006 0.008 0.01 0.012 0.014 0.0160.018 0.0 8000 6000 4000 2000 2 -8000 -6000 -4000 -2000 0 ) in Wb t ( φ t ( s ) t ( s ) Figure 36. H7 solution: Flux φ(t) and voltage V(t) waveforms on the target transformer during one period for the harmonic-7 ferroresonance for E = 30 MV. Copyright © 2011 SciRes. EPE  F. B. AMAR ET AL. 474 0 0.5 1 1.5 22. 5 0 1000 2000 3000 4000 5000 6000 Series ferroresonance φ e ff (Wb) E (V) BP: Bifurcation point BP1 BP2 BP3 BP4 ×10 7 00.5 11.52 2.5 0 0.5 1 1.5 2 2.5 3 3.5 4 4.5 Series ferroresonance E (V) Ve ff (V) ×107 ×106 (a) 0 0.5 11.522.5 0 1000 2000 3000 4000 5000 6000 7000 8000 Series ferroresonance Φ 1 , Φ 3 (Wb) E (V) Φ 3 Φ 1 ×10 7 00.5 11.5 2 2. 5 0 1 2 3 4 5 6Series ferroresonance V 1 , V 3 (V) E (V) V 3 V 1 ×10 7 ×10 6 (b) Figure 37. Bifurcation diagrams of H3 mode as a function of E, for the circuit parameters: R2 = 714 MΩ, R1 = 32 kΩ, Ct = 400 pF and l = 0 H. (a) Existence zones of the H3 mode versus applied voltage E. (b) Continuation of the amplitudes of H3 com- ponent and the 50 Hz component. 0 0.5 1 1.5 22.5 3 3.5 44.5 5 0 1000 2000 3000 4000 5000 6000 Series ferroresonance φ eff (Wb) 00.5 11.5 22.5 3 3.54 4.55 0 1 2 3 4 5 6Series ferroresonance V e ff (V) E (V) BP: Bifurcation point BP1 BP2 BP3 BP4 ×10 7 ×10 6 ×10 6 (a) E (V) ×10 7 Copyright © 2011 SciRes. EPE 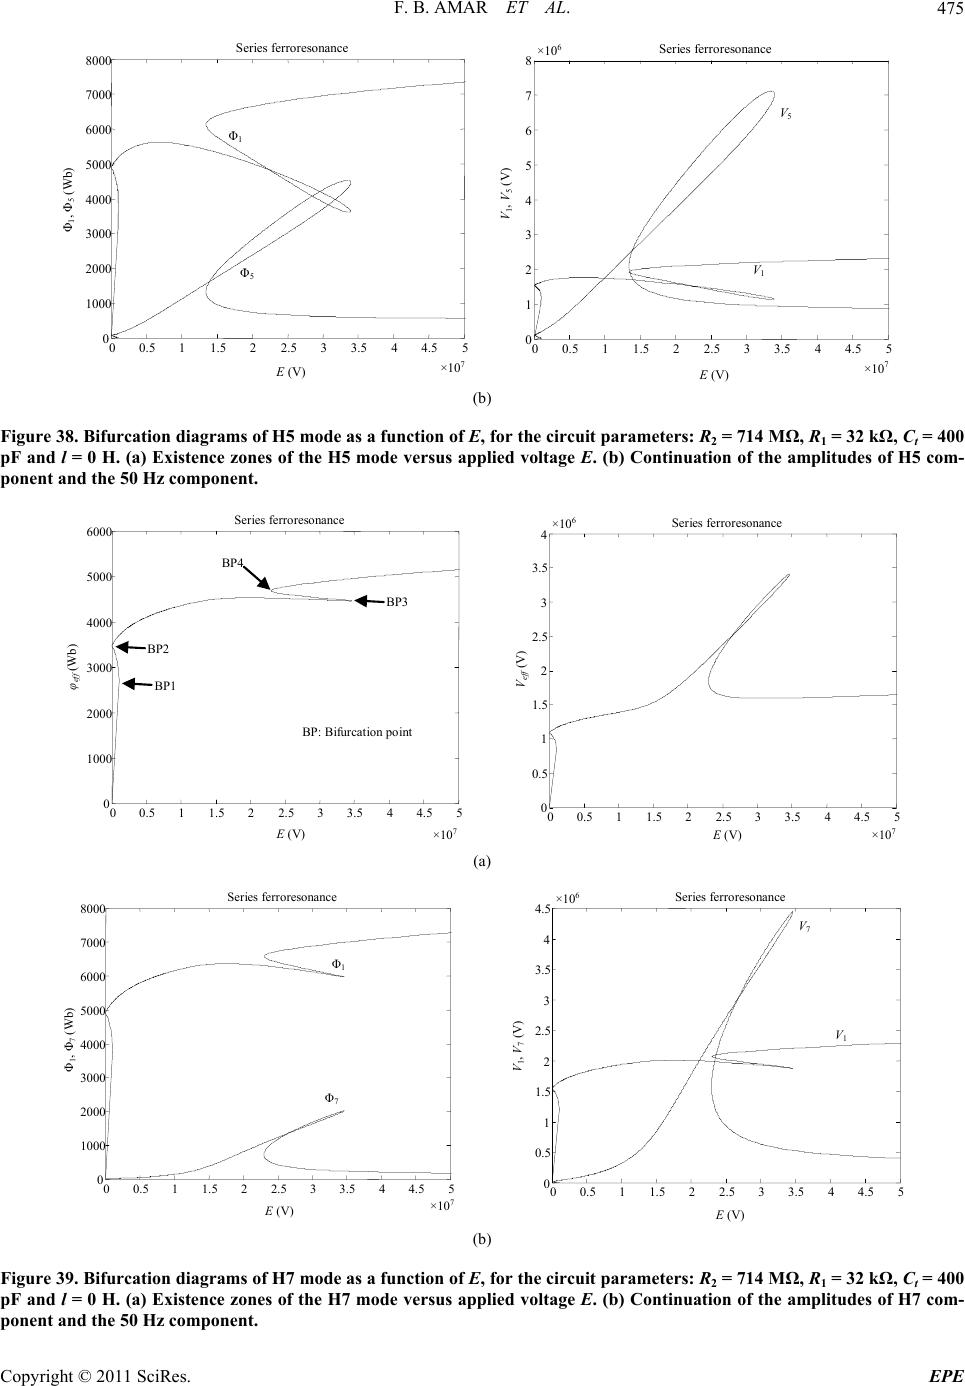 F. B. AMAR ET AL.475 0 0.5 1 1.5 2 2.5 3 3.5 44.5 5 ×10 7 0 1000 2000 3000 4000 5000 6000 7000 8000 Series ferroresonance Φ 1 , Φ 5 (Wb) E (V) Φ 1 Φ 5 00.5 11.522.53 3.5 4 4.55 ×10 7 0 1 2 3 4 5 6 7 8 Series ferroresonance V 1 , V 5 (V) E ( V ) V 5 V 1 ×10 6 (b) Figure 38. Bifurcation diagrams of H5 mode as a function of E, for the circuit parameters: R2 = 714 MΩ, R1 = 32 kΩ, Ct = 400 pF and l = 0 H. (a) Existence zones of the H5 mode versus applied voltage E. (b) Continuation of the amplitudes of H5 com- ponent and the 50 Hz component. 0 0.5 1 1.5 22.5 3 3.5 44.5 5 0 1000 2000 3000 4000 5000 6000 Series ferroresonance BP: Bifurcation point E (V) φ eff (Wb) BP1 BP2 BP3 BP4 ×10 7 00.5 11.5 22.5 3 3.5 4 4.55 0 0.5 1 1.5 2 2.5 3 3.5 4 Series ferroresonance V e ff (V) E (V) ×10 6 ×10 7 (a) 00.511.5 22.5 3 3.5 4 4.5 5 0 0.5 1 1.5 2 2.5 3 3.5 4 4.5 Series ferroresonance E (V) V 1 , V 7 (V) V 7 V 1 ×10 0 0.5 1 1.5 22.5 3 3.5 44.5 5 0 1000 2000 3000 4000 5000 6000 7000 8000 Series ferroresonance 6 (V) Φ 1 Φ 1 , Φ 7 (Wb) Φ ×10 7 7 E (b) Figure 39. Bifurcation diagrams of H7 mode as a function of E the circuit parameters: R2 = 714 MΩ, R1 = 32 kΩ, Ct = 400 pF and l = 0 H. (a) Existence zones of the H7 mode versus applied voltage E. (b) Continuation of the amplitudes of H7 m- ponent and the 50 Hz component. , for co Copyright © 2011 SciRes. EPE  F. B. AMAR ET AL. Copyright © 2011 SciRes. EPE 476 0 0.5 11.5 22.53 3.544.5 5 0 1000 2000 3000 4000 5000 6000 Series ferroresonance D B-fondamental D B-H7 D B-H5 D B-H3 φ e ff (Wb) E (V) ×10 7 00.5 11.522.5 3 3.5 44.55 0 1 2 3 4 5 6Series ferroresonance D B-fondamental D B-H3 D B-H5 D B-H7 E (V) V e ff (V) ×10 7 ×10 6 Figure 40. Comparison between bifurcation diagrams of H3, 5, 7 modes and of fundamental mode for the circuit parameters: R2 = 714 MΩ, R1 = 32 kΩ, Ct = 400 pF and l = 0 H. For all the series ferroresonances, the phenomenon can give rise to ferroresonance modes generally peri- odic of fundamental or subharmonic type. On the contrary, for all the parallel ferroresonances, the modes are harmonic type, i.e. fundamental with strong harmonic amplitudes in the spectrum, but also pseudoperiodics. On the practical plane, the approach proposed is a tool enabling to determine if, in existing and future installa- tion, there is danger of ferroresonance. It enables to pre- dict and appraise the ferroresonance possibilities in an electrical network for the set of the source voltage values E in normal and downgraded conditions. The analytical approach developed with two compo- nents of flux gives us a first estimate of the solution and constitutes, in general, an excellent starting point for the iterations of the Galerkin method: a method which offers solutions closer to reality, owing to the fact that it does not impose any restriction on the component count of flux. A study in this direction is presently being pursued. 5. References [1] K. Pattanapakdee and C. Banmongkol, “Failure of Riser Pole Arrester Due to Station Service Transformer,” In- ternational Conference on Power Systems Transients, Lyon, 4-7 June 2007. [2] S. Santoso, R. C. Dugan and H. Peter, “Modeling Fer- roresonance Phenomena in an Underground Distribution System,” International Conference on Power Systems Transients (IPST’07) Lyon, 4-7 June 2007. [3] R. C. Dugan, “Examples of Ferroresonance in Distribu- tion Systems,” IEEE Power Engineering Society General [5] C. Kieny, “Application of the Bifurcation Theory in Studying and Understanding the Global Behaviour of a Ferroresonant Electric Power Circuit,” IEEE Transac- tions on Power Delivery, Vol. 6, No. 2, 1991, pp. 866- 872. doi:10.1109/61.131146 [6] F. B. Amar and R. Dhifaoui, “Bifurcation Diagrams and Lines of Period-1 Ferroresonance,” WSEAS Transactions on Power Systems, Vol. 1, No. 7, 2006, pp. 1154-1162. [7] F. B. Amar and R. Dhifaoui, “Study of the Periodic Fer- roresonance in the Electrical Power Networks by Bifur- cation Diagrams,” International Journal of Electrical Power and Energy Systems, Vol. 33, No. 1, 2011, pp. 61-85. doi:10.1016/j.ijepes.2010.08.003 [8] B. S. A. Kumar and S. Ertem, “Capacitor Voltage Trans- former Induced Ferroresonance: Causes, Effects and De- sign Considerations,” Electric Power Systems Research, Vol. 21, 1991, pp. 23-31. [9] S. K. Chakravarthy and C. V. Nayar, “Series Ferroreso- nance in Power Systems,” International Journal of Elec- trical Power & Energy Systems, Vol. 17, No. 4, 1995, pp. 267-274. doi:10.1016/0142-0615(95)00045-R [10] M. Rioual and C. Sicre, “Energization of a No-Load Transformer for Power Restoration Purposes: Impact of the Sensitivity to Parameters,” International Conference on Power Systems Transients (IPST’01), Seattle, Vol. 2, 16 July 2001, pp. 892-895. [11] N. Janssens, V. Vanderstockt, H. Denoel and P. A. Mon- fils, “Elimination of Temporary Overvoltages Due to Ferroresonance of Voltage Transformers: Design and Testing of Damping System,” International Council on Large Electric Systems, Paris, 1990, pp. 33-204. [12] R. G. Kavasseri, “Analysis of Subharmonic Oscillations in a Ferroresonant Circuit,” International Jonal of Electrical Power and Energy Systems, Vol. 28No. 3, 2005, pp. 207-214. doi:10.1016/j.ijepes.2005.11.010 ur , Meeting, Knoxville, 13-17 July 2003. [4] Ph. Ferracci, “Ferroresonance,” Cahier Technique, Group Schneider, 1998. [13] K. S. Preetham, R. Saravanaselvan and R. Ramanujam, “Investigation of Subharmonic Ferroresonant Oscillations in Power Systems,” Electric Power Systems Research,  F. B. AMAR ET AL.477 Vol. 76, No. 9-10, 2006, pp. 873-879. doi:10.1016/j.epsr.2005.11.005 [14] R. G. Kavasseri, “Analysis of Subharmonic Oscillations in a Ferroresonant Circuit,” International Journal of Electrical Power and Energy Systems, Vol. 28, No. 3, 2005, pp. 207-214. doi:10.1016/j.ijepes.2005.11.010 [15] M. V. Escudero, I. Dudurych and M. A. Redfern, “Char- acterization of Ferroresonant Modes in HV Substation with CB Grading Capacitors,” Electric Power Systems Research, Vol. 77, No. 11, 2007, pp. 1506-1513. doi:10.1016/j.epsr.2006.08.033 [16] S. Mitrea and A. Adascalitei, “On the Prediction of Fer- roresonance in Distribution Networks,” Electric Power Systems Research, Vol. 23, No. 2, 1992, pp. 155-160. doi:10.1016/0378-7796(92)90063-7 [17] M. M. Saied, H. M. Abdallah and A. S. Abdallah, “Damping Effect of Load on the Ferroresonance Phe- nomenon in Power Networks,” Electric Power Systems Research, Vol. 7, 1984, pp. 271-277. doi:10.1016/0378-7796(84)90011-7 Copyright © 2011 SciRes. EPE |

