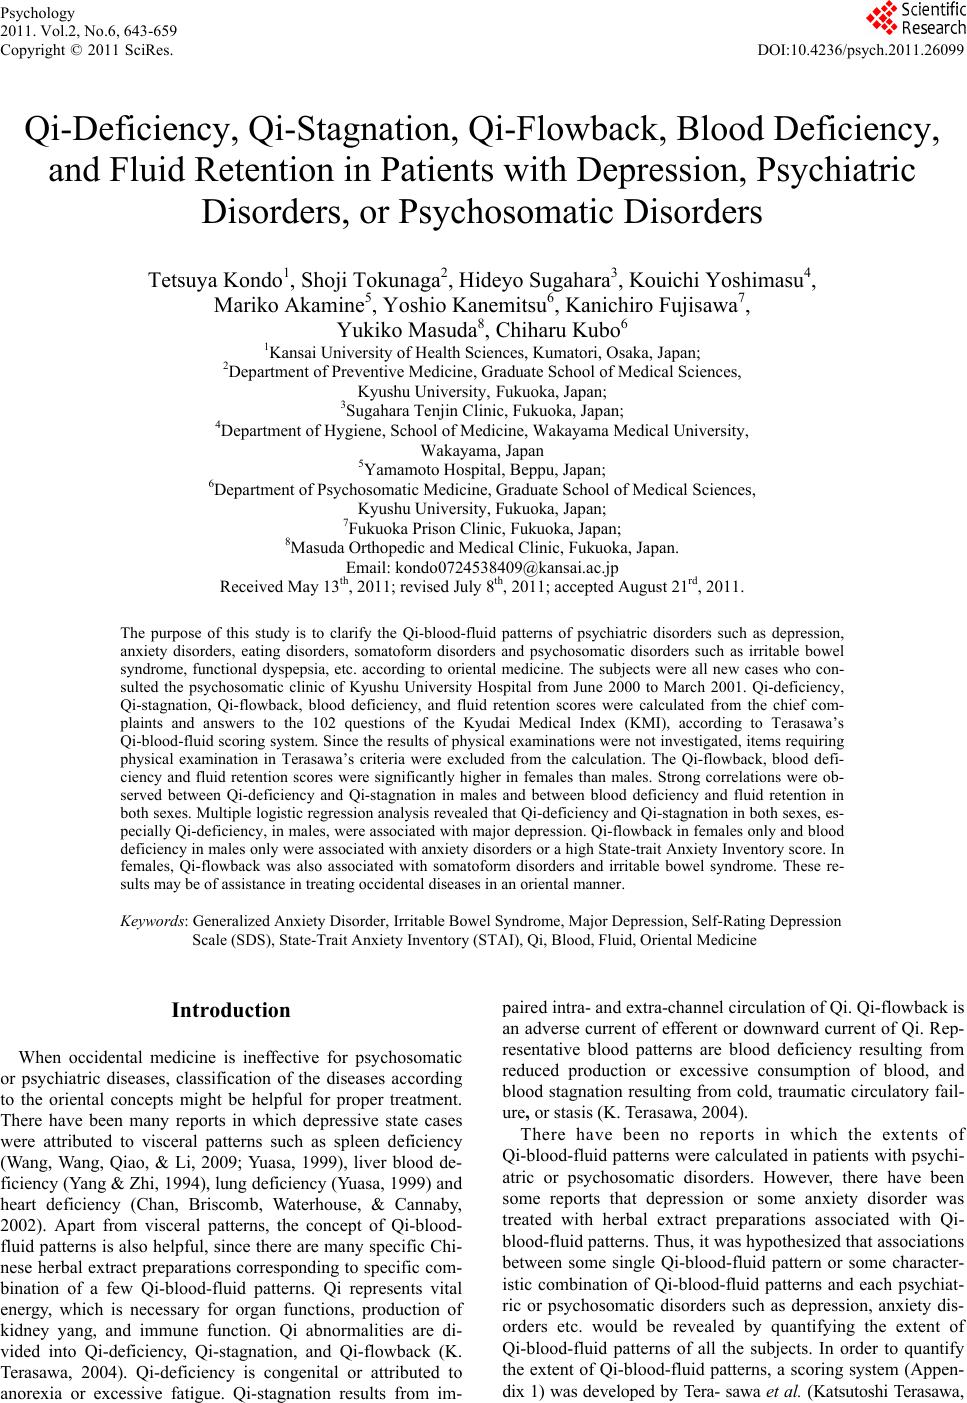
 Psychology 2011. Vol.2, No.6, 643-659 Copyright © 2011 SciRes. DOI:10.4236/psych.2011.26099 Qi-Deficiency, Qi-Stagnation, Qi-Flowback, Blood Deficiency, and Fluid Retention in Patients with Depression, Psychiatric Disorders, or Psychosomatic Disorders Tetsuya Kondo1, Shoji Tokunaga2, Hideyo Sugahara3, Kouichi Yoshimasu4, Mariko Akamine5, Yoshio Kanemitsu6, Kanichiro Fujisawa7, Yukiko Masuda8, Chiharu Kubo6 1Kansai University of Health Sciences, Kumatori, Osaka, Japan; 2Department of Preventive Medicine, Graduate School of Medical Sciences, Kyushu University, Fukuoka, Japan; 3Sugahara Tenjin Clinic, Fukuoka, Japan; 4Department of Hygiene, School of Medicine, Wakayama Medical University, Wakayama, Japan 5Yamamoto Hospital, Beppu, Japan; 6Department of Psychosomatic Medicine, Graduate School of Medical Sciences, Kyushu University, Fukuoka, Japan; 7Fukuoka Prison Clinic, Fukuoka, Japan; 8Masuda Orthopedic and Medical Clinic, Fukuoka, Japan. Email: kondo0724538409@kansai.ac.jp Received May 13th, 2011; revised July 8th, 2011; accepted August 21rd, 2011. The purpose of this study is to clarify the Qi-blood-fluid patterns of psychiatric disorders such as depression, anxiety disorders, eating disorders, somatoform disorders and psychosomatic disorders such as irritable bowel syndrome, functional dyspepsia, etc. according to oriental medicine. The subjects were all new cases who con- sulted the psychosomatic clinic of Kyushu University Hospital from June 2000 to March 2001. Qi-deficiency, Qi-stagnation, Qi-flowback, blood deficiency, and fluid retention scores were calculated from the chief com- plaints and answers to the 102 questions of the Kyudai Medical Index (KMI), according to Terasawa’s Qi-blood-fluid scoring system. Since the results of physical examinations were not investigated, items requiring physical examination in Terasawa’s criteria were excluded from the calculation. The Qi-flowback, blood defi- ciency and fluid retention scores were significantly higher in females than males. Strong correlations were ob- served between Qi-deficiency and Qi-stagnation in males and between blood deficiency and fluid retention in both sexes. Multiple logistic regression analysis revealed that Qi-deficiency and Qi-stagnation in both sexes, es- pecially Qi-deficiency, in males, were associated with major depression. Qi-flowback in females only and blood deficiency in males only were associated with anxiety disorders or a high State-trait Anxiety Inventory score. In females, Qi-flowback was also associated with somatoform disorders and irritable bowel syndrome. These re- sults may be of assistance in treating occidental diseases in an oriental manner. Keywords: Generalized Anxiety Disorder, Irritable Bowel Syndrome, Major Depression, Self-Rating Depression Scale (SDS), State-Trait Anxiety Inventory (STAI), Qi, Blood, Fluid, Oriental Medicine Introduction When occidental medicine is ineffective for psychosomatic or psychiatric diseases, classification of the diseases according to the oriental concepts might be helpful for proper treatment. There have been many reports in which depressive state cases were attributed to visceral patterns such as spleen deficiency (Wang, Wang, Qiao, & Li, 2009; Yuasa, 1999), liver blood de- ficiency (Yang & Zhi, 1994), lung deficiency (Yuasa, 1999) and heart deficiency (Chan, Briscomb, Waterhouse, & Cannaby, 2002). Apart from visceral patterns, the concept of Qi-blood- fluid patterns is also helpful, since there are many specific Chi- nese herbal extract preparations corresponding to specific com- bination of a few Qi-blood-fluid patterns. Qi represents vital energy, which is necessary for organ functions, production of kidney yang, and immune function. Qi abnormalities are di- vided into Qi-deficiency, Qi-stagnation, and Qi-flowback (K. Terasawa, 2004). Qi-deficiency is congenital or attributed to anorexia or excessive fatigue. Qi-stagnation results from im- paired intra- and extra-channel circulation of Qi. Qi-flowback is an adverse current of efferent or downward current of Qi. Rep- resentative blood patterns are blood deficiency resulting from reduced production or excessive consumption of blood, and blood stagnation resulting from cold, traumatic circulatory fail- ure, or stasis (K. Terasawa, 2004). There have been no reports in which the extents of Qi-blood-fluid patterns were calculated in patients with psychi- atric or psychosomatic disorders. However, there have been some reports that depression or some anxiety disorder was treated with herbal extract preparations associated with Qi- blood-fluid patterns. Thus, it was hypothesized that associations between some single Qi-blood-fluid pattern or some character- istic combination of Qi-blood-fluid patterns and each psychiat- ric or psychosomatic disorders such as depression, anxiety dis- orders etc. would be revealed by quantifying the extent of Qi-blood-fluid patterns of all the subjects. In order to quantify the extent of Qi-blood-fluid patterns, a scoring system (Appen- dix 1) was developed by Tera- sawa et al. (Katsutoshi Terasawa, 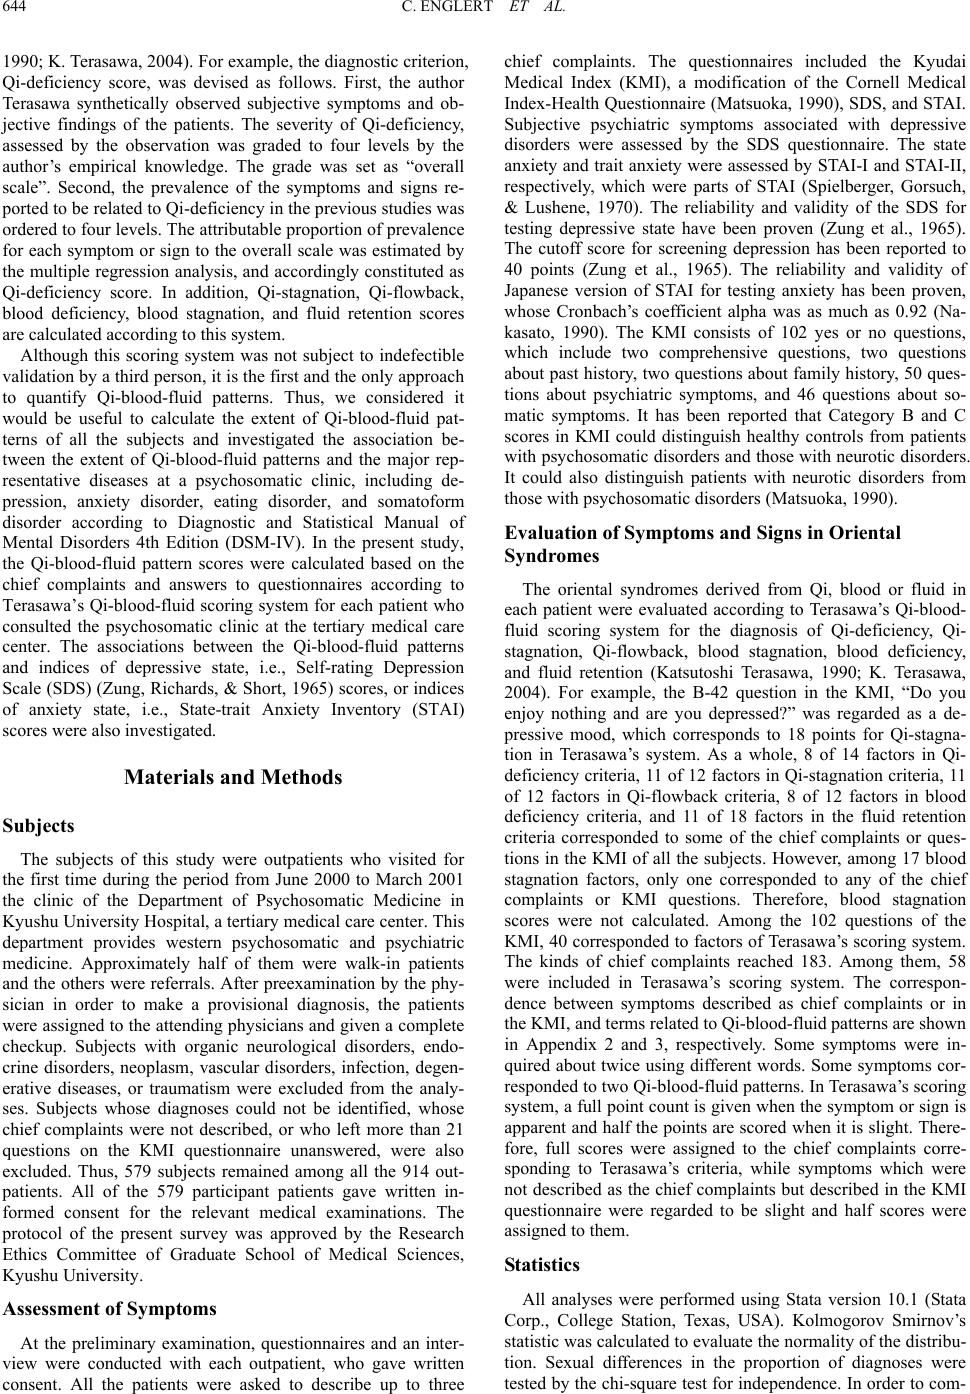 C. ENGLERT ET AL. 644 1990; K. Terasawa, 2004). For example, the diagnostic criterion, Qi-deficiency score, was devised as follows. First, the author Terasawa synthetically observed subjective symptoms and ob- jective findings of the patients. The severity of Qi-deficiency, assessed by the observation was graded to four levels by the author’s empirical knowledge. The grade was set as “overall scale”. Second, the prevalence of the symptoms and signs re- ported to be related to Qi-deficiency in the previous studies was ordered to four levels. The attributable proportion of prevalence for each symptom or sign to the overall scale was estimated by the multiple regression analysis, and accordingly constituted as Qi-deficiency score. In addition, Qi-stagnation, Qi-flowback, blood deficiency, blood stagnation, and fluid retention scores are calculated according to this system. Although this scoring system was not subject to indefectible validation by a third person, it is the first and the only approach to quantify Qi-blood-fluid patterns. Thus, we considered it would be useful to calculate the extent of Qi-blood-fluid pat- terns of all the subjects and investigated the association be- tween the extent of Qi-blood-fluid patterns and the major rep- resentative diseases at a psychosomatic clinic, including de- pression, anxiety disorder, eating disorder, and somatoform disorder according to Diagnostic and Statistical Manual of Mental Disorders 4th Edition (DSM-IV). In the present study, the Qi-blood-fluid pattern scores were calculated based on the chief complaints and answers to questionnaires according to Terasawa’s Qi-blood-fluid scoring system for each patient who consulted the psychosomatic clinic at the tertiary medical care center. The associations between the Qi-blood-fluid patterns and indices of depressive state, i.e., Self-rating Depression Scale (SDS) (Zung, Richards, & Short, 1965) scores, or indices of anxiety state, i.e., State-trait Anxiety Inventory (STAI) scores were also investigated. Materials and Methods Subjects The subjects of this study were outpatients who visited for the first time during the period from June 2000 to March 2001 the clinic of the Department of Psychosomatic Medicine in Kyushu University Hospital, a tertiary medical care center. This department provides western psychosomatic and psychiatric medicine. Approximately half of them were walk-in patients and the others were referrals. After preexamination by the phy- sician in order to make a provisional diagnosis, the patients were assigned to the attending physicians and given a complete checkup. Subjects with organic neurological disorders, endo- crine disorders, neoplasm, vascular disorders, infection, degen- erative diseases, or traumatism were excluded from the analy- ses. Subjects whose diagnoses could not be identified, whose chief complaints were not described, or who left more than 21 questions on the KMI questionnaire unanswered, were also excluded. Thus, 579 subjects remained among all the 914 out- patients. All of the 579 participant patients gave written in- formed consent for the relevant medical examinations. The protocol of the present survey was approved by the Research Ethics Committee of Graduate School of Medical Sciences, Kyushu University. Assessment of Symptoms At the preliminary examination, questionnaires and an inter- view were conducted with each outpatient, who gave written consent. All the patients were asked to describe up to three chief complaints. The questionnaires included the Kyudai Medical Index (KMI), a modification of the Cornell Medical Index-Health Questionnaire (Matsuoka, 1990), SDS, and STAI. Subjective psychiatric symptoms associated with depressive disorders were assessed by the SDS questionnaire. The state anxiety and trait anxiety were assessed by STAI-I and STAI-II, respectively, which were parts of STAI (Spielberger, Gorsuch, & Lushene, 1970). The reliability and validity of the SDS for testing depressive state have been proven (Zung et al., 1965). The cutoff score for screening depression has been reported to 40 points (Zung et al., 1965). The reliability and validity of Japanese version of STAI for testing anxiety has been proven, whose Cronbach’s coefficient alpha was as much as 0.92 (Na- kasato, 1990). The KMI consists of 102 yes or no questions, which include two comprehensive questions, two questions about past history, two questions about family history, 50 ques- tions about psychiatric symptoms, and 46 questions about so- matic symptoms. It has been reported that Category B and C scores in KMI could distinguish healthy controls from patients with psychosomatic disorders and those with neurotic disorders. It could also distinguish patients with neurotic disorders from those with psychosomatic disorders (Matsuoka, 1990). Evaluation o f Symp t oms and Signs in Oriental Syndromes The oriental syndromes derived from Qi, blood or fluid in each patient were evaluated according to Terasawa’s Qi-blood- fluid scoring system for the diagnosis of Qi-deficiency, Qi- stagnation, Qi-flowback, blood stagnation, blood deficiency, and fluid retention (Katsutoshi Terasawa, 1990; K. Terasawa, 2004). For example, the B-42 question in the KMI, “Do you enjoy nothing and are you depressed?” was regarded as a de- pressive mood, which corresponds to 18 points for Qi-stagna- tion in Terasawa’s system. As a whole, 8 of 14 factors in Qi- deficiency criteria, 11 of 12 factors in Qi-stagnation criteria, 11 of 12 factors in Qi-flowback criteria, 8 of 12 factors in blood deficiency criteria, and 11 of 18 factors in the fluid retention criteria corresponded to some of the chief complaints or ques- tions in the KMI of all the subjects. However, among 17 blood stagnation factors, only one corresponded to any of the chief complaints or KMI questions. Therefore, blood stagnation scores were not calculated. Among the 102 questions of the KMI, 40 corresponded to factors of Terasawa’s scoring system. The kinds of chief complaints reached 183. Among them, 58 were included in Terasawa’s scoring system. The correspon- dence between symptoms described as chief complaints or in the KMI, and terms related to Qi-blood-fluid patterns are shown in Appendix 2 and 3, respectively. Some symptoms were in- quired about twice using different words. Some symptoms cor- responded to two Qi-blood-fluid patterns. In Terasawa’s scoring system, a full point count is given when the symptom or sign is apparent and half the points are scored when it is slight. There- fore, full scores were assigned to the chief complaints corre- sponding to Terasawa’s criteria, while symptoms which were not described as the chief complaints but described in the KMI questionnaire were regarded to be slight and half scores were assigned to them. Statistics All analyses were performed using Stata version 10.1 (Stata Corp., College Station, Texas, USA). Kolmogorov Smirnov’s statistic was calculated to evaluate the normality of the distribu- tion. Sexual differences in the proportion of diagnoses were tested by the chi-square test for independence. In order to com-  C. ENGLERT ET AL. 645 pare the means of continuous variables of the two groups, Welch’s t test was used. Multiple logistic regression analyses were performed to es- timate the association between the prevalence of occidental diagnoses and Qi-deficiency, Qi-stagnation, Qi-flowback, blood deficiency, and fluid retention, as dummy variables for the nearest quartiles, adjusted for age (<40 or 40+ years old). To obtain the correlation between two continuous variables, Spear- man’s rank correlation coefficients were estimated. A two-sided p < 0.05 was considered to be statistically significant. Results Demographic and Occidental Status The demographic and occidental aspects of the subjects are shown in Table 1. The continuous variables are shown as mean ± standard deviation. The mean age of the subjects was 36.4 years old without significant sexual difference. The average scores in SDS, STAI-I and STAI II were 50.6 points, 54.8 points and 55.3 points per 80 points, respectively. In KMI, the average score for category B questions, i.e., questions assessing psychiatric symptoms, were 23.3 points per 50 points. The average score for the somatic symptoms catego- rized as KMI C questions was 15.4 per 47 points. These are close to those of patients with neurotic disorders in the previous study (Matsuoka, 1990). The numbers of patients with each disorder and their per- centage are shown. The prevalence of mood disorders, anxiety disorders, eating disorders, somatoform disorders, and irritable bowel syndrome was 54.2%, 19.9%, 10.9%, 7.6%, and 6.6%, respectively. The total numbers of patients with subclassifica- tion diseases did not equal the number in each corresponding major division due to overlapping. Oriental Status In order to investigate the extent of Qi-blood-fluid patterns according to sex and age, analysis of covariance was performed. As shown in Table 2, Qi-flowback, blood deficiency and fluid retention were significantly higher in females. Age was nega- tively correlated with fluid retention scores. Corr elations among Qi-Blood-Fluid Patterns (Figure 1) Since Kolmogorov Smirnov’s value showed skewed distribu- tion of the fluid retention scores, Spearman’s rank correlation coefficients were calculated among Qi-blood-fluid patterns by sex. Strong correlation coefficients (>0.5) were observed be- tween Qi-deficiency and Qi-stagnation in males and between blood deficiency and fluid retention in each sex. In females, the association between the scores was weak on the whole except for a strong association between blood deficiency and fluid retention. Relatively strong associations were observed among Qi-flowback, blood deficiency and fluid retention, between Qi-deficiency and Qi-stagnation, and between Qi-stagnation and Qi-flowback in females. Associations between Qi-Blood-Fluid Patterns and Occidental Diagnoses To investigate the association between oriental diagnoses as given above and occidental diagnoses according to major divi- sions as given by the attending physicians, multiple logistic regression analyses were conducted by sex. The adjusted odds ratio (OR) and its 95% confidence interval (CI) are shown in Table 3. In the same way, the association between oriental di- agnoses according to minor divisions was also investigated and shown in Table 4. Although not shown in the tables, the catego- rizing age had almost no effect on the results. Higher Qi-deficiency and Qi-stagnation were significantly associated with mood disorders and major depression in both sexes. On the other hand, Qi-deficiency scores were inversely associated with “depressive disorder not otherwise specified” in both sexes. The association between dysthymic disorder and the Qi-blood-fluid patterns was not statistically significant, whose data are not shown. In anxiety disorders, the results were different between fe- males and males. In females, Qi-flowback was associated with all anxiety disorders as shown in Table 3 and generalized anxi- ety disorder as shown in Table 4. In males, only blood defi- ciency was associated with generalized anxiety disorder as shown in Table 4. Furthermore, fluid retention in females was associated with eating disorders as shown in Table 3. Qi-flowback and blood deficiency in females were associated with somatoform disor- ders. On the other hand, fluid retention in females was inversely associated with somatoform disorders. Associations between somatic diseases and Qi-blood-fluid patterns were also investigated. As the only positive result, extremely high Qi-flowback in females was associated with irritable bowel syndrome, as shown in Table 4. Associations between Qi-Blood-Fluid Patterns and Psychological Questionnaire scores (Table 5) In order to investigate the oriental aspect of psychological defects, multiple logistic regression analysis was performed. The dependent variable was SDS, State or Trait anxiety scores. The explanatory variables were Qi-deficiency, Qi-stagnation, Qi-flowback, blood deficiency, and fluid retention. In STAI scores, the results were different between females and males. In females, any Qi-pattern was associated with ei- ther high State or Trait anxiety scores. On the other hand, only high Qi-deficiency among the Qi-patterns was associated with high STAI scores in males. Instead, blood deficiency was asso- ciated with high State anxiety scores in males. All the Qi-patterns in both sexes except for Qi-flowback in males and blood deficiency in males were associated with high SDS scores. Discussion The average score for psychiatric symptoms categorized as KMI B questions in the KMI was 23.3/50, which was higher than the average reported previously for normal subjects, 9.5/50, and those with psychosomatic diseases, 18.8/50. However, it was lower than that of patients with neurosis, 24.4/50 (Matsu- oka, 1990). The average score for the somatic symptoms cate- gorized as KMI C questions was 15.4/47, which was higher than that of normal subjects, 5.1/47, that of patients with psy- chosomatic diseases, 14.8/47, and lower than that of neurosis, 15.6/47, in the previous report (Matsuoka, 1990). Thus, the subjects of the present study were considered to range between psychosomatic and neurotic. The present study indicates that blood deficiency and fluid retention scores were higher in females than males. The corre- lation coefficients were more than 0.5 between Qi-deficiency 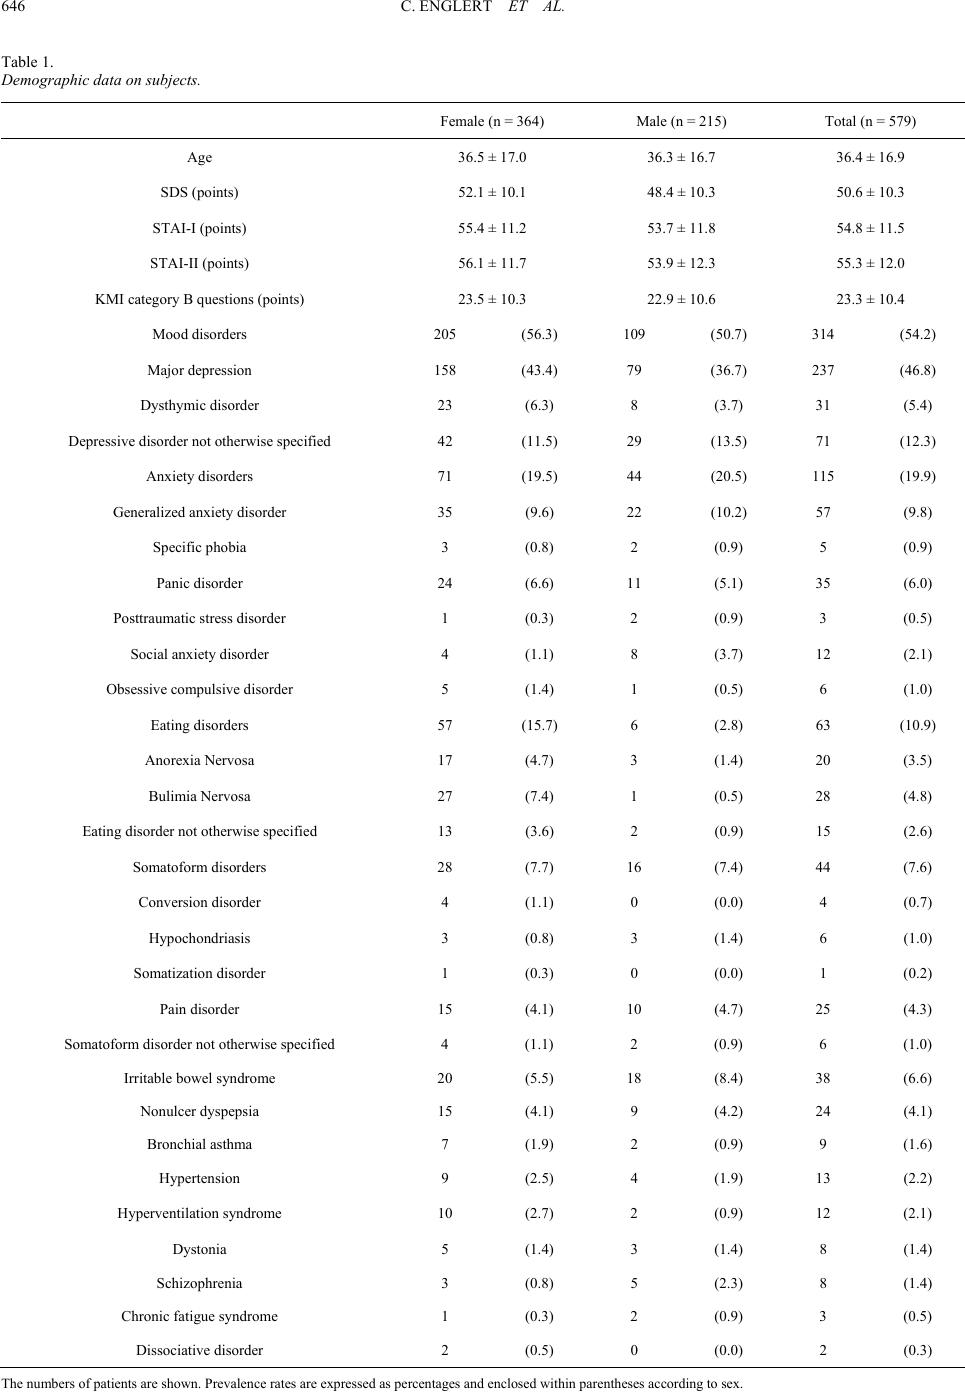 C. ENGLERT ET AL. 646 Table 1. Demographic data on subjects. Female (n = 364) Male (n = 215) Total (n = 579) Age 36.5 ± 17.0 36.3 ± 16.7 36.4 ± 16.9 SDS (points) 52.1 ± 10.1 48.4 ± 10.3 50.6 ± 10.3 STAI-I (points) 55.4 ± 11.2 53.7 ± 11.8 54.8 ± 11.5 STAI-II (points) 56.1 ± 11.7 53.9 ± 12.3 55.3 ± 12.0 KMI category B questions (points) 23.5 ± 10.3 22.9 ± 10.6 23.3 ± 10.4 Mood disorders 205 (56.3) 109 (50.7) 314 (54.2) Major depression 158 (43.4) 79 (36.7) 237 (46.8) Dysthymic disorder 23 (6.3) 8 (3.7) 31 (5.4) Depressive disorder not otherwise specified 42 (11.5) 29 (13.5) 71 (12.3) Anxiety disorders 71 (19.5) 44 (20.5) 115 (19.9) Generalized anxiety disorder 35 (9.6) 22 (10.2) 57 (9.8) Specific phobia 3 (0.8) 2 (0.9) 5 (0.9) Panic disorder 24 (6.6) 11 (5.1) 35 (6.0) Posttraumatic stress disorder 1 (0.3) 2 (0.9) 3 (0.5) Social anxiety disorder 4 (1.1) 8 (3.7) 12 (2.1) Obsessive compulsive disorder 5 (1.4) 1 (0.5) 6 (1.0) Eating disorders 57 (15.7) 6 (2.8) 63 (10.9) Anorexia Nervosa 17 (4.7) 3 (1.4) 20 (3.5) Bulimia Nervosa 27 (7.4) 1 (0.5) 28 (4.8) Eating disorder not otherwise specified 13 (3.6) 2 (0.9) 15 (2.6) Somatoform disorders 28 (7.7) 16 (7.4) 44 (7.6) Conversion disorder 4 (1.1) 0 (0.0) 4 (0.7) Hypochondriasis 3 (0.8) 3 (1.4) 6 (1.0) Somatization disorder 1 (0.3) 0 (0.0) 1 (0.2) Pain disorder 15 (4.1) 10 (4.7) 25 (4.3) Somatoform disorder not otherwise specified 4 (1.1) 2 (0.9) 6 (1.0) Irritable bowel syndrome 20 (5.5) 18 (8.4) 38 (6.6) Nonulcer dyspepsia 15 (4.1) 9 (4.2) 24 (4.1) Bronchial asthma 7 (1.9) 2 (0.9) 9 (1.6) Hypertension 9 (2.5) 4 (1.9) 13 (2.2) Hyperventilation syndrome 10 (2.7) 2 (0.9) 12 (2.1) Dystonia 5 (1.4) 3 (1.4) 8 (1.4) Schizophrenia 3 (0.8) 5 (2.3) 8 (1.4) Chronic fatigue syndrome 1 (0.3) 2 (0.9) 3 (0.5) Dissociative disorder 2 (0.5) 0 (0.0) 2 (0.3) The numbers of patients are shown. Prevalence rates are expressed as percentages and enclosed within parentheses according to sex. 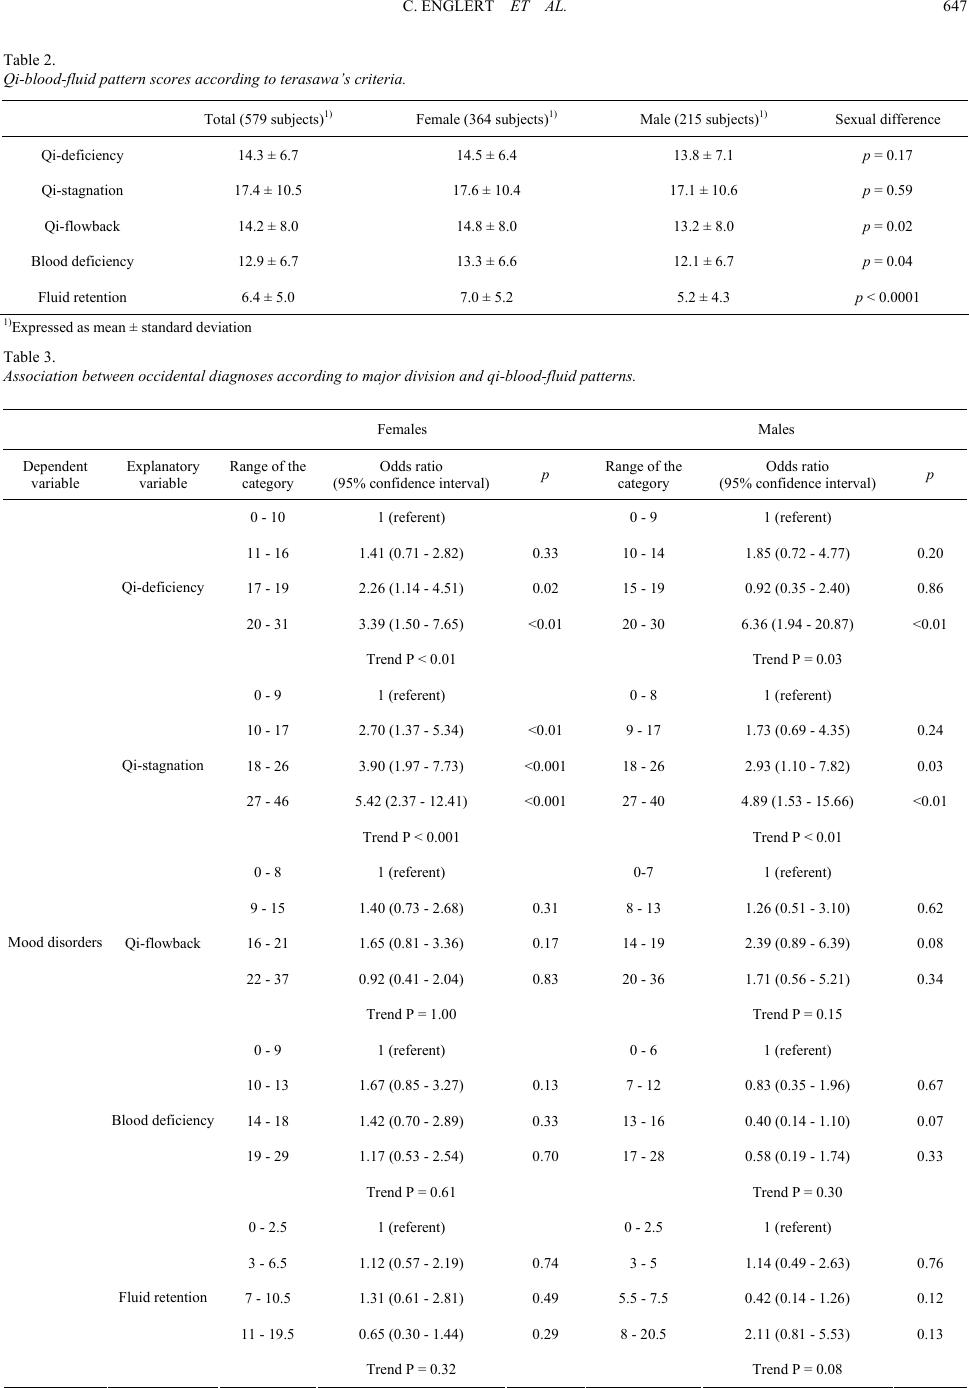 C. ENGLERT ET AL. 647 Table 2. Qi-blood-fluid pattern s cor es a cc or ding to terasawa’s c r it eri a. Total (579 subjects)1) Female (364 subjects)1) Male (215 subjects)1) Sexual difference Qi-deficiency 14.3 ± 6.7 14.5 ± 6.4 13.8 ± 7.1 p = 0.17 Qi-stagnation 17.4 ± 10.5 17.6 ± 10.4 17.1 ± 10.6 p = 0.59 Qi-flowback 14.2 ± 8.0 14.8 ± 8.0 13.2 ± 8.0 p = 0.02 Blood deficiency 12.9 ± 6.7 13.3 ± 6.6 12.1 ± 6.7 p = 0.04 Fluid retention 6.4 ± 5.0 7.0 ± 5.2 5.2 ± 4.3 p < 0.0001 1)Expressed as mean ± standard deviation Table 3. Association between occide nt al di agnoses according to major division and qi-blood- fl ui d patterns. Females Males Dependent variable Explanatory variable Range of the category Odds ratio (95% confidence interval) p Range of the category Odds ratio (95% confidence interval) p 0 - 10 1 (referent) 0 - 9 1 (referent) 11 - 16 1.41 (0.71 - 2.82) 0.33 10 - 14 1.85 (0.72 - 4.77) 0.20 17 - 19 2.26 (1.14 - 4.51) 0.02 15 - 19 0.92 (0.35 - 2.40) 0.86 20 - 31 3.39 (1.50 - 7.65) <0.01 20 - 30 6.36 (1.94 - 20.87) <0.01 Qi-deficiency Trend P < 0.01 Trend P = 0.03 0 - 9 1 (referent) 0 - 8 1 (referent) 10 - 17 2.70 (1.37 - 5.34) <0.01 9 - 17 1.73 (0.69 - 4.35) 0.24 18 - 26 3.90 (1.97 - 7.73) <0.001 18 - 26 2.93 (1.10 - 7.82) 0.03 27 - 46 5.42 (2.37 - 12.41) <0.001 27 - 40 4.89 (1.53 - 15.66) <0.01 Qi-stagnation Trend P < 0.001 Trend P < 0.01 0 - 8 1 (referent) 0-7 1 (referent) 9 - 15 1.40 (0.73 - 2.68) 0.31 8 - 13 1.26 (0.51 - 3.10) 0.62 16 - 21 1.65 (0.81 - 3.36) 0.17 14 - 19 2.39 (0.89 - 6.39) 0.08 22 - 37 0.92 (0.41 - 2.04) 0.83 20 - 36 1.71 (0.56 - 5.21) 0.34 Qi-flowback Trend P = 1.00 Trend P = 0.15 0 - 9 1 (referent) 0 - 6 1 (referent) 10 - 13 1.67 (0.85 - 3.27) 0.13 7 - 12 0.83 (0.35 - 1.96) 0.67 14 - 18 1.42 (0.70 - 2.89) 0.33 13 - 16 0.40 (0.14 - 1.10) 0.07 19 - 29 1.17 (0.53 - 2.54) 0.70 17 - 28 0.58 (0.19 - 1.74) 0.33 Blood deficiency Trend P = 0.61 Trend P = 0.30 0 - 2.5 1 (referent) 0 - 2.5 1 (referent) 3 - 6.5 1.12 (0.57 - 2.19) 0.74 3 - 5 1.14 (0.49 - 2.63) 0.76 7 - 10.5 1.31 (0.61 - 2.81) 0.49 5.5 - 7.5 0.42 (0.14 - 1.26) 0.12 11 - 19.5 0.65 (0.30 - 1.44) 0.29 8 - 20.5 2.11 (0.81 - 5.53) 0.13 Mood disorders Fluid retention Trend P = 0.32 Trend P = 0.08  C. ENGLERT ET AL. 648 0 - 10 1 (referent) 0 - 9 1 (referent) 11 - 16 2.59 (1.18 - 5.69) 0.02 10 - 14 1.69 (0.60 - 4.74) 0.32 17 - 19 0.83 (0.36 - 1.96) 0.68 15 - 19 0.89 (0.29 - 2.71) 0.84 20 - 31 0.82 (0.30 - 2.29) 0.71 20 - 30 0.46 (0.12 - 1.87) 0.28 Qi-deficiency Trend P = 0.37 Trend P = 0.27 0 - 9 1 (referent) 0 - 8 1 (referent) 10 - 17 0.56 (0.25 - 1.23) 0.15 9 - 17 0.63 (0.23 - 1.76) 0.38 18 - 26 0.41 (0.18 - 0.92) 0.03 18 - 26 0.52 (0.17 - 1.66) 0.27 27 - 46 0.35 (0.14 - 0.90) 0.03 27 - 40 0.32 (0.08 - 1.29) 0.11 Qi-stagnation Trend P < 0.01 Trend P = 0.10 0 - 8 1 (referent) 0 - 7 1 (referent) 9 - 15 2.74 (1.17 - 6.42) 0.02 8 - 13 2.24 (0.81 - 6.21) 0.12 16 - 21 3.58 (1.42 - 9.03) <0.01 14 - 19 1.76 (0.56 - 5.49) 0.33 22 - 37 6.11 (2.26 - 16.56) <0.001 20 - 36 1.78 (0.53 - 6.01) 0.35 Qi-flowback Trend P < 0.001 Trend P = 0.45 0 - 9 1 (referent) 0 - 6 1 (referent) 10 - 13 1.53 (0.71 - 3.30) 0.28 7 - 12 0.89 (0.31 - 2.55) 0.83 14 - 18 1.16 (0.51 - 2.66) 0.72 13 - 16 2.20 (0.74 - 6.53) 0.16 19 - 29 1.21 (0.47 - 3.14) 0.69 17 - 28 1.50 (0.45 - 4.99) 0.51 Blood deficiency Trend P = 0.78 Trend P = 0.25 0 - 2.5 1 (referent) 0 - 2.5 1 (referent) 3 - 6.5 1.14 (0.53 - 2.47) 0.74 3 - 5 0.92 (0.34 - 2.46) 0.87 7 - 10.5 0.96 (0.41 - 2.25) 0.93 5.5 - 7.5 1.62 (0.52 - 4.99) 0.40 11 - 19.5 0.46 (0.17 - 1.23) 0.12 8 - 20.5 0.76 (0.25 - 2.28) 0.63 Anxiety disor- ders Fluid retention Trend P = 0.15 Trend P = 0.47 0 - 10 1 (referent) 0-9 1 (referent) 11 - 16 0.54 (0.20 - 1.46) 0.22 10 - 14 0.20 (0.01 - 4.01) 0.29 17 - 19 1.19 (0.45 - 3.14) 0.73 15 - 19 0.17 (0.01 - 3.53) 0.25 20 - 31 0.44 (0.13 - 1.49) 0.19 20 - 30 0.34 (0.02 - 6.00) 0.46 Qi-deficiency Trend P = 0.74 Trend P = 0.53 0 - 9 1 (referent) 0 - 8 1 (referent) 10 - 17 1.40 (0.53 - 3.66) 0.50 9 - 17 0.92 (0.04 - 20.05) 0.96 18 - 26 1.80 (0.72 - 4.51) 0.21 18 - 26 3.27 (0.18 - 59.93) 0.43 27 - 46 0.65 (0.20 - 2.13) 0.47 27 - 40 0.91 (0.03 - 31.59) 0.96 Qi-stagnation Trend P = 0.96 Trend P = 0.94 0 - 8 1 (referent) 0 - 7 1 (referent) 9 - 15 0.86 (0.33 - 2.23) 0.76 8 - 13 1.42 (0.08 - 26.67) 0.81 Eating disorders Qi-flowback 16 - 21 1.19 (0.43 - 3.30) 0.73 14 - 19 1.60 (0.07 - 37.29) 0.77  C. ENGLERT ET AL. 649 22 - 37 0.65 (0.21 - 2.01) 0.45 20 - 36 5.20 (0.27 - 98.49) 0.27 Trend P = 0.55 Trend P = 0.22 0 - 9 1 (referent) 0 - 6 1 (referent) 10 - 13 0.98 (0.38 - 2.52) 0.97 7 - 12 0.95 (0.05 - 19.40) 0.97 14 - 18 0.56 (0.21 - 1.54) 0.26 13 - 16 1.67 (0.08 - 34.72) 0.74 19 - 29 0.36 (0.13 - 1.06) 0.06 17 - 28 2.21 (0.09 - 52.26) 0.62 Blood deficiency Trend P = 0.05 Trend P = 0.64 0 - 2.5 1 (referent) 0 - 2.5 1 (referent) 3 - 6.5 0.70 (0.24 - 2.03) 0.51 3 - 5 0.39 (0.03 - 5.38) 0.48 7 - 10.5 2.28 (0.79 - 6.57) 0.13 5.5 - 7.5 0.32 (0.02 - 6.58) 0.46 11 - 19.5 6.10 (2.09 - 17.79) < 0.001 8 - 20.5 0.97 (0.09 - 10.92) 0.98 Fluid retention Trend P < 0.001 Trend P = 0.83 0 - 10 1 (referent) 0-9 1 (referent) 11 - 16 0.16 (0.04 - 0.69) 0.01 10 - 14 1.12 (0.16 - 7.75) 0.91 17 - 19 0.19 (0.05 - 0.72) 0.01 15 - 19 2.40 (0.42 - 13.85) 0.33 20 - 31 0.23 (0.05 - 1.13) 0.07 20 - 30 1.02 (0.12 - 8.74) 0.99 Qi-deficiency Trend P < 0.01 Trend P = 0.68 0 - 9 1 (referent) 0 - 8 1 (referent) 10 - 17 0.64 (0.18 - 2.32) 0.50 9 - 17 1.21 (0.16 - 9.41) 0.85 18 - 26 0.48 (0.12 - 1.93) 0.30 18 - 26 3.34 (0.56 - 19.98) 0.19 27 - 46 0.25 (0.04 - 1.69) 0.16 27 - 40 5.07 (0.62 - 41.22) 0.13 Qi-stagnation Trend P = 0.16 Trend P = 0.09 0 - 8 1 (referent) 0 - 7 1 (referent) 9 - 15 2.72 (0.76 - 9.71) 0.12 8 - 13 0.12 (0.01 - 1.35) 0.09 16 - 21 4.13 (1.05 - 16.28) 0.04 14 - 19 1.01 (0.19 - 5.24) 0.99 22 - 37 7.65 (1.51 - 38.84) 0.01 20 - 36 1.03 (0.16 - 6.70) 0.98 Qi-flowback Trend P = 0.01 Trend P = 0.43 0 - 9 1 (referent) 0 - 6 1 (referent) 10 - 13 0.98 (0.22 - 4.27) 0.98 7 - 12 0.86 (0.20 - 3.79) 0.84 14 - 18 3.33 (0.87 - 12.68) 0.08 13 - 16 0.73 (0.11 - 4.79) 0.74 19 - 29 25.49 (4.82 - 134.67) < 0.001 17 - 28 0.73 (0.11 - 5.02) 0.75 Blood deficiency Trend P < 0.001 Trend P = 1.00 0 - 2.5 1 (referent) 0 - 2.5 1 (referent) 3 - 6.5 0.35 (0.10 - 1.15) 0.08 3 - 5 0.40 (0.09 - 1.81) 0.23 7 - 10.5 0.05 (0.01 - 0.27) < 0.001 5.5 - 7.5 0.25 (0.03 - 1.84) 0.17 11 - 19.5 0.03 (0.01 - 0.20) < 0.001 8 - 20.5 0.08 (0.01 - 0.90) 0.04 Somatoform disorders Fluid retention Trend P < 0.001 Trend P = 0.05  C. ENGLERT ET AL. 650 Table 4. Association between occide nt al di agnoses according to major division and Qi-blood- fl ui d patterns. Females Males Dependent variable Explanatory variable Range of the category Odds ratio (95% confidence interval)p Range of the category Odds ratio (95% confidence interval)p 0 - 10 1 (referent) 0 - 9 1 (referent) 11 - 16 3.17 (1.32 - 7.60) <0.01 10 - 14 11.66 (2.02 - 67.28) <0.01 17 - 19 4.94 (2.09 - 11.70) <0.00115 - 19 8.08 (1.48 - 44.31) 0.02 20 - 31 8.43 (3.21 - 22.17) <0.00120 - 30 58.60 (8.92 - 384.93) <0.001 Qi-deficiency Trend P < 0.001 Trend P < 0.001 0 - 9 1 (referent) 0 - 8 1 (referent) 10 - 17 3.78 (1.64 - 8.72) <0.01 9 - 17 2.55 (0.62 - 10.50) 0.19 18 - 26 5.60 (2.45 - 12.79) <0.00118 - 26 3.89 (0.93 - 16.21) 0.06 27 - 46 8.84 (3.44 - 22.70) <0.00127 - 40 8.70 (1.94 - 39.07) <0.01 Qi-stagnation Trend P < 0.001 Trend P = 0.02 0 - 8 1 (referent) 0 - 7 1 (referent) 9 - 15 1.31 (0.60 - 2.85) 0.50 8 - 13 1.16 (0.33 - 4.16) 0.82 16 - 21 1.73 (0.75 - 3.95) 0.20 14 - 19 2.90 (0.76 - 11.14) 0.12 22 - 37 1.07 (0.44 - 2.61) 0.88 20 - 36 1.54 (0.37 - 6.50) 0.55 Qi-flowback Trend P = 0.82 Trend P = 0.29 0 - 9 1 (referent) 0 - 6 1 (referent) 10 - 13 1.59 (0.73 - 3.44) 0.24 7 - 12 1.22 (0.39 - 3.79) 0.74 14 - 18 1.08 (0.47 - 2.47) 0.85 13 - 16 0.48 (0.13 - 1.81) 0.28 19 - 29 1.05 (0.44 - 2.52) 0.91 17 - 28 0.82 (0.21 - 3.17) 0.77 Blood deficiency Trend P = 0.98 Trend P = 0.94 0 - 2.5 1 (referent) 0 - 2.5 1 (referent) 3 - 6.5 0.67 (0.31 - 1.48) 0.33 3 - 5 0.94 (0.31 - 2.88) 0.92 7 - 10.5 1.10 (0.46 - 2.63) 0.83 5.5 - 7.5 0.47 (0.13 - 1.73) 0.26 11 - 19.5 0.63 (0.26 - 1.53) 0.31 8 - 20.5 2.02 (0.57 - 7.10) 0.27 Major depression Fluid retention Trend P = 0.50 Trend P = 0.12 0 - 10 1 (referent) 0 - 9 1 (referent) 11 - 16 0.50 (0.20 - 1.23) 0.13 10 - 14 0.80 (0.25 - 2.54) 0.71 17 - 19 0.35 (0.13 - 0.94) 0.04 15 - 19 0.08 (0.01 - 0.49) <0.01 20 - 31 0.21 (0.05 - 0.82) 0.03 20 - 30 0.05 (0.00 - 0.51) 0.01 Qi-deficiency Trend P < 0.01 Trend P < 0.001 Depressive disorder not otherwise specified Qi-stagnation 0 - 9 1 (referent) 0 - 8 1 (referent)  C. ENGLERT ET AL. 651 10 - 17 0.66 (0.25 - 1.77) 0.41 9 - 17 1.31 (0.40 - 4.21) 0.66 18 - 26 1.04 (0.41 - 2.60) 0.94 18 - 26 2.57 (0.69 - 9.59) 0.16 27 - 46 0.34 (0.08 - 1.43) 0.14 27 - 40 0.28 (0.03 - 3.06) 0.30 Trend P = 0.40 Trend P = 0.66 0 - 8 1 (referent) 0 - 7 1 (referent) 9 - 15 1.14 (0.46 - 2.81) 0.77 8 - 13 1.94 (0.61 - 6.15) 0.26 16 - 21 1.98 (0.77 - 5.07) 0.16 14 - 19 1.84 (0.50 - 6.84) 0.36 22 - 37 0.49 (0.12 - 2.03) 0.33 20 - 36 2.67 (0.58 - 12.37) 0.21 Qi-flowback Trend P = 0.95 Trend P = 0.13 0 - 9 1 (referent) 0 - 6 1 (referent) 10 - 13 1.13 (0.44 - 2.86) 0.80 7 - 12 0.67 (0.21 - 2.10) 0.49 14 - 18 1.62 (0.64 - 4.13) 0.31 13 - 16 0.78 (0.21 - 2.93) 0.72 19 - 29 1.06 (0.32 - 3.49) 0.93 17 - 28 0.28 (0.05 - 1.52) 0.14 Blood deficiency Trend P = 0.59 Trend P = 0.22 0 - 2.5 1 (referent) 0 - 2.5 1 (referent) 3 - 6.5 2.55 (1.03 - 6.30) 0.04 3 - 5 1.28 (0.42 - 3.95) 0.66 7 - 10.5 1.88 (0.69 - 5.13) 0.22 5.5 - 7.5 0.19 (0.02 - 1.93) 0.16 11 - 19.5 0.28 (0.05 - 1.45) 0.13 8 - 20.5 2.14 (0.62 - 7.38) 0.23 Fluid retention Trend P = 0.23 Trend P = 0.23 0 - 10 1 (referent) 0 - 9 1 (referent) 11 - 16 2.17 (0.78 - 6.01) 0.14 10 - 14 0.91 (0.25 - 3.35) 0.89 17 - 19 0.32 (0.09 - 1.21) 0.09 15 - 19 0.52 (0.12 - 2.20) 0.37 20 - 31 1.02 (0.29 - 3.59) 0.98 20 - 30 0.20 (0.03 - 1.40) 0.10 Qi-deficiency Trend P = 0.29 Trend P = 0.10 0 - 9 1 (referent) 0 - 8 1 (referent) 10 - 17 0.47 (0.16 - 1.39) 0.17 9 - 17 1.26 (0.31 - 5.05) 0.75 18 - 26 0.44 (0.14 - 1.34) 0.15 18 - 26 0.87 (0.17 - 4.40) 0.87 27 - 46 0.48 (0.14 - 1.67) 0.25 27 - 40 0.98 (0.16 - 6.08) 0.98 Qi-stagnation Trend P = 0.07 Trend P = 0.89 0 - 8 1 (referent) 0 - 7 1 (referent) 9 - 15 1.73 (0.55 - 5.44) 0.35 8 - 13 3.21 (0.78 - 13.24) 0.11 16 - 21 4.23 (1.32 - 13.59) 0.02 14 - 19 1.73 (0.34 - 8.80) 0.51 22 - 37 4.44 (1.11 - 17.74) 0.03 20 - 36 1.79 (0.35 - 9.17) 0.49 Qi-flowback Trend P = 0.01 Trend P = 0.90 Generalized anxiety disorder Blood deficiency 0 - 9 1 (referent) 0 - 6 1 (referent)  C. ENGLERT ET AL. 652 10 - 13 0.71 (0.23 - 2.23) 0.56 7 - 12 1.50 (0.30 - 7.50) 0.62 14 - 18 1.10 (0.37 - 3.27) 0.86 13 - 16 5.63 (1.14 - 27.84) 0.03 19 - 29 1.12 (0.30 - 4.16) 0.87 17 - 28 6.73 (1.21 - 37.40) 0.03 Trend P = 0.71 Trend P = 0.02 0 - 2.5 1 (referent) 0 - 2.5 1 (referent) 3 - 6.5 0.36 (0.10 - 1.25) 0.11 3 - 5 0.64 (0.17 - 2.36) 0.50 7 - 10.5 0.95 (0.33 - 2.79) 0.93 5.5 - 7.5 0.89 (0.22 - 3.70) 0.88 11 - 19.5 0.50 (0.14 - 1.81) 0.29 8 - 20.5 0.17 (0.03 - 1.02) 0.05 Fluid retention Trend P = 0.48 Trend P = 0.03 0 - 10 1 (referent) 0 - 9 1 (referent) 11 - 16 0.90 (0.17 - 4.83) 0.90 10 - 14 1.17 (0.21 - 6.65) 0.86 17 - 19 1.55 (0.32 - 7.56) 0.59 15 - 19 1.25 (0.21 - 7.39) 0.80 20 - 31 2.09 (0.38 - 11.53) 0.40 20 - 30 2.88 (0.42 - 19.67) 0.28 Qi-deficiency Trend P = 0.28 Trend P = 0.30 0 - 9 1 (referent) 0 - 8 1 (referent) 10 - 17 0.62 (0.12 - 3.26) 0.57 9 - 17 0.25 (0.04 - 1.63) 0.15 18 - 26 0.93 (0.21 - 4.09) 0.92 18 - 26 0.77 (0.15 - 3.91) 0.76 27 - 46 1.51 (0.32 - 7.08) 0.60 27 - 40 0.43 (0.06 - 3.05) 0.40 Qi-stagnation Trend P = 0.41 Trend P = 0.63 0 - 8 1 (referent) 0 - 7 1 (referent) 9 - 15 1.18 (0.24 - 5.92) 0.84 8 - 13 1.86 (0.38 - 9.25) 0.45 16 - 21 1.84 (0.37 - 9.27) 0.46 14 - 19 1.31 (0.22 - 7.94) 0.77 22 - 37 5.14 (1.03 - 25.59) 0.05 20 - 36 2.11 (0.31 - 14.53) 0.45 Qi-flowback Trend P = 0.03 Trend P = 0.54 0 - 9 1 (referent) 0 - 6 1 (referent) 10 - 13 0.34 (0.08 - 1.38) 0.13 7 - 12 0.82 (0.19 - 3.50) 0.79 14 - 18 0.35 (0.08 - 1.50) 0.16 13 - 16 0.52 (0.10 - 2.60) 0.42 19 - 29 0.27 (0.05 - 1.45) 0.13 17 - 28 0.15 (0.02 - 1.21) 0.08 Blood deficiency Trend P = 0.10 Trend P = 0.13 0 - 2.5 1 (referent) 0 - 2.5 1 (referent) 3 - 6.5 6.74 (1.34 - 33.87) 0.02 3 - 5 0.53 (0.09 - 3.08) 0.48 7 - 10.5 1.18 (0.14 - 9.90) 0.88 5.5 - 7.5 2.81 (0.56 - 14.13) 0.21 11 - 19.5 2.04 (0.27 - 15.48) 0.49 8 - 20.5 1.92 (0.41 - 9.09) 0.41 Irritable bowel syndrome Fluid retention Trend P = 0.63 Trend P = 0.38  C. ENGLERT ET AL. 653 Table 5. Association between SDS , state anxiety, trait an x ie t y s c or e s a n d q i -blood-fluid patte r ns i n f emales (a) and males (b). (a) State anxiety Trait anxiety SDS Range of the category Odds ratio (95% confidence interval) p Range of the category Odds ratio (95% confidence interval)p Range of the category Odds ratio (95% confidence interval)p 0 - 10 1 (referent) 0 - 10 1 (referent) 0 - 10 1 (referent) 11 - 16 4.31 (1.17 - 7.46) <0.0111 - 16 5.37 (2.09 - 8.65) <0.0111 - 16 2.50 (−0.10 - 5.10)0.06 17 - 19 4.45 (1.27 - 7.64) <0.0117 - 19 8.88 (5.57 - 12.18)<0.00117 - 19 5.47 (2.90 - 8.04) <0.001 20 - 31 3.38 (−0.18 - 6.95) 0.06 20 - 31 9.47 (5.77 - 13.17)<0.00120 - 31 6.03 (3.19 - 8.87) <0.001 Qi-deficiency Trend P = 0.02 Trend P < 0.001 Trend P < 0.001 0 - 9 1 (referent) 0 - 9 1 (referent) 0 - 9 1 (referent) 10 - 17 4.43 (1.28 - 7.58) <0.0110 - 17 3.75 (0.44 - 7.05) 0.0310 - 17 6.46 (3.88 - 9.05) <0.001 18 - 26 6.66 (3.48 - 9.83) <0.00118 - 26 4.27 (0.97 - 7.57) 0.0118 - 26 7.82 (5.25 - 10.38)<0.001 27 - 46 8.55 (4.88 - 12.22) <0.00127 - 46 3.49 (−0.34 - 7.31)0.0727 - 46 9.35 (6.41 - 12.29)<0.001 Qi-stagnation Trend P < 0.001 Trend P = 0.07 Trend P < 0.001 0 - 8 1 (referent) 0 - 8 1 (referent) 0 - 8 1 (referent) 9 - 15 3.49 (0.52 - 6.46) 0.02 9 - 15 4.01 (0.88 - 7.14) 0.019 - 15 2.93 (0.48 - 5.38) 0.02 16 - 21 3.94 (0.67 - 7.22) 0.02 16 - 21 5.74 (2.29 - 9.19) <0.0116 - 21 5.08 (2.40 - 7.75) <0.001 22 - 37 4.85 (1.17 - 8.54) <0.0122 - 37 6.67 (2.70 - 10.65)<0.0122 - 37 6.04 (3.05 - 9.02) <0.001 Qi-flowback Trend P = 0.01 Trend P < 0.001 Trend P < 0.001 0 - 9 1 (referent) 0 - 9 1 (referent) 0 - 9 1 (referent) 10 - 13 1.43 (−1.58 - 4.44) 0.35 10 - 13 1.67 (−1.54 - 4.88)0.3110 - 13 2.02 (−0.41 - 4.45)0.1 14 - 18 1.32 (−1.87 - 4.52) 0.42 14 - 18 1.35 (−1.94 - 4.64)0.4214 - 18 1.85 (−0.73 - 4.42)0.16 19 - 29 1.89 (−1.73 - 5.52) 0.31 19 - 29 1.13 (−2.60 - 4.85)0.5519 - 29 2.83 (−0.04 - 5.71)0.05 Blood deficiency Trend P = 0.29 Trend P = 0.49 Trend P = 0.05 0 - 2.5 1 (referent) 0 - 2.5 1 (referent) 0 - 2.5 1 (referent) 3 - 6.5 −0.12 (−3.15 - 2.90) 0.94 3 - 6.5 −1.35 (−4.49 - 1.80)0.4 3 - 6.5 −0.66 (−3.08 - 1.76)0.59 7 - 10.5 1.58 (−1.81 - 4.98) 0.36 7 - 10.5 −1.45 (−4.97 - 2.07)0.427 - 10.5 −1.35 (−4.02 - 1.33)0.32 11 - 19.5 −0.60 (−4.22 - 3.02) 0.75 11 - 19.5 0.07 (−3.65 - 3.79)0.9711 - 19.5 −1.29 (−4.14 - 1.56)0.38 Fluid retention Trend P = 0.92 Trend P = 0.85 Trend P = 0.39 (b) State anxiety Trait anxiety SDS Range of the category Odds ratio (95% confidence interval) p Range of the category Odds ratio (95% confidence interval)p Range of the category Odds ratio (95% confidence interval)p 0 - 9 1 (referent) 0 - 9 1 (referent) 0 - 9 1 (referent) Qi-deficiency 10 - 14 4.83 (0.27 - 9.39) 0.04 10 - 14 6.37 (1.68 - 11.07)<0.0110 - 14 6.17 (2.73 - 9.61) <0.001  C. ENGLERT ET AL. 654 15 - 19 4.58 (−0.13 - 9.29) 0.06 15 - 19 7.59 (2.79 - 12.39)<0.0115 - 19 8.47 (4.88 - 12.06)<0.001 20 - 30 9.29 (4.08 - 14.49) <0.00120 - 30 10.04 (4.68 - 15.40)<0.00120 - 30 11.02 (7.09 - 14.96)<0.001 Trend P < 0.01 Trend P < 0.001 Trend P < 0.001 0 - 8 1 (referent) 0 - 8 1 (referent) 0 - 8 1 (referent) 9 - 17 2.24 (−2.20 - 6.69) 0.32 9 - 17 6.25 (1.69 - 10.81)<0.019 - 17 5.09 (1.75 - 8.43) <0.01 18 - 26 4.02 (−0.68 - 8.72) 0.09 18 - 26 9.17 (4.29 - 14.04)<0.00118 - 26 5.27 (1.66 - 8.89) <0.01 27 - 40 4.05 (−1.40 - 9.50) 0.15 27 - 40 6.89 (1.35 - 12.43)0.0127 - 40 6.26 (2.18 - 10.35)<0.01 Qi-stagnation Trend P = 0.17 Trend P = 0.03 Trend P = 0.01 0 - 7 1 (referent) 0 - 7 1 (referent) 0 - 7 1 (referent) 8 - 13 1.02 (−3.27 - 5.31) 0.64 8 - 13 0.96 (−3.56 - 5.48)0.688 - 13 2.27 (−0.99 - 5.52)0.17 14 - 19 −0.41 (-5.13 - 4.31) 0.86 14 - 19 −0.41 (−5.28 - 4.46)0.8714 - 19 0.88 (−2.62 - 4.39)0.62 20 - 36 6.94 (1.89 - 11.99) <0.0120 - 36 3.21 (−2.08 - 8.50)0.2320 - 36 4.82 (1.00 - 8.65) 0.01 Qi-flowback Trend P = 0.02 Trend P = 0.41 Trend P = 0.05 0 - 6 1 (referent) 0 - 6 1 (referent) 0 - 6 1 (referent) 7 - 12 5.47 (1.30 - 9.65) 0.01 7 - 12 2.61 (−1.61 - 6.83)0.237 - 12 3.33 (0.16 - 6.50) 0.04 13 - 16 6.08 (1.39 - 10.78) 0.01 13 - 16 3.07 (−1.65 - 7.79)0.2 13 - 16 3.29 (−0.22 - 6.81)0.07 17 - 28 6.76 (1.74 - 11.77) <0.0117 - 28 5.46 (0.34 - 10.58)0.0417 - 28 4.38 (0.58 - 8.18) 0.02 Blood deficiency Trend P = 0.01 Trend P = 0.06 Trend P = 0.03 0 - 2.5 1 (referent) 0 - 2.5 1 (referent) 0 - 2.5 1 (referent) 3 - 5 −0.67 (−4.56 - 3.21) 0.73 3 - 5 −0.88 (−4.82 - 3.06)0.663 - 5 −1.70 (−4.69 - 1.30)0.27 5.5 - 7.5 −3.87 (−8.80 - 1.05) 0.12 5.5 - 7.5 0.04 (−5.05 - 5.13)0.995.5 - 7.5 −2.63 (−6.39 - 1.13)0.17 8 - 20.5 −3.24 (−7.78 - 1.29) 0.16 8 - 20.5 0.05 (−4.60 - 4.70)0.988 - 20.5 −1.20 (−4.63 - 2.23)0.49 Fluid retention Trend P = 0.34 Trend P = 0.86 Trend P = 0.82 Qi- deficiency Qi- stagnation Qi- flowback Blood deficiency Fluid retention 0.48 0.44 0.34 0.43 0.35 0.58 0.40 0.27 0.28 0.29 Qi- deficiency Qi- stagnation Qi- flowback Blood deficiency Fluid retention 0.48 0.44 0.34 0.43 0.35 0.58 0.40 0.27 0.28 0.29 Qi- deficiency Qi- stagnation Qi- flowback Blood deficiency Fluid retention 0.61 0.47 0.42 0.48 0.42 0.56 0.42 0.36 0.42 0.41 Qi- deficiency Qi- stagnation Qi- flowback Blood deficiency Fluid retention 0.61 0.47 0.42 0.48 0.42 0.56 0.42 0.36 0.42 0.41 (a) (b) Figure 1. Associations among Qi-blood-fluid patterns in females (a) and males (b). Thickness of lines shows correlation coefficient. p was less than 0.0001 between every pair.  C. ENGLERT ET AL. 655 and Qi-stagnation in males and between blood deficiency and fluid retention in both sexes. Qi-patterns, especially Qi-defi- ciency and Qi-stagnation in both sexes and blood deficiency in males were associated with either major depression or high SDS scores. Qi-deficiency in both sexes, Qi-flowback in fe- males, and blood deficiency in males, were associated with anxiety disorders or high STAI scores. Qi-stagnation in females was associated with STAI-I and inversely associated with total anxiety disorders. Fluid retention was associated with eating disorder in females. Qi-flowback and blood deficiency in fe- males were associated with somatoform disorders. Qi-flowback in females was associated with irritable bowel syndrome. Depression has been considered attributable to Qi-stagnation (Qiao et al., 2007; Wang et al., 2009; Yu et al., 2007; Zhou et al., 2006) and it is the case in the present study. However, our study indicated a stronger association between Qi-deficiency and major depression than Qi-stagnation in males. This result coin- cides with the stronger association between Qi-deficiency scores and SDS scores than between Qi-stagnation and SDS scores in males. Thus, resupply of Qi is important in treating male patients in the depressive state. The association with whole mood disorders was similar to that with major depression, since major depression made up 75% of the whole mood disor- ders. There have been few reports on oriental conditions in pa- tients with depression. Yang et al. gave acupuncture to patients with depression in view of their Qi-stagnation, blood stagnation, and Yan-deficiency, which is a combination of Qi-deficiency and cold constitution (Yang & Zhi, 1994). Qi-stagnation is re- portedly associated with depression in more than half of the cases (Zhou, Chen, & Mei, 2006). In the present study, strong (more than 0.4) correlations with the SDS score, which reflect the extent of the psychological aspect of the depressive state, were observed in not only Qi-stagnation but also Qi-deficiency and Qi-flowback scores in both sexes. In treating the depressive state, re-supply of Qi or reducing Qi-flowback would also be effective as well as disobliteration of Qi-stagnation. In the present study, examination of the association between depression and the chief complaints and KMI suggested that the strong association between depression and Qi-deficiency shown in Table 3 may be attributed to the strong association between depression and appetite loss, sensitivity to noise, hypobulia, and general fatigue among criteria for Qi-deficiency. The strong association between depression and Qi-stagnation could be attributed to the strong association between depression and hypobulia, appetite loss, headache/head discomfort, melancholy, unpleasant sensation of laryngopharynx, chest oppression, epi- gastric discomfort, a diversity of symptoms, and dependency of symptoms on mood. The strong association between SDS scores and Qi-flowback is considered attributable to the strong association between depression and glow/chills, nausea/vomiting, headache, palpita- tion, sensitivity to noise, feeling of cold, diaphoresis, and abrupt perspiration, which are Qi-flowback symptoms. These symptoms also exist in the criteria for panic disorder, which often coexists with major depression. Recently, the coexistence and similarity between depression and panic disorder have been reported, which is an entity called “anxious depression in panic disorder.” Although no association between panic disorder and Qi-flowback was detected in the present study, such comorbid- ity may account for the association between SDS scores and Qi-flowback. Since Qi-flowback was associated with not only SDS scores but also STAI scores, anxiety disorders and gener- alized anxiety disorder in females, depression, and panic disor- der might share such common pathological mechanisms as to be explained as Qi-flowback. Qi-flowback in females was associated with high STAI scores, anxiety disorders, and generalized anxiety disorder. This result is considered because fear is included in the criteria of both Qi-flowback and generalized anxiety disorder. A gender difference was observed in the association between anxiety and Qi-blood-fluid patterns. In females, all the Qi- pat- terns i.e. Qi-deficiency, Qi-stagnation, and Qi-flowback were associated with high State anxiety scores, high Trait anxiety scores, whole anxiety disorder, or generalized anxiety disorder. In contrast, blood deficiency and fluid retention were not. In males, Qi-stagnation and Qi-flowback were not associated with anxiety. Instead, blood deficiency was associated with high State anxiety scores and generalized anxiety disorder. Espe- cially, only blood deficiency was associated with generalized anxiety disorder in males. Since anxiety is not included in Terasawa’s criteria for blood deficiency, blood deficiency would be difficult to be taken into account as a differential di- agnosis. In treating male patients with anxiety, resupply of not only Qi but also blood would be important. The extremely high association between eating disorders and fluid retention in females may be attributed to vomiting and edema resulting from hypoalimentation. Strong correlations of more than 0.4 were observed only be- tween Qi-deficiency and Qi-stagnation and among Qi-flowback, blood deficiency, and fluid retention in females. The strong correlation between Qi-deficiency and Qi-stagnation can be explained by the fact that both are elements of depression as mentioned above. Besides, since some KMI questions and chief complaints were assigned to plural kinds of Qi-blood-fluid patterns, the least common denominators were attributed to some strong correlations between Qi-blood-fluid patterns. For example, hypobulia and anorexia as chief complaints or in KMI were common between Qi-deficiency and Qi-stagnation. This commonality is supposed to account for the strong correlation between Qi-deficiency and Qi-stagnation. Higher correlations were also observed between Qi-defi- ciency and Qi-flowback in males, although there was only one common term. The comorbidity of Qi-deficiency and Qi-flow- back in the present study is directly in line with the previous report that rectification of Qi without supply of Qi, that is treatment for Qi-flowback without treatment for Qi-defi- ciency, may exacerbate gastrointestinal motor dysfunction due to Qi-flowback (Mori, 1998). Strong correlation coefficients were observed among Qi- flowback, blood deficiency, and fluid retention, although Qi-flowback and blood deficiency have no common terms among their diagnostic criteria. The comorbidity of these three can be explained as elements of panic disorder. Many symp- toms included in the criteria of panic disorder, i.e. numbness, diaphoresis, palpitation, dizziness, nausea, and chills belong to Qi-flowback, blood deficiency, or fluid retention. The pathol- ogy common to the basis of panic disorder may account for the strong correlations among Qi-flowback, blood deficiency, and fluid retention. When treating patients with atypical panic symptoms, diagnosis along the oriental longitudinal axes in addition to the occidental horizontal axes may be of assistance. Among Qi-blood-fluid patterns included in Terasawa’s Qi-blood-fluid scoring system, only blood-stagnation scores could not be calculated, since most of blood-stagnation score consists of physical examinations such as tenderness around the umbilicus. This is the limitation of the present study. A further investigation with physical examination is necessary, since 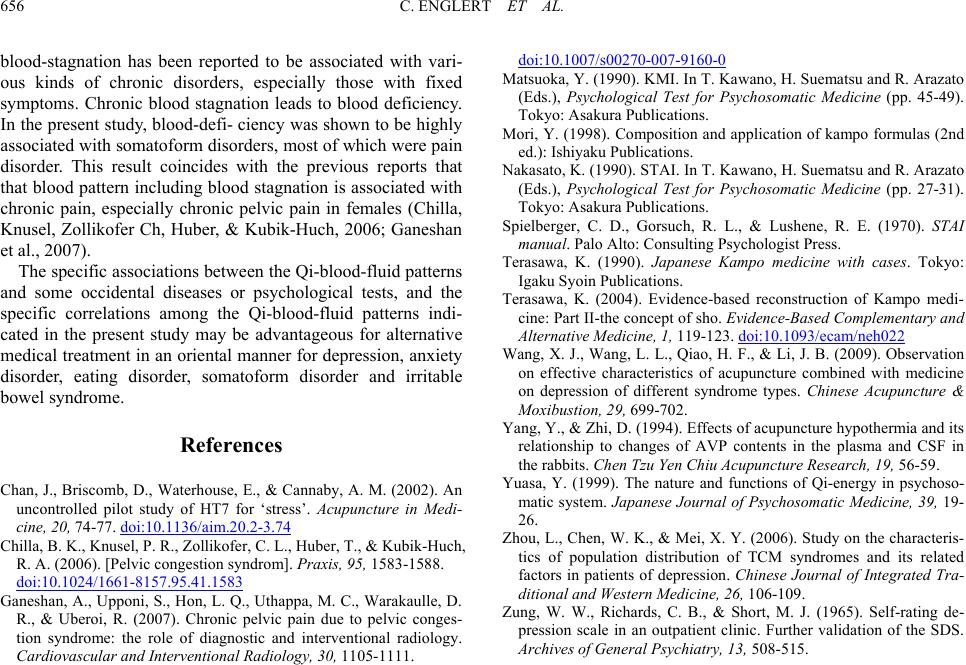 C. ENGLERT ET AL. 656 blood-stagnation has been reported to be associated with vari- ous kinds of chronic disorders, especially those with fixed symptoms. Chronic blood stagnation leads to blood deficiency. In the present study, blood-defi- ciency was shown to be highly associated with somatoform disorders, most of which were pain disorder. This result coincides with the previous reports that that blood pattern including blood stagnation is associated with chronic pain, especially chronic pelvic pain in females (Chilla, Knusel, Zollikofer Ch, Huber, & Kubik-Huch, 2006; Ganeshan et al., 2007). The specific associations between the Qi-blood-fluid patterns and some occidental diseases or psychological tests, and the specific correlations among the Qi-blood-fluid patterns indi- cated in the present study may be advantageous for alternative medical treatment in an oriental manner for depression, anxiety disorder, eating disorder, somatoform disorder and irritable bowel syndrome. References Chan, J., Briscomb, D., Waterhouse, E., & Cannaby, A. M. (2002). An uncontrolled pilot study of HT7 for ‘stress’. Acupuncture in Medi- cine, 20, 74-77. doi:10.1136/aim.20.2-3.74 Chilla, B. K., Knusel, P. R., Zollikofer, C. L., Huber, T., & Kubik-Huch, R. A. (2006). [Pelvic congestion syndrom]. P r ax is, 9 5, 1583-1588. doi:10.1024/1661-8157.95.41.1583 Ganeshan, A., Upponi, S., Hon, L. Q., Uthappa, M. C., Warakaulle, D. R., & Uberoi, R. (2007). Chronic pelvic pain due to pelvic conges- tion syndrome: the role of diagnostic and interventional radiology. Cardiovascular and Interven tio nal Radiology, 30, 1105-1111. doi:10.1007/s00270-007-9160-0 Matsuoka, Y. (1990). KMI. In T. Kawano, H. Suematsu and R. Arazato (Eds.), Psychological Test for Psychosomatic Medicine (pp. 45-49). Tokyo: Asakura Publications. Mori, Y. (1998). Composition and application of kampo formulas (2nd ed.): Ishiyaku Publications. Nakasato, K. (1990). STAI. In T. Kawano, H. Suematsu and R. Arazato (Eds.), Psychological Test for Psychosomatic Medicine (pp. 27-31). Tokyo: Asakura Publications. Spielberger, C. D., Gorsuch, R. L., & Lushene, R. E. (1970). STAI manual. Palo Alto: Consulting Psychologist Press. Terasawa, K. (1990). Japanese Kampo medicine with cases. Tokyo: Igaku Syoin Publications. Terasawa, K. (2004). Evidence-based reconstruction of Kampo medi- cine: Part II-the concept of sho. Evidence-Based Complementary and Alternative Medicine, 1, 119-123. doi:10.1093/ecam/neh022 Wang, X. J., Wang, L. L., Qiao, H. F., & Li, J. B. (2009). Observation on effective characteristics of acupuncture combined with medicine on depression of different syndrome types. Chinese Acupuncture & Moxibustion, 29, 699-702. Yang, Y., & Zhi, D. (1994). Effects of acupuncture hypothermia and its relationship to changes of AVP contents in the plasma and CSF in the rabbits. Chen Tzu Yen Chiu Acupuncture Research, 19, 56-59. Yuasa, Y. (1999). The nature and functions of Qi-energy in psychoso- matic system. Japanese Journal of Psychosomatic Medicine, 39, 19- 26. Zhou, L., Chen, W. K., & Mei, X. Y. (2006). Study on the characteris- tics of population distribution of TCM syndromes and its related factors in patients of depression. Chinese Journal of Integrated Tra- ditional and Western Medicine, 26, 106-109. Zung, W. W., Richards, C. B., & Short, M. J. (1965). Self-rating de- pression scale in an outpatient clinic. Further validation of the SDS. Archives of General Psychiatry, 13, 508-515. 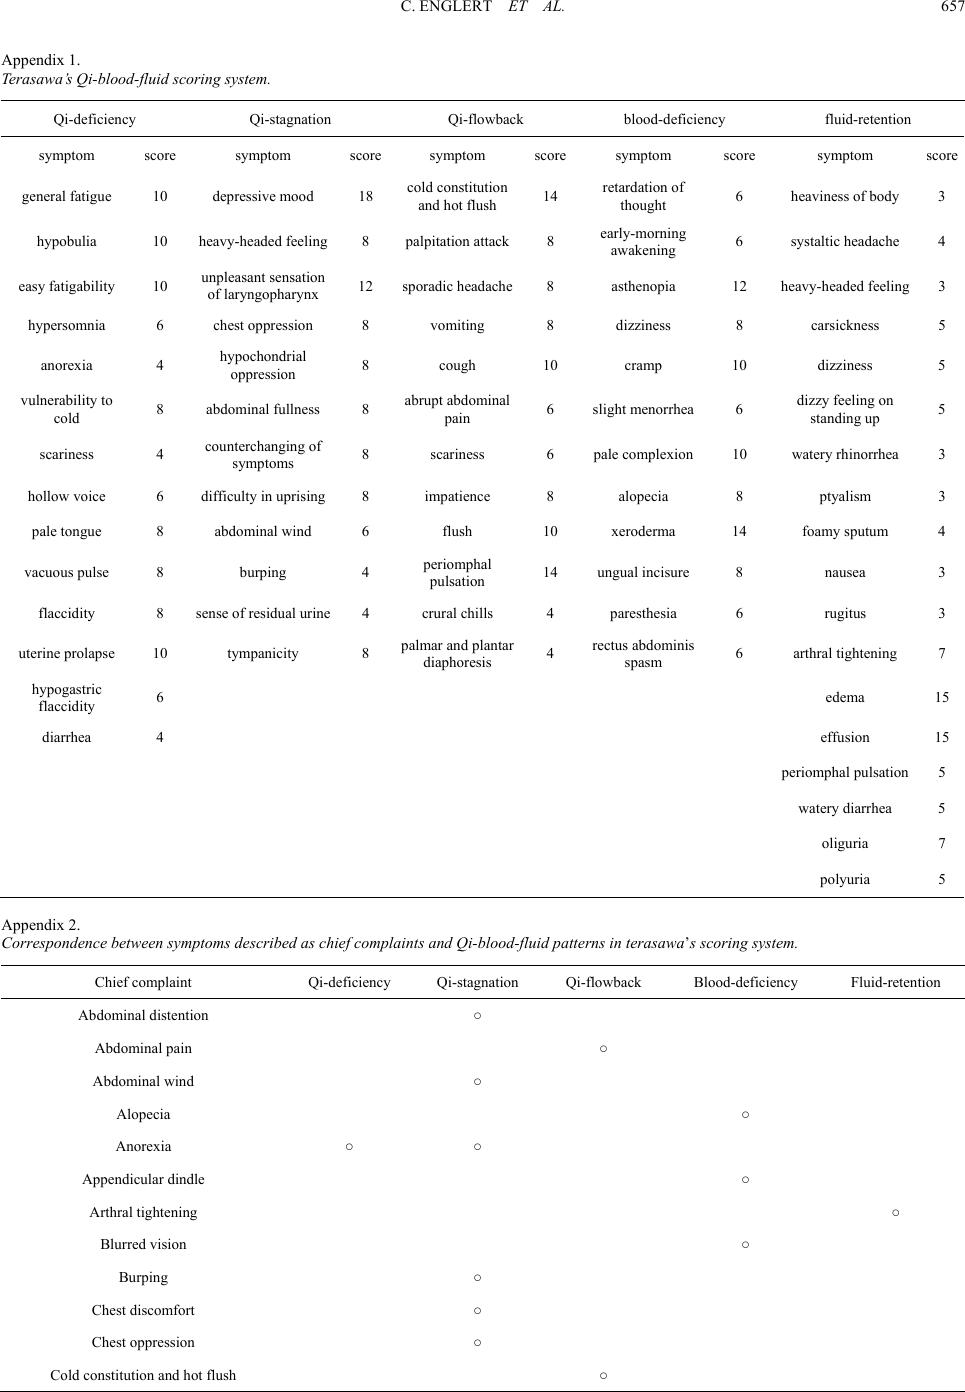 C. ENGLERT ET AL. 657 Appendix 1. Terasawa’s Qi-blood-fluid scoring system. Qi-deficiency Qi-stagnation Qi-flowback blood-deficiency fluid-retention symptom score symptom scoresymptom scoresymptom score symptom score general fatigue 10 depressive mood 18 cold constitution and hot flush 14 retardation of thought 6 heaviness of body 3 hypobulia 10 heavy-headed feeling 8 palpitation attack8 early-morning awakening 6 systaltic headache 4 easy fatigability 10 unpleasant sensation of laryngopharynx 12 sporadic headache8 asthenopia 12 heavy-headed feeling3 hypersomnia 6 chest oppression 8 vomiting 8 dizziness 8 carsickness 5 anorexia 4 hypochondrial oppression 8 cough 10 cramp 10 dizziness 5 vulnerability to cold 8 abdominal fullness 8 abrupt abdominal pain 6 slight menorrhea6 dizzy feeling on standing up 5 scariness 4 counterchanging of symptoms 8 scariness 6 pale complexion 10 watery rhinorrhea 3 hollow voice 6 difficulty in uprising 8 impatience 8 alopecia 8 ptyalism 3 pale tongue 8 abdominal wind 6 flush 10 xeroderma 14 foamy sputum 4 vacuous pulse 8 burping 4 periomphal pulsation 14 ungual incisure 8 nausea 3 flaccidity 8 sense of residual urine 4 crural chills 4 paresthesia 6 rugitus 3 uterine prolapse 10 tympanicity 8 palmar and plantar diaphoresis 4 rectus abdominis spasm 6 arthral tightening 7 hypogastric flaccidity 6 edema 15 diarrhea 4 effusion 15 periomphal pulsation5 watery diarrhea 5 oliguria 7 polyuria 5 Appendix 2. Correspondence bet w e en symptoms described as chief complai nt s and Qi-blood-fluid patter ns in t er as aw a’s scoring system. Chief complaint Qi-deficiency Qi-stagnation Qi-flowback Blood-deficiency Fluid-retention Abdominal distention ○ Abdominal pain ○ Abdominal wind ○ Alopecia ○ Anorexia ○ ○ Appendicular dindle ○ Arthral tightening ○ Blurred vision ○ Burping ○ Chest discomfort ○ Chest oppression ○ Cold constitution and hot flush ○ 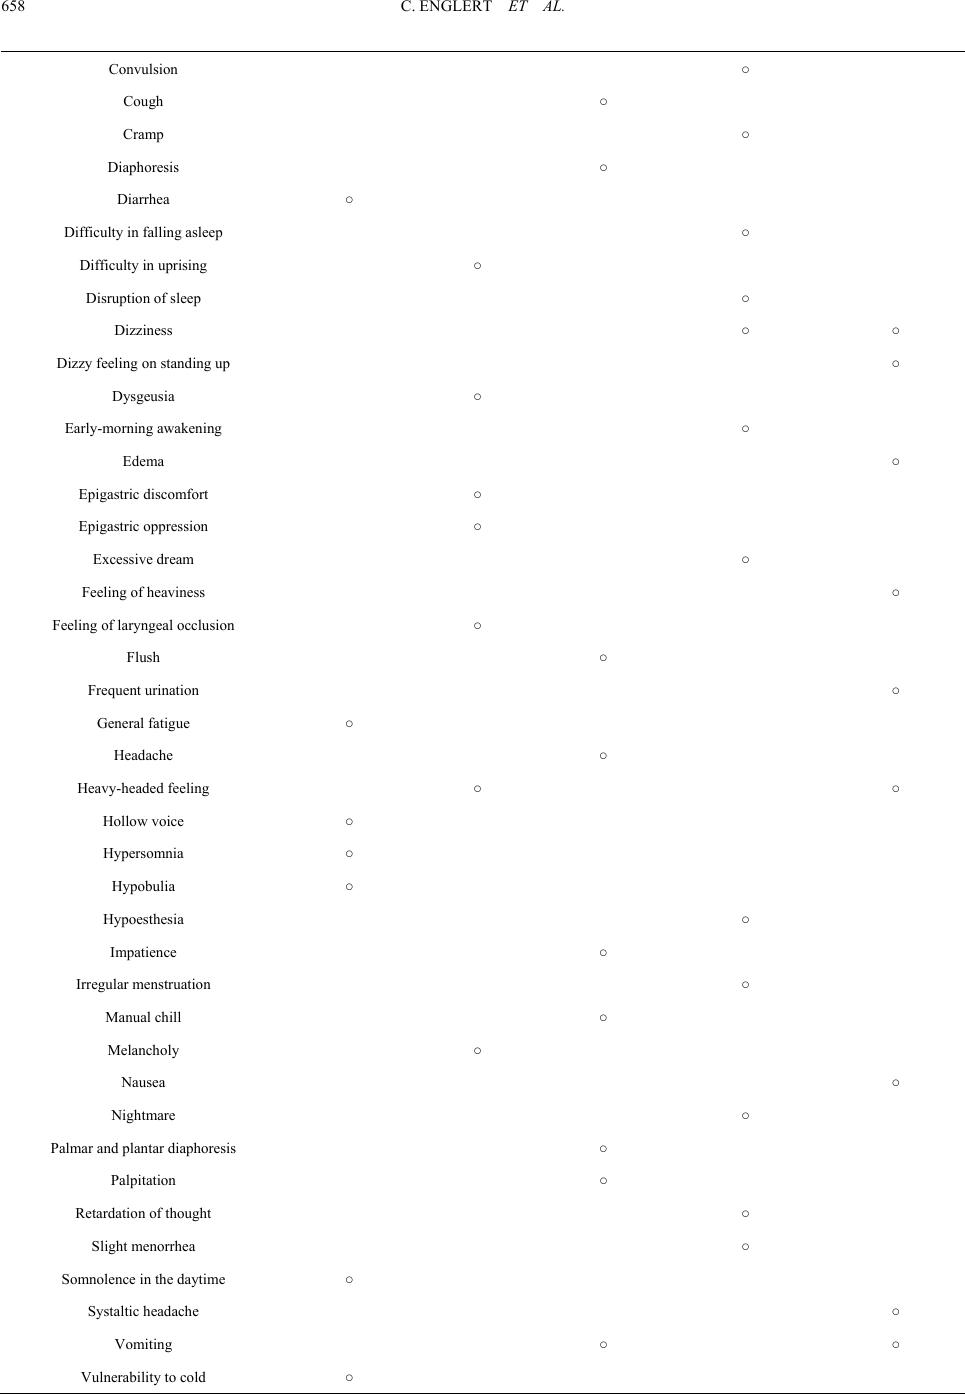 C. ENGLERT ET AL. 658 Convulsion ○ Cough ○ Cramp ○ Diaphoresis ○ Diarrhea ○ Difficulty in falling asleep ○ Difficulty in uprising ○ Disruption of sleep ○ Dizziness ○ ○ Dizzy feeling on standing up ○ Dysgeusia ○ Early-morning awakening ○ Edema ○ Epigastric discomfort ○ Epigastric oppression ○ Excessive dream ○ Feeling of heaviness ○ Feeling of laryngeal occlusion ○ Flush ○ Frequent urination ○ General fatigue ○ Headache ○ Heavy-headed feeling ○ ○ Hollow voice ○ Hypersomnia ○ Hypobulia ○ Hypoesthesia ○ Impatience ○ Irregular menstruation ○ Manual chill ○ Melancholy ○ Nausea ○ Nightmare ○ Palmar and plantar diaphoresis ○ Palpitation ○ Retardation of thought ○ Slight menorrhea ○ Somnolence in the daytime ○ Systaltic headache ○ Vomiting ○ ○ Vulnerability to cold ○ 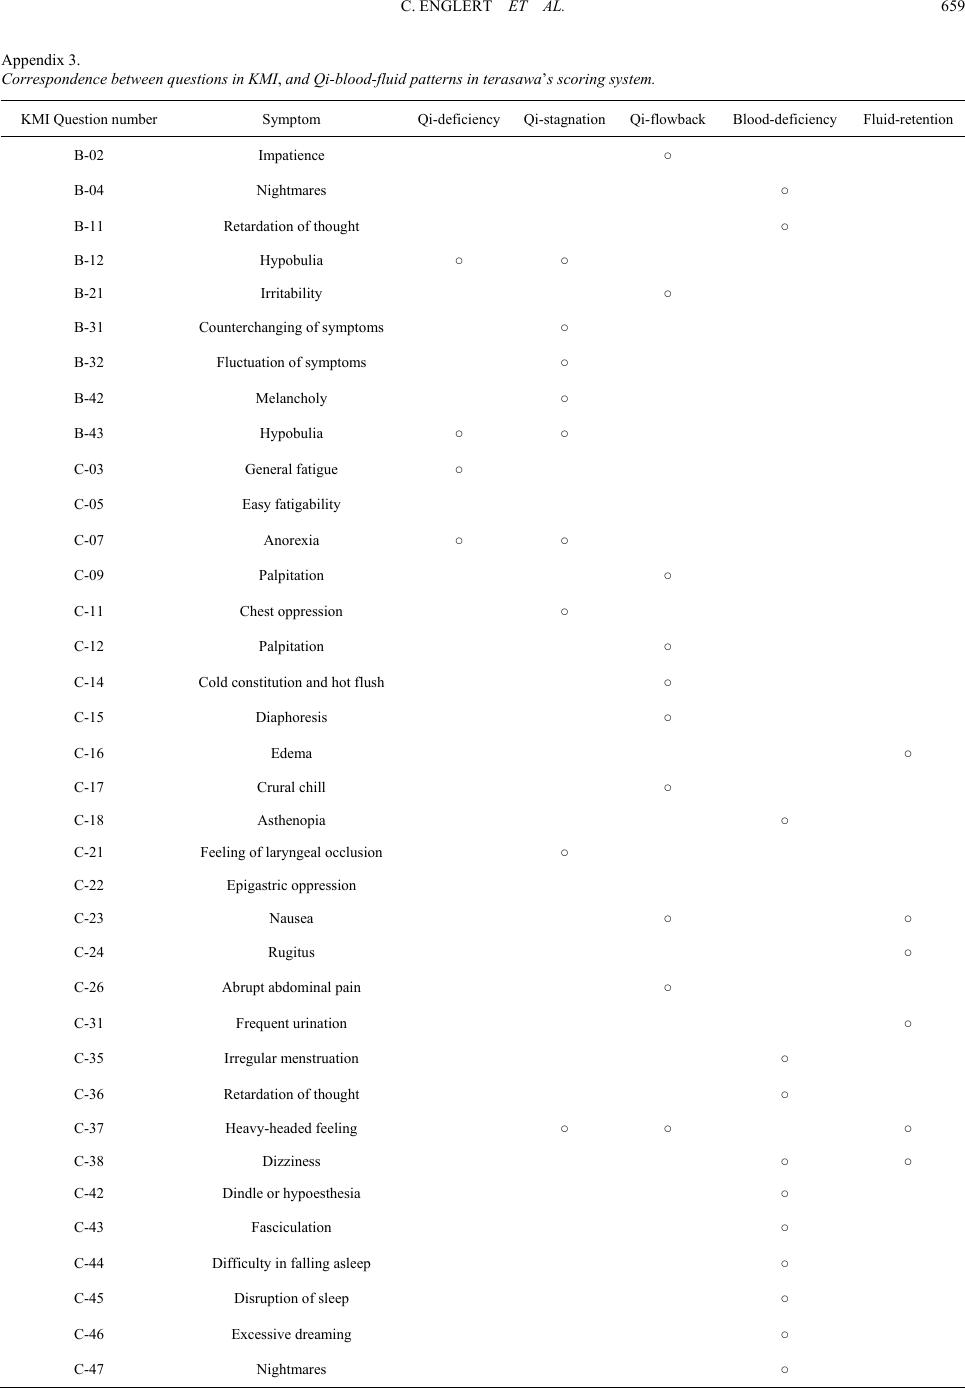 C. ENGLERT ET AL. 659 Appendix 3. Correspondence betwe e n q u e st i o n s i n KM I, and Qi-blood-fluid patterns i n ter asa wa’s scoring system. KMI Question number Symptom Qi-deficiencyQi-stagnationQi-flowbackBlood-deficiency Fluid-retention B-02 Impatience ○ B-04 Nightmares ○ B-11 Retardation of thought ○ B-12 Hypobulia ○ ○ B-21 Irritability ○ B-31 Counterchanging of symptoms ○ B-32 Fluctuation of symptoms ○ B-42 Melancholy ○ B-43 Hypobulia ○ ○ C-03 General fatigue ○ C-05 Easy fatigability C-07 Anorexia ○ ○ C-09 Palpitation ○ C-11 Chest oppression ○ C-12 Palpitation ○ C-14 Cold constitution and hot flush ○ C-15 Diaphoresis ○ C-16 Edema ○ C-17 Crural chill ○ C-18 Asthenopia ○ C-21 Feeling of laryngeal occlusion ○ C-22 Epigastric oppression C-23 Nausea ○ ○ C-24 Rugitus ○ C-26 Abrupt abdominal pain ○ C-31 Frequent urination ○ C-35 Irregular menstruation ○ C-36 Retardation of thought ○ C-37 Heavy-headed feeling ○ ○ ○ C-38 Dizziness ○ ○ C-42 Dindle or hypoesthesia ○ C-43 Fasciculation ○ C-44 Difficulty in falling asleep ○ C-45 Disruption of sleep ○ C-46 Excessive dreaming ○ C-47 Nightmares ○
|