D. Kiliç et al. / Health 3 (2011) 602-608
Copyright © 2011 SciRes. Openly accessible at http://www.scirp.org/journal/HEALTH/
607607
tude towards Old People Scale is high.
The total scores obtained from Kogan’s Attitude to-
wards Old People Scale, after distinctiveness validity
analysis, went from low to high. After listing was com-
plete, 27% of the lower group, and 27% of the upper
group was taken. The t-test was used to identify whether
or not every item in the scale illustrated distinctiveness
between the two groups. The t-values relating to every
item and total score gained significance at a significance
level of p < 0.05. This helps to distinguish high and low
levels of attitude towards older people depending on the
total score and the individual scores of the 26 items of
Kogan’s Attitude towards Old People Scale.
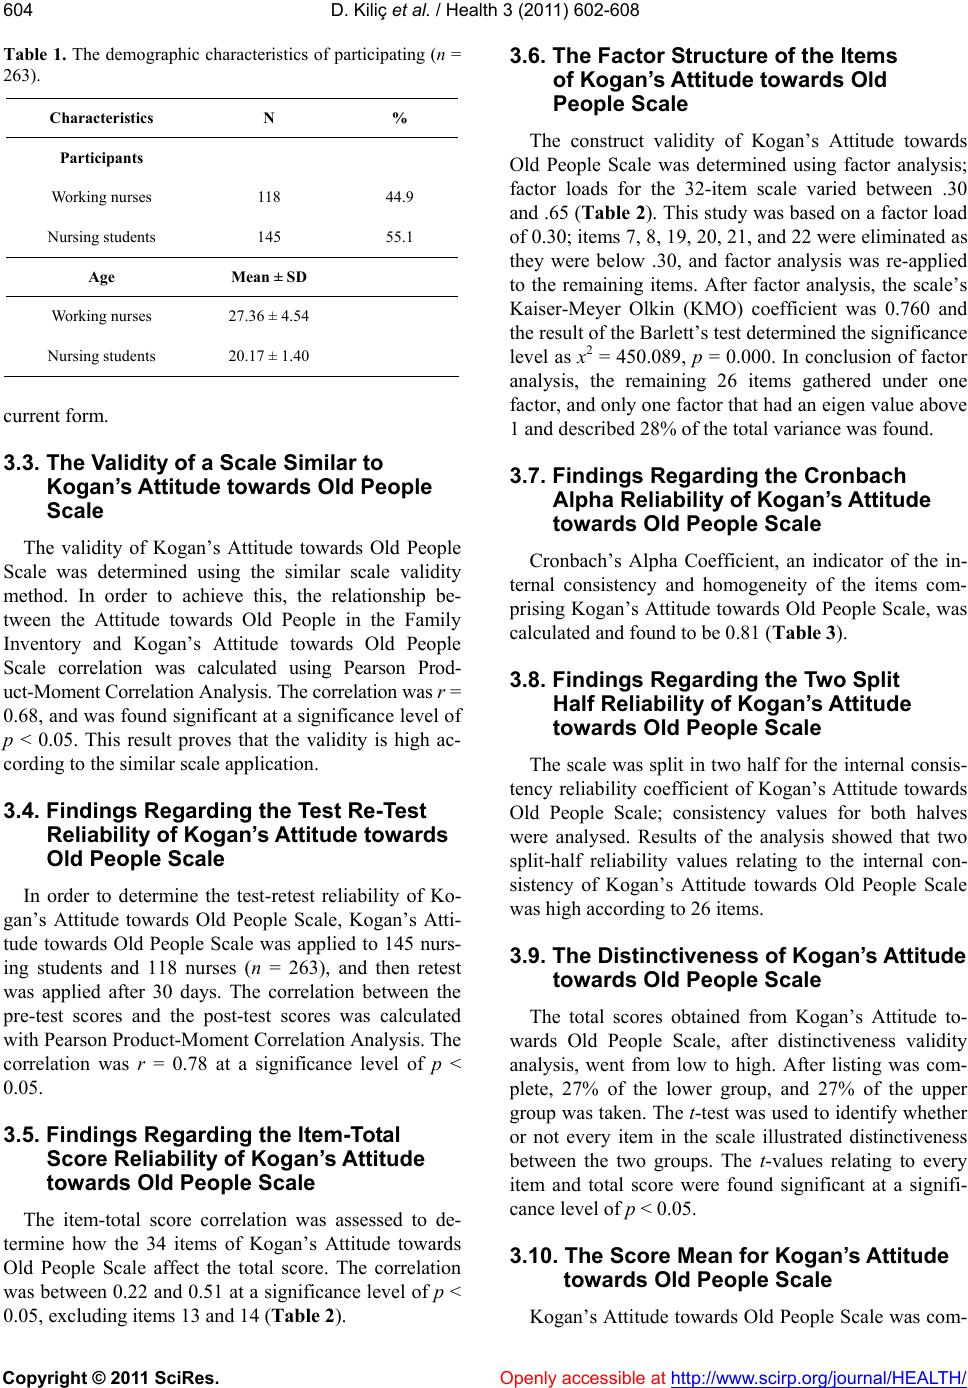
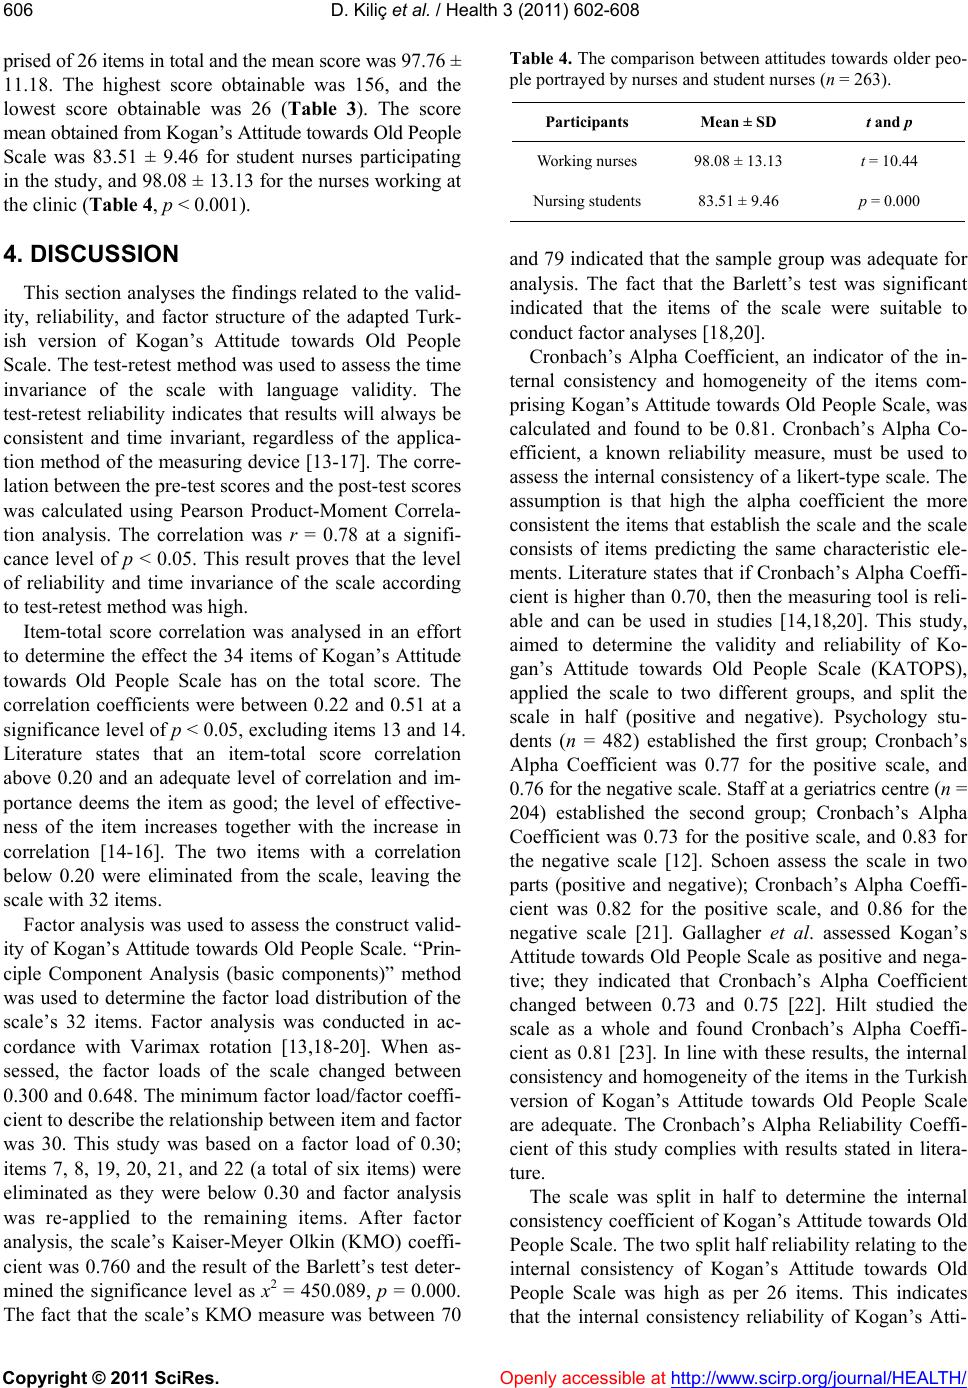
Kogan’s Attitude towards Old People Scale was com-
prised of 26 items and the mean score was 97.76 ± 11.18.
This indicates that those participating in the study have a
positive attitude towards older people. The attitude of
working nurses towards older people was more positive
in comparison to the attitude of student nurses. In an-
other study, first-year nurses had more negatives thoughts
about older people in comparison to working nurses [24].
The many studies conducted on the subject indicate that
nurses working in clinics have a more positive attitude
towards older people [9-11]. The results of this study
support those stated in literature.
That the reliability and validity of Kogan’s Attitude
towards Old People Scale was made on only nurses is
the limitation of study.
5. CONCLUSIONS
In conclusion of this methodological study, we deter-
mined that Kogan’s Attitude towards Old People Scale
had one factor, and its Cronbach Alpha Coefficient was
0.81. The results of statistical analysis proved that the
scale was valid and reliable, and could be used on Turk-
ish society. The Turkish version of Kogan’s Attitude
towards Old People Scale, tested for validity and reli-
ability, comprised of 26 items and its mean score was
97.76. Working nurses displayed a more positive attitude
towards older people in comparison to student nurses. It
is suggested that broader groups are used to represent
various socio-economic levels in assess the invariance of
Kogan’s Attitude towards Old People Scale in future
studies.
REFERENCES
[1] Population Reference Bureau, World Population Data
Sheet (2011).
http://www.prb.org/pdf10/10wpds_eng.pdf
[2] Turkish Statistical Institute (2011) The Database of an
address-based population registry system; population
according to age group and gender.
http://tuikapp.tuik.gov.tr/adnksdagitapp/adnks.zul.pdf
[3] Hacettepe University Institute of Population Studies
(2009) A Turkish Population and Health Study 2008,
Hacettepe University Institute of Population Studies,
Ministry of Health Maternal and Infant Health and Fam-
ily Planning Directorate, Prime Ministry State Planning
Secretariat, and TÜBITAK, Ankara.
[4] Akın, B., Seviğ, Ü. and Karataş, N. (2001) Gerontology
nursing training in Turkey. A study to develop a certifi-
cate-based program. Cumhuriyet University HYO Jour-
nal, 5, 33-39.
[5] Burns, R. and Nickols, L.O. (2000) Interdisiplinary geri-
atric primary care evaluation and management: Two-year
outcomes. Journal of the American Geriatrics Society, 48,
8-13.
[6] Caplan, G.A., Williams, A.J. and Abraham, K. (2004) A
Randomized control trial of comprehensive geriatric as-
sesment and multidisiplinary intervention after discharge
of elderly from the emergency department. Journal of the
American Geriatrics Society, 52, 1417-1423.
doi:10.1111/j.1532-5415.2004.52401.x
[7] Akdemir, N., Çınar, F.İ. and Görgülü, Ü. (2007) Perceiv-
ing old age and geriatric discrimination. Turkish Journal
of Geriatrics, 10, 215-222.
[8] Öz, F. (2002) The last stage of life, reviewing old age
from a psychosocial point of view. Crisis Journal, 10,
17-28.
[9] Brower, T. (1985) Do nurses stereotype the aged? Jour-
nal of Gerontological Nursing, 11, 17-28.
[10] Lookinland, S., Linton, C.P. and Lavender, C. (2002)
African-American nurses attitudes toward older persons.
The Journal of National Black Nurses Association, 13,
6-14.
[11] Mellor, P., Chew, D. and Greenhill, J. (2007) Nurses
attitudes toward elderly people and knowledge of geron-
tic care in a multipurpose health service. Australian
Journal of Advanced Nursing, 24, 37-41.
[12] Kogan, N. (1961) Attitudes toward old people: The de-
velopment of a scale and an examination of correlations.
Journal of Abnormal and Social Psychology, 62, 44-54.
doi:10.1037/h0048053
[13] Tezbaşaran, A. (1996) The guide to developing Likert-
type scales. The Association of Turkish Psychologists
Publications, Özyurt Matbaası, Ankara, 45-51.
[14] Özgüven, I.E. (1998) Psychological tests. Nobel Yayın-
cılık, Ankara, 83-108.
[15] Büyüköztürk, Ş. (2006) The data analysis handbook for
social sciences. Pegem Yayıncılık, Ankara.
[16] Gözüm, S. and Aksayan, S. (2002) Guide II for in-
ter-culture scale adaptations: Pyschometric characteris-
tics and intercultural comparisons. Nursing Research and
Development Magazine, 4, 9-20.
[17] Erefe, İ. (2002). Nursing study principles, procedures,
and methods. Odak Ofset, İstanbul, 172-173.
[18] Akgül, A. (2003) Statistical Analysis Techniques used in
Medical Studies. 2nd Edition, Emek Ofset Ltd. Şti., An-
kara.
[19] Aksakoğlu, G. (2001) Study Techniques in health, and
analysis methods. Dokuz Eylül University Rektörlük
Matbaası, İzmir.
[20] Tavşancıl, E. (2002) Measuring attitudes and data analy-
sis using SPSS. Nobel Yayın Dağıtım, Ankara.
[21] Schoen, D. (1993) Nursing students attitudes after an