K. Yoshino et al. / Health 3 (2011) 553-55 6
Copyright © 2011 SciRes. Openly accessible at http://www.scirp.org/journal/HEALTH/
554
dominance during subsequent sleep. Bacon et al. [8]
reported the significant association of high levels of
negative emotions (anger, stress, and sadness) with de-
creases in LF and HF powers, but higher levels of posi-
tive emotion with increases in LF power in patients with
coronary artery disease. Schwerdtfeger et al. [9] showed
that depression was related to higher heart rate through-
out the day. Moreover, there was a tendency toward
lower HRV in individuals with higher depression scores,
and this association was moderated by social context.
However, to our knowledge, no studies have investi-
gated the relationship between HRV indices and various
moods including vigor in normal subjects during daily
life. In this study, we analyzed the correlation between
four HRV indices and eight moods including vigor in
normal male subjects during daily life.
2. METHODS
Normal healthy male subjects (N = 40, age: 20 to 39
years) participated in this experiment. None of the sub-
jects had a history of cardiovascular, respiratory, or brain
disease and none were currently using any medications.
All subjects provided their informed written consent as
approved by the Ethical Committee on Human Research
at National Institute of Advanced Industrial Science and
Technology. Subjects intermittently wore an ambulatory
device Active tracer (AC-301, GMS, Japan) in a pouch
at the waist for a total of 48 to 72 hours during daily life,
including sleep, except when taking a bath or shower.
This device records the RR-intervals of the electrocar-
diogram and body acceleration.
Every hour that the subjects were awake they regis-
tered their current mood on a 100-mm-long Visual Ana-
logue Scale (VAS) questionnaire on which the end-
points were labeled “lowest” and “highest”. The ques-
tionnaire scales eight of the subjects’ current moods:
happiness, tension, fatigue, worry, depression, anger,
vigor, and confusion. We instructed subjects not to an-
swer the questionnaire more than 15 minutes after the
predetermined time, and we strictly prohibited subjects
from recalling a past mood when answering the ques-
tionnaire.
The following four HRV indices 1) to 4) were calcu-
lated from RR-interval sequence data collected during
10 min before answering the VAS questionnaires if at
least 96% of 10-min RR-interval records were within
valid range (0.3 - 2.0 sec). The RR-intervals out of this
range were omitted from the analysis. If the mean body
acceleration in the 10-min exceeded 30 mG, the corre-
sponding RR-interval data were excluded from the
analysis in order to exclude the effect of body movement.
It has been reported that 157.5 mG is the optimum value
of threshold to discriminate activity state and rest by
body acceleration [10]. We used the value 30 mG which
is five times smaller than it in this study. The inter-indi-
vidual mean excluded ratio was 47.2% ± 12.5%, and
there was no significant difference between before and
after noon.
1) Heart rate (HR) and 2) root mean square of succes-
sive differences (RMSSD) of RR-interval sequence were
calculated for each 10-min data set. HR takes low values
and RMSSD takes high values when the balance of
autonomic nervous system activity (sympathovagal bal-
ance) shifts toward parasympathetic dominance.
The following frequency analysis was performed in
addition to the time domain analysis. The power spec-
trum was calculated by applying a fast Fourier transform
(FFT) to the RR-interval signal for each 10-min data set.
The area (i.e., power) of high-frequency components
(HF: 0.15 to 0.4 Hz) of the power spectrum was divided
by the total power from which the very-low-frequency
component (VLF: <0.04 Hz) had been subtracted in or-
der to calculate (3) the normalized HF power (HFnu),
which takes higher values when the sympathovagal bal-
ance shifts toward parasympathetic dominance. 4) Mean
frequency in HF band of the power spectrum (MFHF)
were calculated. MFHF is related to respiratory fre-
quency.
To reduce inter-individual variability, we normalized
the measured values of mood level and HRV indices by
dividing by their amplitudes (maximum-minimum in
measurement) after subtracting their minimum values for
each subject. Moreover, to reduce the effect of circadian
rhythm, the differences of the normalized values of
mood level and HRVI indices on the second or third day
from those at the same time of the first (reference) day
(denoted as ∆mood and ∆HRVI) were calculated for
each subject.
Before applying the correlation analysis, we con-
firmed that the inter-individual differences of ∆mood
and ∆HRVI variations were not relatively high. This was
done by comparing the inter-individual means and stan-
dard deviations of ∆mood and ∆HRVI variations. Fol-
lowing the confirmation, Pearson’s correlation coeffi-
cients between eight ∆moods and four ∆HRVIs were
calculated.
3. RESULTS
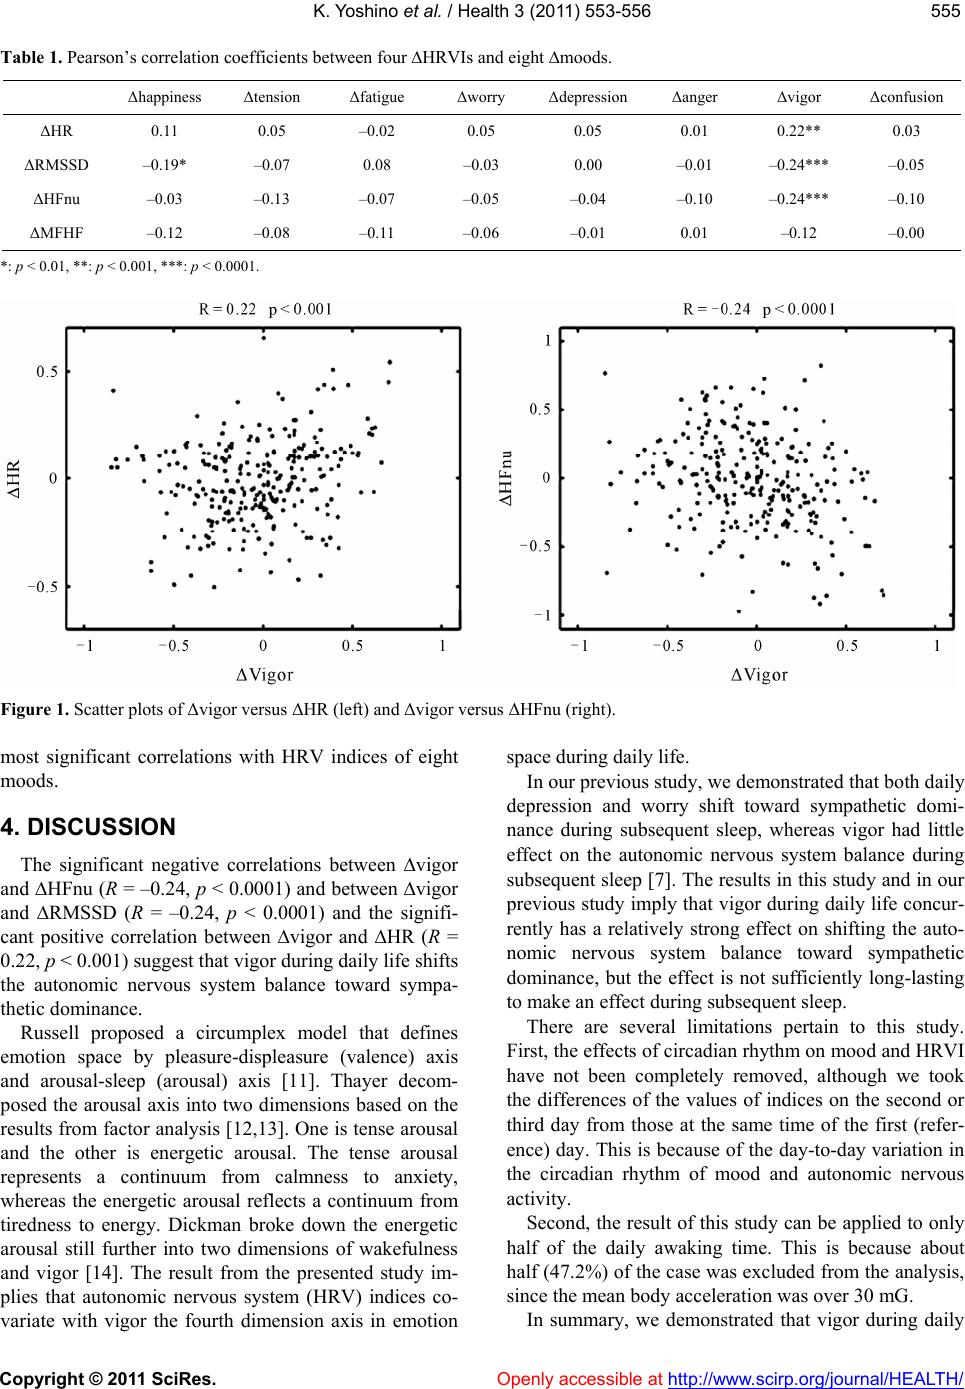
The comparison results are summarized in Table 1.
The most three highly correlated combinations were
∆vigor and ∆HFnu (R = –0.24, p < 0.0001) (Figure 1
right), ∆vigor and ∆RMSSD (R = –0.24, p < 0.0001),
and ∆vigor and ∆HR (R = 0.22, p < 0.001) (Figure 1
left). There were three combinations whose p-values
were less than 0.001 (Table 1). All of them were com-
binations with ∆vigor. This indicates that vigor has the