Paper Menu >>
Journal Menu >>
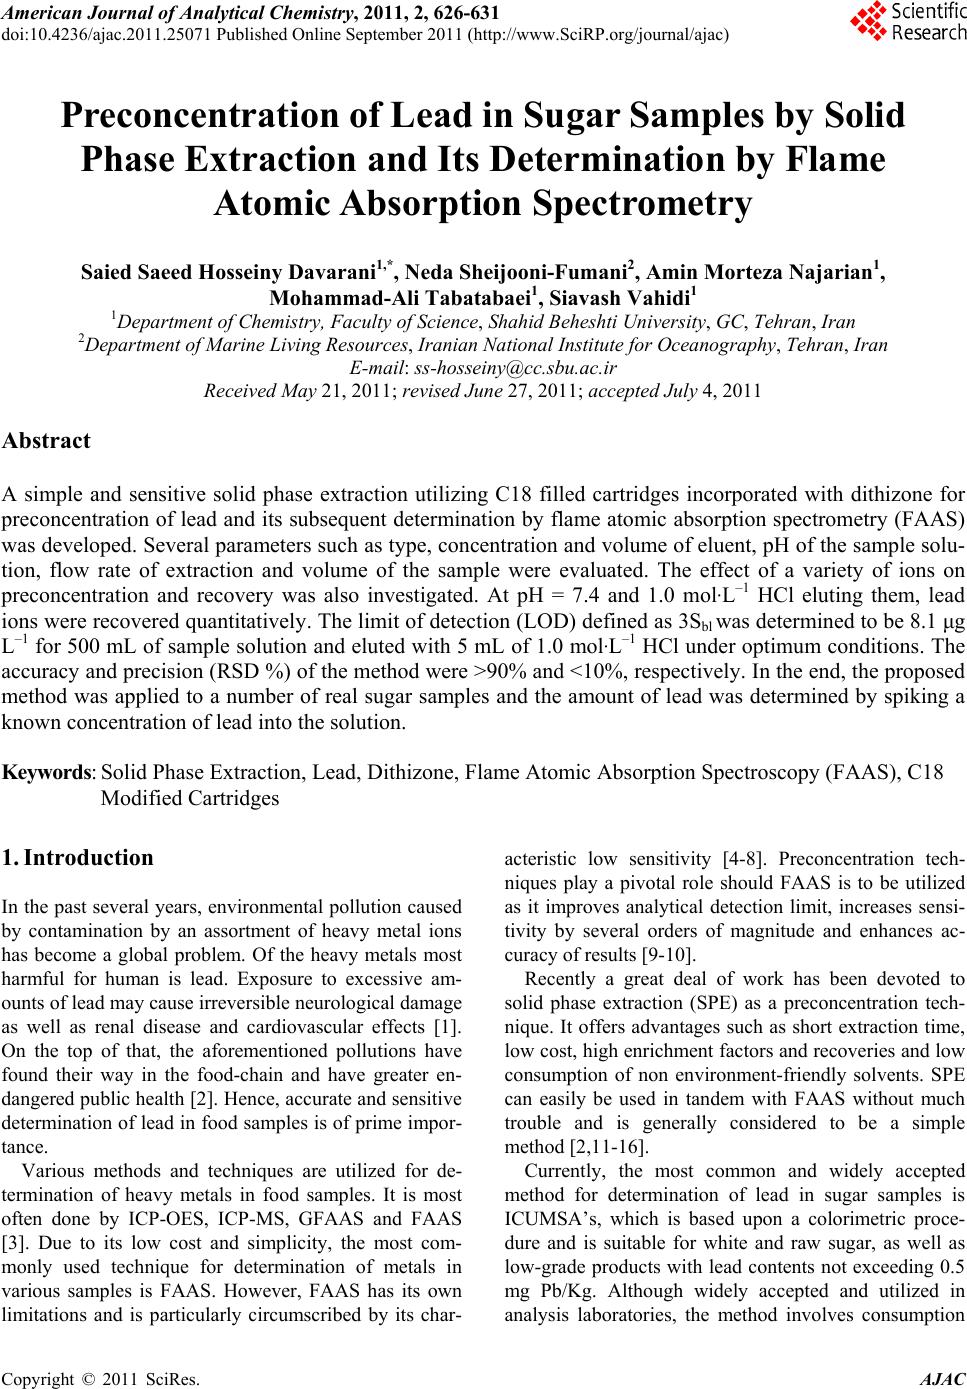 American Journal of Anal yt ical Chemistry, 2011, 2, 626-631 doi:10.4236/ajac.2011.25071 Published Online September 2011 (http://www.SciRP.org/journal/ajac) Copyright © 2011 SciRes. AJAC Preconcentration of Lead in Sugar Samples by Solid Phase Extraction and Its Determination by Flame Atomic Absorption Spectrometry Saied Saeed Hosseiny Davarani1,*, Neda Sheijooni-Fumani2, Amin Morteza Najarian1, Mohammad-Ali Tabatabaei1, Siavash Vahidi1 1Department of Chemistry, Faculty of Science, Shahid Beheshti University, GC, Tehran, Iran 2Department of Marine Living Resources, Iranian National In stitute for Oceanography, Tehran, Iran E-mail: ss-hosseiny@cc.sbu.ac.ir Received May 21, 2011; revised June 27, 2011; accepted July 4, 2011 Abstract A simple and sensitive solid phase extraction utilizing C18 filled cartridges incorporated with dithizone for preconcentration of lead and its subsequent determination by flame atomic absorption spectrometry (FAAS) was developed. Several parameters such as type, concentration and volume of eluent, pH of the sample solu- tion, flow rate of extraction and volume of the sample were evaluated. The effect of a variety of ions on preconcentration and recovery was also investigated. At pH = 7.4 and 1.0 mol·L–1 HCl eluting them, lead ions were recovered quantitatively. The limit of detection (LOD) defined as 3Sbl was determined to be 8.1 μg L–1 for 500 mL of sample solution and eluted with 5 mL of 1.0 mol·L–1 HCl under optimum conditions. The accuracy and precision (RSD %) of the method were >90% and <10%, respectively. In the end, the proposed method was applied to a number of real sugar samples and the amount of lead was determined by spiking a known concentration of lead into the solution. Keywords: Solid Phase Extraction, Lead, Dithizone, Flame Atomic Absorption Spectroscopy (FAAS), C18 Modified Cartridges 1. Introduction In the past several years, environmental pollution caused by contamination by an assortment of heavy metal ions has become a global problem. Of the heavy metals most harmful for human is lead. Exposure to excessive am- ounts of lead may cause irreversible neurological damage as well as renal disease and cardiovascular effects [1]. On the top of that, the aforementioned pollutions have found their way in the food-chain and have greater en- dangered public health [2]. Hence, accurate and sensitive determination of lead in food samples is of prime impor- tance. Various methods and techniques are utilized for de- termination of heavy metals in food samples. It is most often done by ICP-OES, ICP-MS, GFAAS and FAAS [3]. Due to its low cost and simplicity, the most com- monly used technique for determination of metals in various samples is FAAS. However, FAAS has its own limitations and is particularly circumscribed by its char- acteristic low sensitivity [4-8]. Preconcentration tech- niques play a pivotal role should FAAS is to be utilized as it improves analytical detection limit, increases sensi- tivity by several orders of magnitude and enhances ac- curacy of results [9-10]. Recently a great deal of work has been devoted to solid phase extraction (SPE) as a preconcentration tech- nique. It offers advantages such as short extraction time, low cost, high enrichment factors and recoveries and low consumption of non environment-friendly solvents. SPE can easily be used in tandem with FAAS without much trouble and is generally considered to be a simple method [2,11-16]. Currently, the most common and widely accepted method for determination of lead in sugar samples is ICUMSA’s, which is based upon a colorimetric proce- dure and is suitable for white and raw sugar, as well as low-grade products with lead contents not exceeding 0.5 mg Pb/Kg. Although widely accepted and utilized in analysis laboratories, the method involves consumption  S. S. H. DAVARANI ET AL. 627 of considerable amounts of highly toxic and dangerous potassium cyanide and perchloric acid. It also consists of procedures that require highly skilled operators. The shortcomings of the current methods and FAAS along with the ever decreasing allowable amount of lead in food products prepare the grounds to develop other methods for determination of lead in sugar samples [12]. The most pivotal step in SPE is considered to be choo- sing the sorbent material as it gives the method its char- acteristic properties such as selectivity and capacity to- wards various metal ions. C18 filled cartridges are still widely used as a sorbent. However, due to its limited ability to absorb metal ions quantitatively at trace and ultra-trace levels, its surface is treated with chelating agents. Besides having the appropriate chelating proper- ties to bond, dithizone has proved to be highly selective towards lead. It also offers high capacity and sensitivity [13,14] and is used for modification of sorbent in this work. The objective of this paper is to prepare dithizone modified C18 SPE cartridges and investigate its ability to absorb lead by means of FAAS. Despite the fact that rival methods utilizing inductively coupled plasma (ICP) and electrothermal (ET) sample introduction yield slightly better detection limits, this method offers advantages such as simplicity, low cost as well as ease of operation in comparison with those mentioned above. Conditions such as pH, eluent volume, concentration, flow rate of elution, and sample volume were optimized. Finally, the amount of lead in real sugar samples is determined. 2. Experimental 2.1. Apparatus Concentration of Pb(II) ions were determined by an AA- 680 Shimadzu (Kyoto, Japan) flame atomic absorption spectrometer (FAAS) in an air-acetylene flame, accord- ing to the user’s manual provided by the manufacturer. A lead Hollow cathode lamp was used as the radiation source with wavelength set at 217.0 nm. pH adjustments were carried out by a Metrohm model-627 (Herisau, Switzerland) pH-Meter. Sep-Pak C18 cartridges pro- duced by Waters (USA, Florida) containing 500 mg of octadecylsilane served as solid phase and a Rocker 600 (Todays, Taiwan) was also utilized in the process. 2.2. Reagents and Materials All reagents were of the analytical-reagent grade. The stock standard solution (1.000 g·L–1) of Pb2+ was ob- tained from E. Merck (Darmstadt, Germany) and was diluted with deionized water. A 50 g·L–1 solution of lead was prepared and working standard solutions of lead were prepared by diluting a proper amount of the afore- mentioned solution. Dithizone was dissolved in chloro- form; both reagents were purchased from E. Merck (Darmstadt, Germany). 1.0 mol·L–1 solution of HCl was prepared by appropriate dilution of stock solution of concentrated hydrochloric acid in deionized water. Buffer solutions with different pH were prepared by dis- solving appropriate amounts of suitable salts salt pur- chased from E. Merck (Darmstadt, Germany) and Fluka (Switzerland) in deionized water. Sugar was acquired from the grand market of Tehran. 2.3. Cartridge Modification Each cartridge was washed with 5 mL of ethanol, 10 mL of water followed by 5 mL of 1.0 mol·L–1 HCl and then another 10 mL of deionized water in order to remove all the potential contaminants as a result of the manufactur- ing process. The cartridge was then dried by passing air through it for a few minutes. 2.0 mL of dithizone solu- tion (1000 mg·L–1 in chloroform) was left in the cartridge and allowed to penetrate inside the pores of the solid phase. The solvent was allowed to evaporate at 60˚C for 30 minutes. Subsequently, air was passed through the cartridge for a several minutes to ensure that it is thor- oughly dried. 2.4. General Procedure The extraction process was carried out by passing solu- tions containing Pb2+ ions through the cartridge. Back- extraction was done by eluting the cartridge with 5.0 mL of 1.0 mol·L–1·HCl. At the end, the lead content of the samples were determined by FAAS. 2.5. Application to Sugar Samples 50.000 grams of sugar was dissolved in 500 mL of am- monium acetate solution (pH = 7.4). Solid phase extrac- tions were performed on the samples by passing the so- lution through the modified cartridge. Back-extractions were performed by eluting the lead content by 5.0 mL of 1.0 mol·L–1·HCl. 3. Results and Discussion 3.1. Adsorption Properties of Cartridge and Ligand Solutions of known concentration of lead were passed through the column which contained only C18. The re- sults indicated that less than 5% of Pb2+ ions were re- Copyright © 2011 SciRes. AJAC 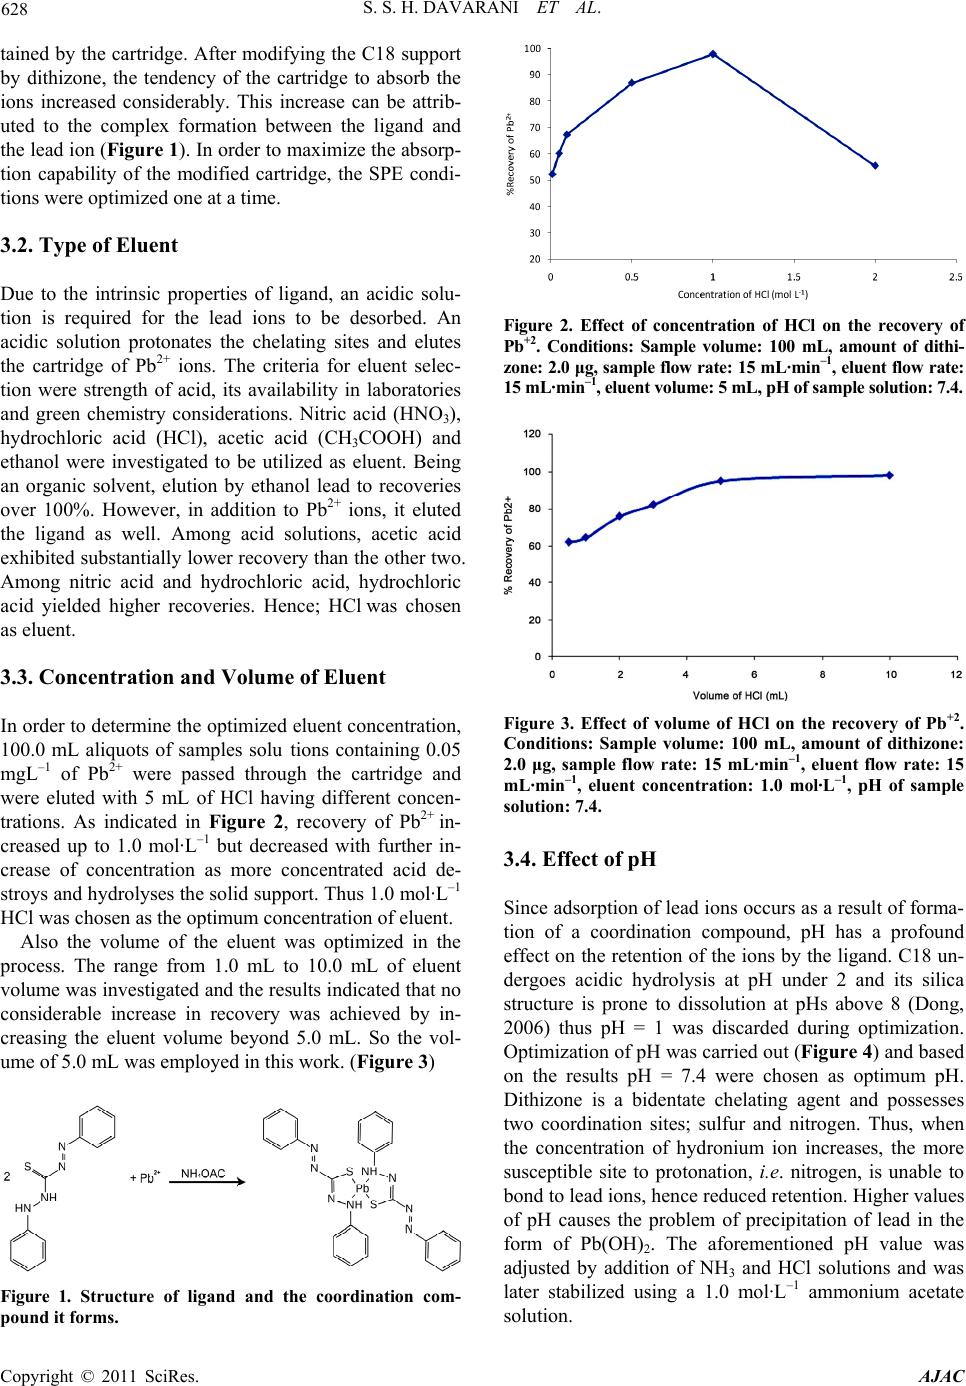 628 S. S. H. DAVARANI ET AL. tained by the cartridge. After modifying the C18 support by dithizone, the tendency of the cartridge to absorb the ions increased considerably. This increase can be attrib- uted to the complex formation between the ligand and the lead ion (Figure 1). In order to maximize the absorp- tion capability of the modified cartridge, the SPE condi- tions were optimized one at a time. 3.2. Type of Eluent Due to the intrinsic properties of ligand, an acidic solu- tion is required for the lead ions to be desorbed. An acidic solution protonates the chelating sites and elutes the cartridge of Pb2+ ions. The criteria for eluent selec- tion were strength of acid, its availability in laboratories and green chemistry considerations. Nitric acid (HNO3), hydrochloric acid (HCl), acetic acid (CH3COOH) and ethanol were investigated to be utilized as eluent. Being an organic solvent, elution by ethanol lead to recoveries over 100%. However, in addition to Pb2+ ions, it eluted the ligand as well. Among acid solutions, acetic acid exhibited substantially lower recovery than the other two. Among nitric acid and hydrochloric acid, hydrochloric acid yielded higher recoveries. Hence; HCl was chosen as eluent. 3.3. Concentration and Volume of Eluent In order to determine the optimized eluent concentration, 100.0 mL aliquots of samples solu tions containing 0.05 mgL –1 of Pb2+ were passed through the cartridge and were eluted with 5 mL of HCl having different concen- trations. As indicated in Figure 2, recovery of Pb2+ in- creased up to 1.0 mol·L–1 but decreased with further in- crease of concentration as more concentrated acid de- stroys and hydrolyses the solid support. Thus 1.0 mol·L–1 HCl was chosen as the optimum concentration of eluent. Also the volume of the eluent was optimized in the process. The range from 1.0 mL to 10.0 mL of eluent volume was investigated and the results indicated that no considerable increase in recovery was achieved by in- creasing the eluent volume beyond 5.0 mL. So the vol- ume of 5.0 mL was employed in this work. (Figure 3) Figure 1. Structure of ligand and the coordination com- pound it forms. Figure 2. Effect of concentration of HCl on the recovery of Pb+2. Conditions: Sample volume: 100 mL, amount of dithi- zone: 2.0 μg, sample flow rate: 15 mL·min–1, eluent flow rate: 15 mL·min–1, eluent volume: 5 mL, pH of sample solution: 7.4. Figure 3. Effect of volume of HCl on the recovery of Pb+2. Conditions: Sample volume: 100 mL, amount of dithizone: 2.0 μg, sample flow rate: 15 mL·min–1, eluent flow rate: 15 mL·min–1, eluent concentration: 1.0 mol·L–1, pH of sample solution: 7.4. 3.4. Effect of pH Since adsorption of lead ions occurs as a result of forma- tion of a coordination compound, pH has a profound effect on the retention of the ions by the ligand. C18 un- dergoes acidic hydrolysis at pH under 2 and its silica structure is prone to dissolution at pHs above 8 (Dong, 2006) thus pH = 1 was discarded during optimization. Optimization of pH was carried out (Figure 4) and based on the results pH = 7.4 were chosen as optimum pH. Dithizone is a bidentate chelating agent and possesses two coordination sites; sulfur and nitrogen. Thus, when the concentration of hydronium ion increases, the more susceptible site to protonation, i.e. nitrogen, is unable to bond to lead ions, hence reduced retention. Higher values of pH causes the problem of precipitation of lead in the form of Pb(OH)2. The aforementioned pH value was adjusted by addition of NH3 and HCl solutions and was later stabilized using a 1.0 mol·L–1 ammonium acetate solution. Copyright © 2011 SciRes. AJAC 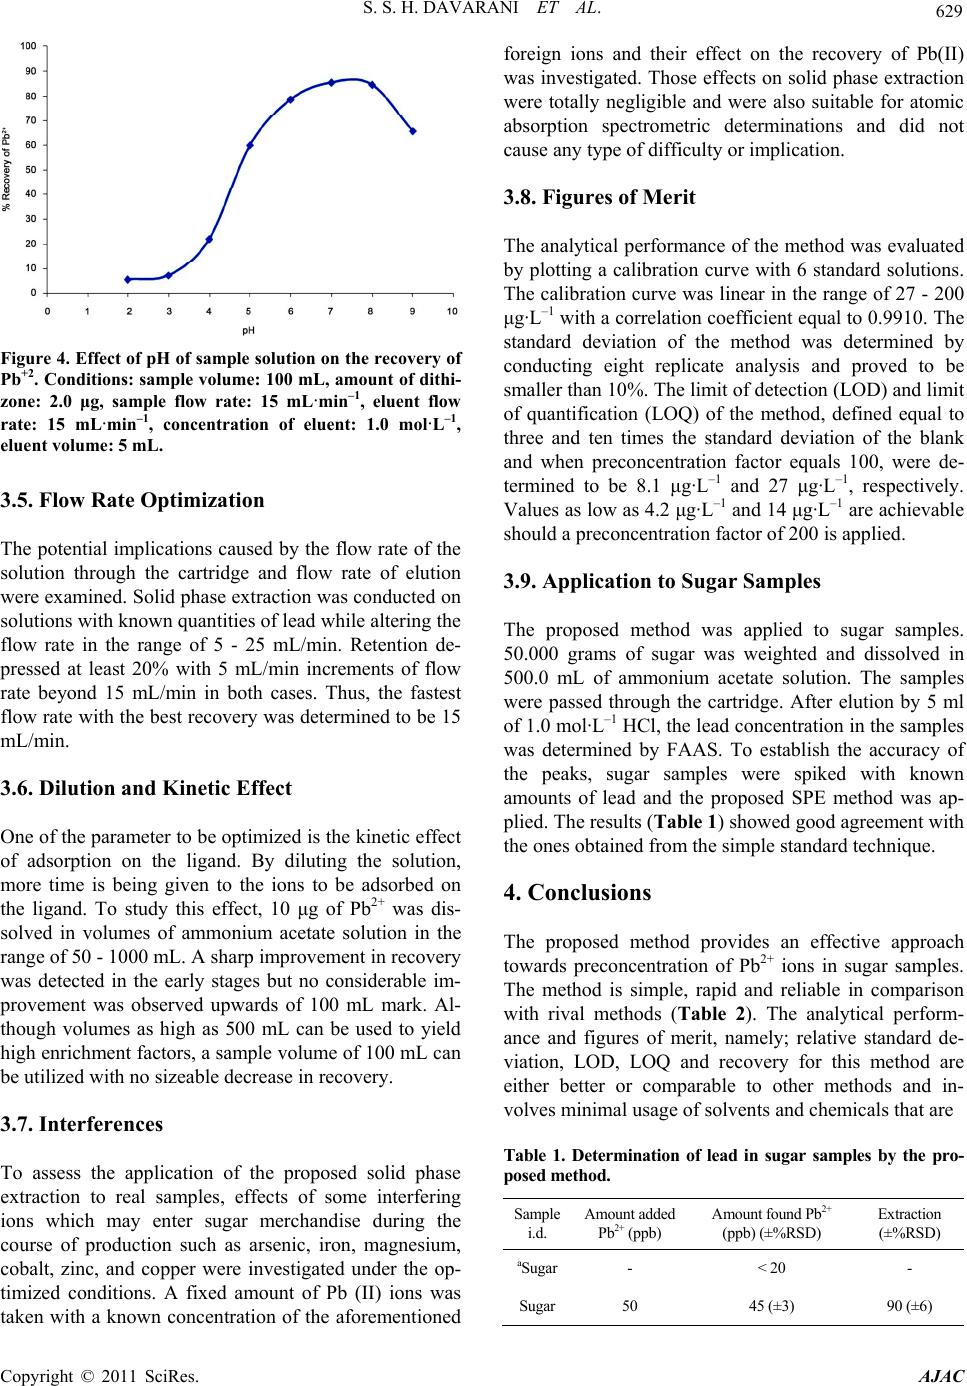 S. S. H. DAVARANI ET AL. 629 Figure 4. Effect of pH of sample solution on the recovery of Pb+2. Conditions: sample volume: 100 mL, amount of dithi- zone: 2.0 μg, sample flow rate: 15 mL·min–1, eluent flow rate: 15 mL·min–1, concentration of eluent: 1.0 mol·L–1, eluent volume: 5 mL. 3.5. Flow Rate Optimization The potential implications caused by the flow rate of the solution through the cartridge and flow rate of elution were examined. Solid phase extraction was conducted on solutions with known quantities of lead while altering the flow rate in the range of 5 - 25 mL/min. Retention de- pressed at least 20% with 5 mL/min increments of flow rate beyond 15 mL/min in both cases. Thus, the fastest flow rate with the best recovery was determined to be 15 mL/min. 3.6. Dilution and Kinetic Effect One of the parameter to be optimized is the kinetic effect of adsorption on the ligand. By diluting the solution, more time is being given to the ions to be adsorbed on the ligand. To study this effect, 10 μg of Pb2+ was dis- solved in volumes of ammonium acetate solution in the range of 50 - 1000 mL. A sharp improvement in recovery was detected in the early stages but no considerable im- provement was observed upwards of 100 mL mark. Al- though volumes as high as 500 mL can be used to yield high enrichment factors, a sample volume of 100 mL can be utilized with no sizeable decrease in recovery. 3.7. Interferences To assess the application of the proposed solid phase extraction to real samples, effects of some interfering ions which may enter sugar merchandise during the course of production such as arsenic, iron, magnesium, cobalt, zinc, and copper were investigated under the op- timized conditions. A fixed amount of Pb (II) ions was taken with a known concentration of the aforementioned foreign ions and their effect on the recovery of Pb(II) was investigated. Those effects on solid phase extraction were totally negligible and were also suitable for atomic absorption spectrometric determinations and did not cause any type of difficulty or implication. 3.8. Figures of Merit The analytical performance of the method was evaluated by plotting a calibration curve with 6 standard solutions. The calibration curve was linear in the range of 27 - 200 μg·L–1 with a correlation coefficient equal to 0.9910. The standard deviation of the method was determined by conducting eight replicate analysis and proved to be smaller than 10%. The limit of detection (LOD) and limit of quantification (LOQ) of the method, defined equal to three and ten times the standard deviation of the blank and when preconcentration factor equals 100, were de- termined to be 8.1 μg·L–1 and 27 μg·L–1, respectively. Values as low as 4.2 μg·L–1 and 14 μg·L–1 are achievable should a preconcentration factor of 200 is applied. 3.9. Application to Sugar Samples The proposed method was applied to sugar samples. 50.000 grams of sugar was weighted and dissolved in 500.0 mL of ammonium acetate solution. The samples were passed through the cartridge. After elution by 5 ml of 1.0 mol·L–1 HCl, the lead concentration in the samples was determined by FAAS. To establish the accuracy of the peaks, sugar samples were spiked with known amounts of lead and the proposed SPE method was ap- plied. The results (Table 1) showed good agreement with the ones obtained from the simple standard technique. 4. Conclusions The proposed method provides an effective approach towards preconcentration of Pb2+ ions in sugar samples. The method is simple, rapid and reliable in comparison with rival methods (Table 2). The analytical perform- ance and figures of merit, namely; relative standard de- viation, LOD, LOQ and recovery for this method are either better or comparable to other methods and in- volves minimal usage of solvents and chemicals that are Table 1. Determination of lead in sugar samples by the pro- posed method. Sample i.d. Amount added Pb2+ (ppb) Amount found Pb2+ (ppb) (±%RSD) Extraction (±%RSD) aSugar - < 20 - Sugar 50 45 (±3) 90 (±6) Copyright © 2011 SciRes. AJAC 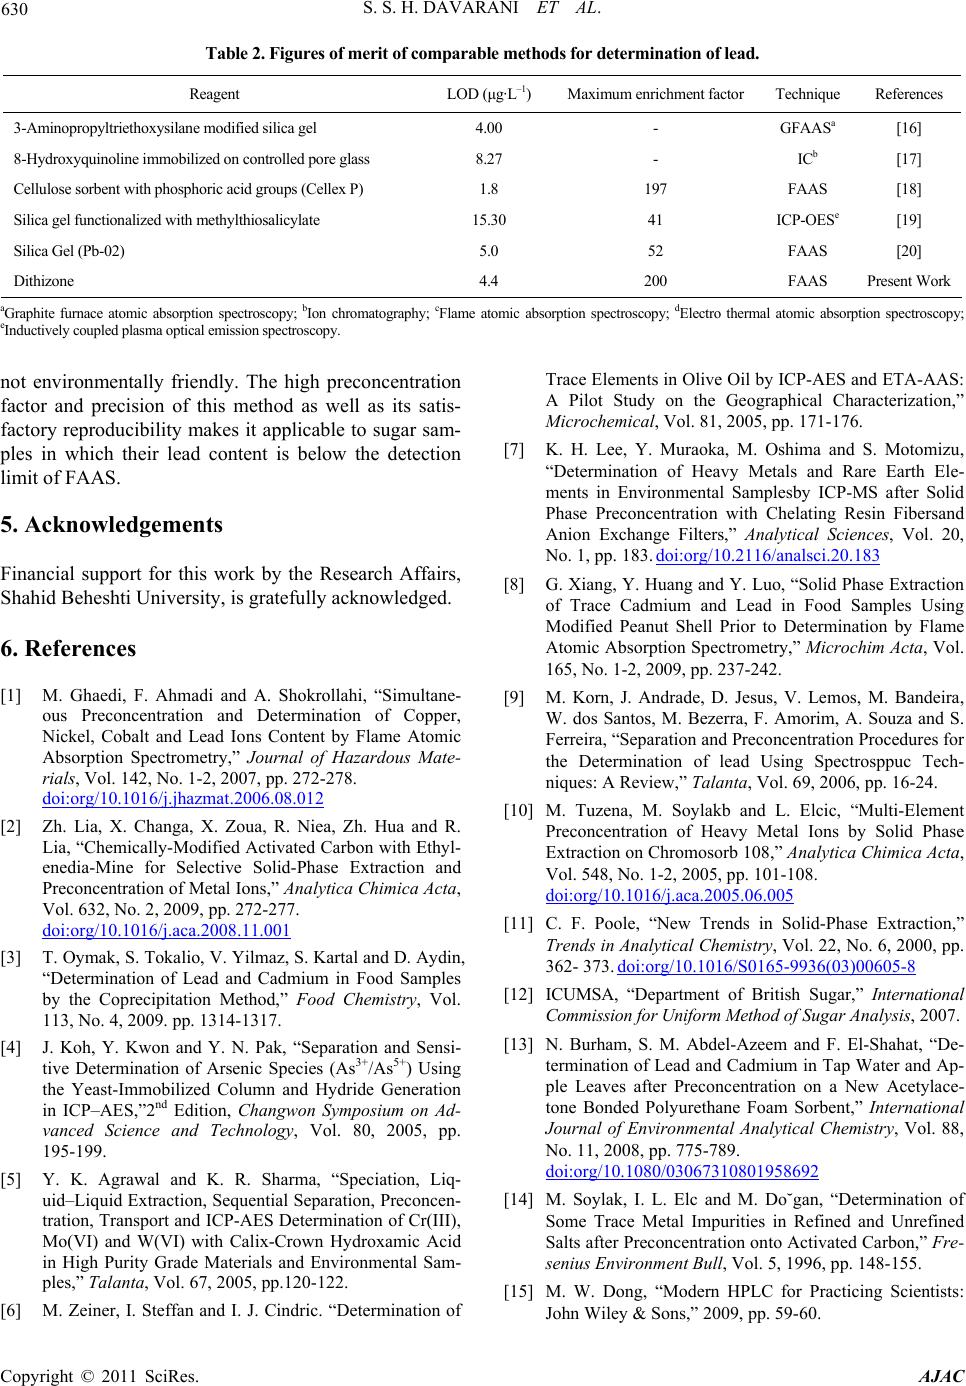 S. S. H. DAVARANI ET AL. Copyright © 2011 SciRes. AJAC 630 Table 2. Figures of merit of comparable methods for determination of lead. Reagent LOD (μg·L–1) Maximum enrichment factor T echnique Ref e rences 3-Aminopropyltriethoxysilane modified silica gel 4.00 - GFAASa [16] 8-Hydroxyquinoline immobilized on controlled pore glass 8.27 - ICb [17] Cellulose sorbent with phosphoric acid groups (Cellex P) 1.8 197 FAAS [18] Silica gel functionalized with methylthiosalicylate 15.30 41 ICP-OESe [19] Silica Gel (Pb-02) 5.0 52 FAAS [20] Dithizon e 4.4 200 FAAS Present Work aGraphite furnace atomic absorption spectroscopy; bIon chromatography; cFlame atomic absorption spectroscopy; dElectro thermal atomic absorption spectroscopy; eInductively coupled plasma optical emission spectroscopy. not environmentally friendly. The high preconcentration factor and precision of this method as well as its satis- factory reproducibility makes it applicable to sugar sam- ples in which their lead content is below the detection limit of FAAS. 5. Acknowledgements Financial support for this work by the Research Affairs, Shahid Beheshti University, is gratefully acknowledged. 6. References [1] M. Ghaedi, F. Ahmadi and A. Shokrollahi, “Simultane- ous Preconcentration and Determination of Copper, Nickel, Cobalt and Lead Ions Content by Flame Atomic Absorption Spectrometry,” Journal of Hazardous Mate- rials, Vol. 142, No. 1-2, 2007, pp. 272-278. doi:org/10.1016/j.jhazmat.2006.08.012 [2] Zh. Lia, X. Changa, X. Zoua, R. Niea, Zh. Hua and R. Lia, “Chemically-Modified Activated Carbon with Ethyl- enedia-Mine for Selective Solid-Phase Extraction and Preconcentration of Metal Ions,” Analytica Chimica Acta, Vol. 632, No. 2, 2009, pp. 272-277. doi:org/10.1016/j.aca.2008.11.001 [3] T. Oymak, S. Tokalio, V. Yilmaz, S. Kartal and D. Aydin, “Determination of Lead and Cadmium in Food Samples by the Coprecipitation Method,” Food Chemistry, Vol. 113, No. 4, 2009. pp. 1314-1317. [4] J. Koh, Y. Kwon and Y. N. Pak, “Separation and Sensi- tive Determination of Arsenic Species (As3+/As5+) Using the Yeast-Immobilized Column and Hydride Generation in ICP–AES,”2nd Edition, Changwon Symposium on Ad- vanced Science and Technology, Vol. 80, 2005, pp. 195-199. [5] Y. K. Agrawal and K. R. Sharma, “Speciation, Liq- uid–Liquid Extraction, Sequential Separation, Preconcen- tration, Transport and ICP-AES Determination of Cr(III), Mo(VI) and W(VI) with Calix-Crown Hydroxamic Acid in High Purity Grade Materials and Environmental Sam- ples,” Talanta, Vol. 67, 2005, pp.120-122. [6] M. Zeiner, I. Steffan and I. J. Cindric. “Determination of Trace Elements in Olive Oil by ICP-AES and ETA-AAS: A Pilot Study on the Geographical Characterization,” Microchemical, Vol. 81, 2005, pp. 171-176. [7] K. H. Lee, Y. Muraoka, M. Oshima and S. Motomizu, “Determination of Heavy Metals and Rare Earth Ele- ments in Environmental Samplesby ICP-MS after Solid Phase Preconcentration with Chelating Resin Fibersand Anion Exchange Filters,” Analytical Sciences, Vol. 20, No. 1, pp. 183. doi:org/10.2116/analsci.20.183 [8] G. Xiang, Y. Huang and Y. Luo, “Solid Phase Extraction of Trace Cadmium and Lead in Food Samples Using Modified Peanut Shell Prior to Determination by Flame Atomic Absorption Spectrometry,” Microchim Acta, Vol. 165, No. 1-2, 2009, pp. 237-242. [9] M. Korn, J. Andrade, D. Jesus, V. Lemos, M. Bandeira, W. dos Santos, M. Bezerra, F. Amorim, A. Souza and S. Ferreira, “Separation and Preconcentration Procedures for the Determination of lead Using Spectrosppuc Tech- niques: A Review,” Talanta, Vol. 69, 2006, pp. 16-24. [10] M. Tuzena, M. Soylakb and L. Elcic, “Multi-Element Preconcentration of Heavy Metal Ions by Solid Phase Extraction on Chromosorb 108,” Analytica Chimica Acta, Vol. 548, No. 1-2, 2005, pp. 101-108. doi:org/10.1016/j.aca.2005.06.005 [11] C. F. Poole, “New Trends in Solid-Phase Extraction,” Trends in Analytical Chemistry, Vol. 22, No. 6, 2000, pp. 362- 373. doi:org/10.1016/S0165-9936(03)00605-8 [12] ICUMSA, “Department of British Sugar,” International Commission for Uniform Method of Sugar Analysis, 2007. [13] N. Burham, S. M. Abdel-Azeem and F. El-Shahat, “De- termination of Lead and Cadmium in Tap Water and Ap- ple Leaves after Preconcentration on a New Acetylace- tone Bonded Polyurethane Foam Sorbent,” International Journal of Environmental Analytical Chemistry, Vol. 88, No. 11, 2008, pp. 775-789. doi:org/10.1080/03067310801958692 [14] M. Soylak, I. L. Elc and M. Do˘gan, “Determination of Some Trace Metal Impurities in Refined and Unrefined Salts after Preconcentration onto Activated Carbon,” Fre- senius Environment Bull, Vol. 5, 1996, pp. 148-155. [15] M. W. Dong, “Modern HPLC for Practicing Scientists: John Wiley & Sons,” 2009, pp. 59-60.  S. S. H. DAVARANI ET AL. 631 [16] C. Ekinci and Ü. Köklü, “Determination of Vanadium, Manganese, Silver and Lead by Graphite Furnace Atomic Absorption Spectrometry after Preconcentration on Sil- ica-Gel Modified with 3-Aminopropyltriethoxysilane,” Spectrochimica Acta Part B: Atomic Spectroscopy, Vol. 55, No. 9, 2000, pp. 1491-1495. doi:org/10.1016/S0584-8547(00)00259-7 [17] M. R. B. Abas, I. A. Takrunia, Z. Abdullaha and M. M. Tahirb, “On-Line Preconcentration and Determination of Trace Metals Using a flow Injection System Coupled to Ion Chromatography,” Talanta, Vol. 58, No. 5, 2002, pp. 883-890. doi:10.1016/S0039-9140(02)00396-X [18] K. Pyrzyska and K. Cheregi, “Lead Determination with On-Line Enrichment System,” Water Research, Vol. 34, No. 17, 2000, pp. 4215-4219. doi:org/10.1016/S0043-1354(00)00198-6 [19] M. Zeiner, I. Steffan and I. J. Cindric. “Determination of Trace Elements in Olive Oil by ICP-AES and ETA-AAS: A Pilot Study on the Geographical Characterization,” Microchemical, Vol. 81, No. 2, 2005, pp. 171-176. [20] M. Zougagh, A. García de Torres, E. V. Alonso and J. M. C. Pavón, “Automatic on Line Preconcentration and De- termination of Lead in Water by ICP-AES Using a TS-Microcolumn,” Talanta, Vol. 62, No. 3, 2004, pp. 503-510. Copyright © 2011 SciRes. AJAC |