Paper Menu >>
Journal Menu >>
 American Journal of Anal yt ical Chemistry, 2011, 2, 612-618 doi:10.4236/ajac.2011.25069 Published Online September 2011 (http://www.SciRP.org/journal/ajac) Copyright © 2011 SciRes. AJAC Determination of Melamine in Fresh Milk by Electrochemistry with Solid Phase Microextraction at Bismuthyl Chloride Modified Graphite Epoxy Composite Electrode Yongchun Zhu1*, Yanjia Zhang1, Jingyi Li2, Yanli Han1, Guobin Dong1, Hongbo Zhang1 1College of Chemistry and Life Science, Shenyang Normal University, Shenyang, China 2Foreign Language Department, Sheny ang Agricult ural University, Shenyang, China E-mail: yongchunzhu@126.com, *yongchunzhu@126.com Received April 28, 2011; revised May 3, 2011; accepted June 7, 2011 Abstract Melamine as an important chemical raw material and a harmful additive in foods has attracted many people’s attention. In the present paper, The graphite-epoxy composited solid phase electrode was modified with bis- muth layer by cyclic voltammetric deposition of bismuth from Bi(NO3)3 aqueous solution including 0.10 M HNO3, and hydrolyzed into micro bismuthyl chloride on-sites. Melamine in fresh milk was extracted with solid phase micro-extraction on the bismuthyl chloride modified graphite-epoxy composited solid electrode. The adsorption of melamine on bismuthyl chloride particle surfaces follows a Freundlich adsorption model, and results in the decrease of the reduction peak current of bismuth in bismuthyl chloride, and determined by differential pulse voltammetry from fresh milk in a larger concentration range of 10–4 10–12 M with detec- tion limit of 2.5 10–12 M and relative standard deviation of 2.7%. The method is sensitive, convenient and was applied in the detection of melamine in fresh milk with relative deviation of 4.2% in content of 0.45 mg/kg melamine in the fresh milk. Keywords: Melamine, Bismuthyl Chloride Modified Electrode, Adsorption, Differential Pulse Voltammetry, Solid Phase Micro Extraction 1. Introduction Melamine (2,4,6-triamino-1,3,5-triazine), as an important chemical raw material, has been widely used in the pro- duction of plastics[1-4], paper finishers [5], flame retar- dant [6], and wrinkle-free textiles[7] in the manufacture as well as nano materials [8-10]. Recent case of the dis- covery of melamine as one of the harmful additives in pet food, animal feed, milk and protein sources including wheat gluten, rice protein concentrate, and corn gluten results in an urgent need for rapid detection methods of melamine in foods [11-13]. The common methods for detection of melamine have been recommended as GC/ MS [14], LC/MS [15,16], as well as the specific anti- gen-antibody reaction and immune chromatography analysis technology [17,18]. All these methods are in- struments expensive and time consuming. Electrochemi- cal methods are not favorable for detection of melamine due to its electrochemical inertness. So to find out a suitable chemical modified electrode for extraction, pre- concentration and detection of melamine is the key point in electrochemical detection of melamine. Melamine as an aromatic polyamine molecule can interact with ploy- hydroxides or polyphenol molecules, such as bismuth oxides, bismuthyl chloride molecules through the hy- drogen bond formation. Electrochemical deposited bis- muth electrode has been used conveniently in electro- chemical analysis [19,20]. The deposited bismuth hy- droxides or bismuthyl chloride may be favourable in the extraction and electrochemical detection of melamine. In the present paper, the bismuthyl chloride film mo- dified solid phase graphite-epoxy carbon paste electrode was prepared for the electrochemical solid phase micro extraction. Melamine from fresh milk was electrochemi- cally determined, and reported here. 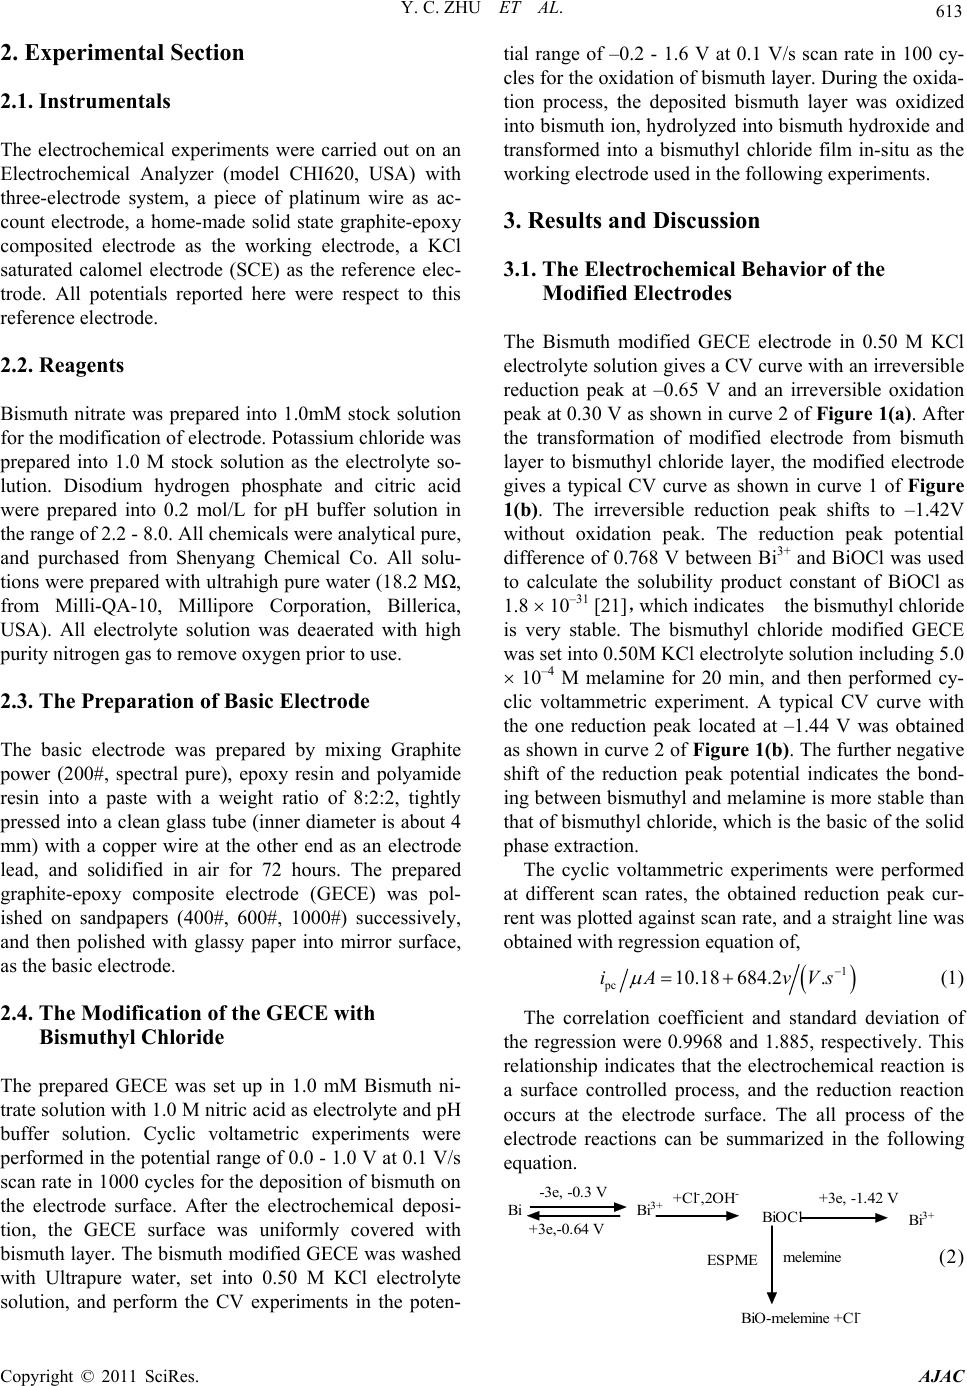 Y. C. ZHU ET AL. 613 2. Experimental Section 2.1. Instrumentals The electrochemical experiments were carried out on an Electrochemical Analyzer (model CHI620, USA) with three-electrode system, a piece of platinum wire as ac- count electrode, a home-made solid state graphite-epoxy composited electrode as the working electrode, a KCl saturated calomel electrode (SCE) as the reference elec- trode. All potentials reported here were respect to this reference electrode. 2.2. Reagents Bismuth nitrate was prepared into 1.0mM stock solution for the modification of electrode. Potassium chloride was prepared into 1.0 M stock solution as the electrolyte so- lution. Disodium hydrogen phosphate and citric acid were prepared into 0.2 mol/L for pH buffer solution in the range of 2.2 - 8.0. All chemicals were analytical pure, and purchased from Shenyang Chemical Co. All solu- tions were prepared with ultrahigh pure water (18.2 MΩ, from Milli-QA-10, Millipore Corporation, Billerica, USA). All electrolyte solution was deaerated with high purity nitrogen gas to remove oxygen prior to use. 2.3. The Preparation of Basic Electrode The basic electrode was prepared by mixing Graphite power (200#, spectral pure), epoxy resin and polyamide resin into a paste with a weight ratio of 8:2:2, tightly pressed into a clean glass tube (inner diameter is about 4 mm) with a copper wire at the other end as an electrode lead, and solidified in air for 72 hours. The prepared graphite-epoxy composite electrode (GECE) was pol- ished on sandpapers (400#, 600#, 1000#) successively, and then polished with glassy paper into mirror surface, as the basic electrode. 2.4. The Modification of the GECE with Bismuthyl Chloride The prepared GECE was set up in 1.0 mM Bismuth ni- trate solution with 1.0 M nitric acid as electrolyte and pH buffer solution. Cyclic voltametric experiments were performed in the potential range of 0.0 - 1.0 V at 0.1 V/s scan rate in 1000 cycles for the deposition of bismuth on the electrode surface. After the electrochemical deposi- tion, the GECE surface was uniformly covered with bismuth layer. The bismuth modified GECE was washed with Ultrapure water, set into 0.50 M KCl electrolyte solution, and perform the CV experiments in the poten- tial range of –0.2 - 1.6 V at 0.1 V/s scan rate in 100 cy- cles for the oxidation of bismuth layer. During the oxida- tion process, the deposited bismuth layer was oxidized into bismuth ion, hydrolyzed into bismuth hydroxide and transformed into a bismuthyl chloride film in-situ as the working electrode used in the following experiments. 3. Results and Discussion 3.1. The Electrochemical Behavior of the Modified Electrodes The Bismuth modified GECE electrode in 0.50 M KCl electrolyte solution gives a CV curve with an irreversible reduction peak at –0.65 V and an irreversible oxidation peak at 0.30 V as shown in curve 2 of Figure 1(a). After the transformation of modified electrode from bismuth layer to bismuthyl chloride layer, the modified electrode gives a typical CV curve as shown in curve 1 of Figure 1(b). The irreversible reduction peak shifts to –1.42V without oxidation peak. The reduction peak potential difference of 0.768 V between Bi3+ and BiOCl was used to calculate the solubility product constant of BiOCl as 1.8 10–31 [21],which indicates the bismuthyl chloride is very stable. The bismuthyl chloride modified GECE was set into 0.50M KCl electrolyte solution including 5.0 10–4 M melamine for 20 min, and then performed cy- clic voltammetric experiment. A typical CV curve with the one reduction peak located at –1.44 V was obtained as shown in curve 2 of Figure 1(b). The further negative shift of the reduction peak potential indicates the bond- ing between bismuthyl and melamine is more stable than that of bismuthyl chloride, which is the basic of the solid phase extraction. The cyclic voltammetric experiments were performed at different scan rates, the obtained reduction peak cur- rent was plotted against scan rate, and a straight line was obtained with regression equation of, 1 pc 10.18 684.2.iA vVs (1) The correlation coefficient and standard deviation of the regression were 0.9968 and 1.885, respectively. This relationship indicates that the electrochemical reaction is a surface controlled process, and the reduction reaction occurs at the electrode surface. The all process of the electrode reactions can be summarized in the following equation. Bi -3e, -0.3 V +3e,-0.64 V Bi 3+ +Cl - ,2OH - BiOCl ESPME melemine BiO-melemine +Cl - +3e, -1.42 V Bi 3+ (2) Copyright © 2011 SciRes. AJAC 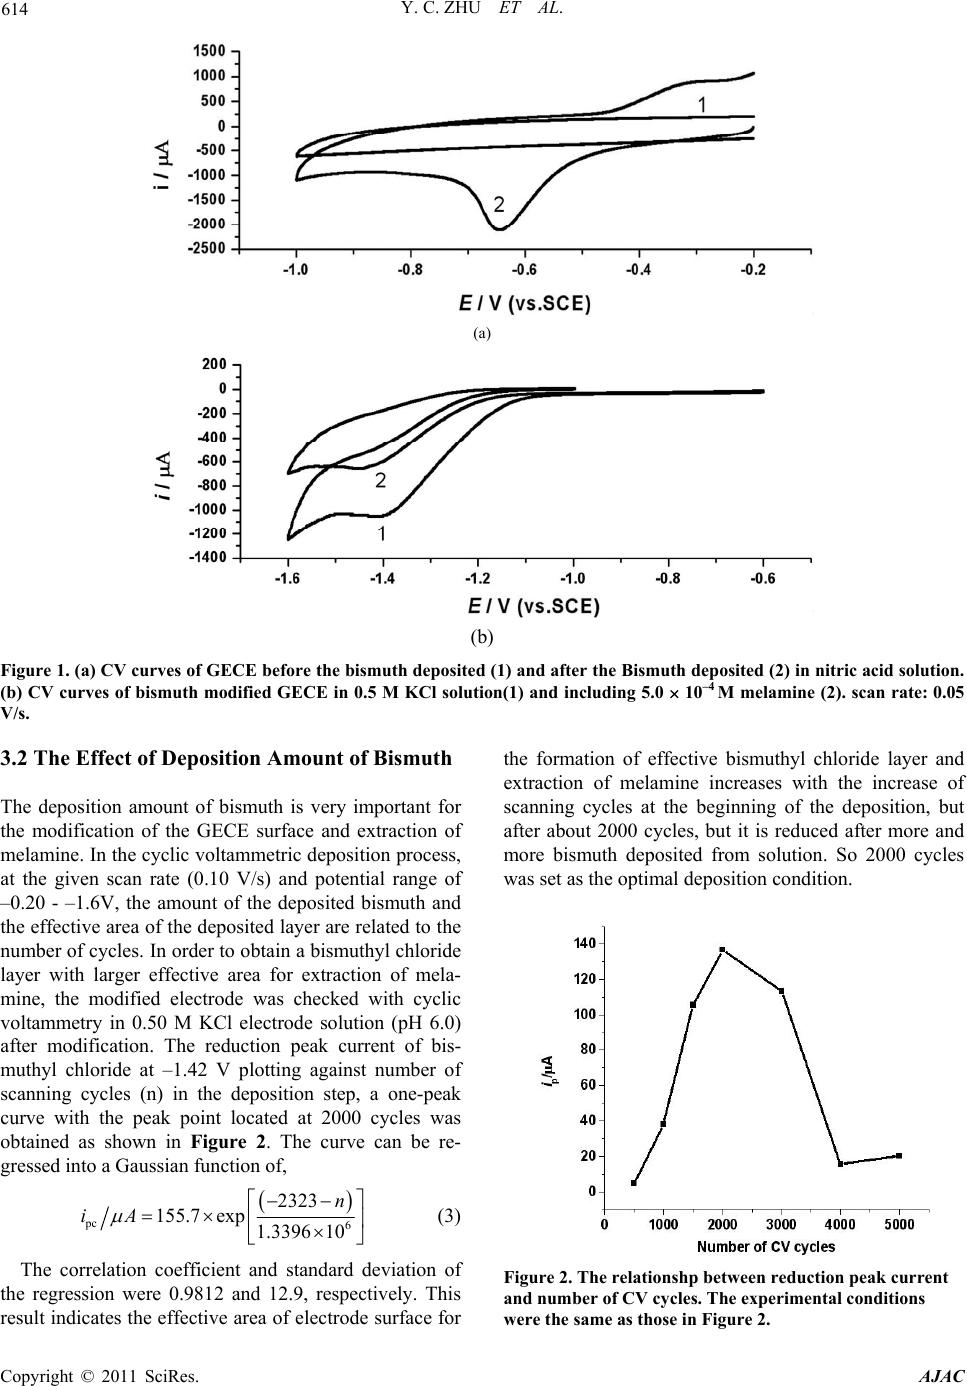 Y. C. ZHU ET AL. Copyright © 2011 SciRes. AJAC 614 (a) (b) Figure 1. (a) CV curves of GECE before the bismuth deposited (1) and after the Bismuth deposited (2) in nitric acid solution. (b) CV curves of bismuth modified GECE in 0.5 M KCl solution(1) and including 5.0 10–4 M melamine (2). scan rate: 0.05 V/s. 3.2 The Effect of Deposition Amount of Bismuth The deposition amount of bismuth is very important for the modification of the GECE surface and extraction of melamine. In the cyclic voltammetric deposition process, at the given scan rate (0.10 V/s) and potential range of –0.20 - –1.6V, the amount of the deposited bismuth and the effective area of the deposited layer are related to the number of cycles. In order to obtain a bismuthyl chloride layer with larger effective area for extraction of mela- mine, the modified electrode was checked with cyclic voltammetry in 0.50 M KCl electrode solution (pH 6.0) after modification. The reduction peak current of bis- muthyl chloride at –1.42 V plotting against number of scanning cycles (n) in the deposition step, a one-peak curve with the peak point located at 2000 cycles was obtained as shown in Figure 2. The curve can be re- gressed into a Gaussian function of, pc 6 2323 155.7exp 1.3396 10 n iA (3) The correlation coefficient and standard deviation of the regression were 0.9812 and 12.9, respectively. This result indicates the effective area of electrode surface for the formation of effective bismuthyl chloride layer and extraction of melamine increases with the increase of scanning cycles at the beginning of the deposition, but after about 2000 cycles, but it is reduced after more and more bismuth deposited from solution. So 2000 cycles was set as the optimal deposition condition. Figure 2. The relationshp between reduction peak current and number of CV cycles. The experimental conditions were the same as those in Figure 2. 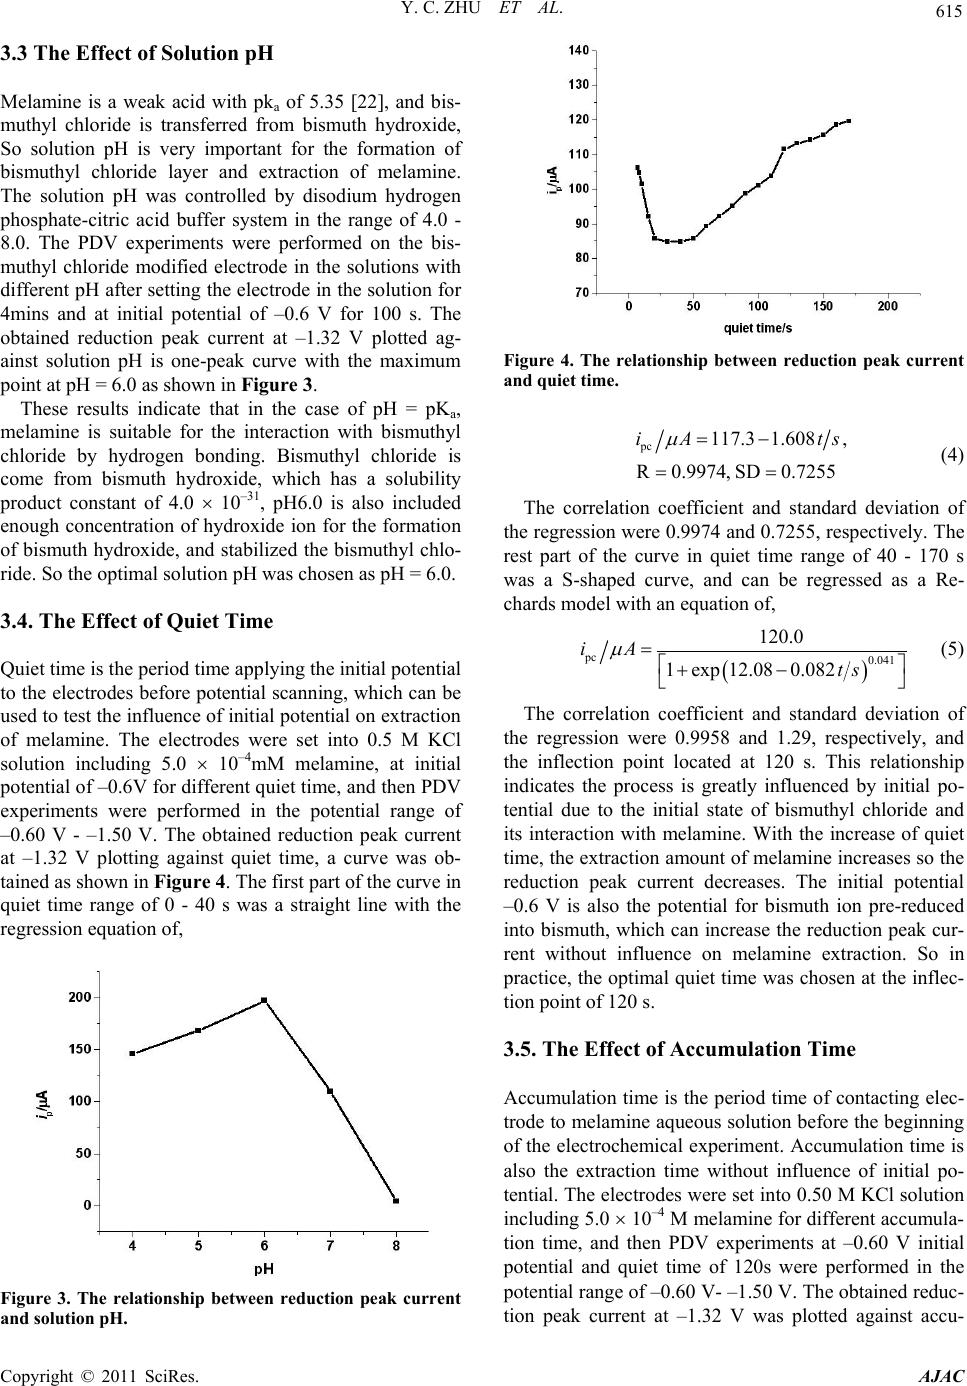 Y. C. ZHU ET AL. 615 3.3 The Effect of Solution pH Melamine is a weak acid with pka of 5.35 [22], and bis- muthyl chloride is transferred from bismuth hydroxide, So solution pH is very important for the formation of bismuthyl chloride layer and extraction of melamine. The solution pH was controlled by disodium hydrogen phosphate-citric acid buffer system in the range of 4.0 - 8.0. The PDV experiments were performed on the bis- muthyl chloride modified electrode in the solutions with different pH after setting the electrode in the solution for 4mins and at initial potential of –0.6 V for 100 s. The obtained reduction peak current at –1.32 V plotted ag- ainst solution pH is one-peak curve with the maximum point at pH = 6.0 as shown in Figure 3. These results indicate that in the case of pH = pKa, melamine is suitable for the interaction with bismuthyl chloride by hydrogen bonding. Bismuthyl chloride is come from bismuth hydroxide, which has a solubility product constant of 4.0 10–31, pH6.0 is also included enough concentration of hydroxide ion for the formation of bismuth hydroxide, and stabilized the bismuthyl chlo- ride. So the optimal solution pH was chosen as pH = 6.0. 3.4. The Effect of Quiet Time Quiet time is the period time applying the initial potential to the electrodes before potential scanning, which can be used to test the influence of initial potential on extraction of melamine. The electrodes were set into 0.5 M KCl solution including 5.0 10–4mM melamine, at initial potential of –0.6V for different quiet time, and then PDV experiments were performed in the potential range of –0.60 V - –1.50 V. The obtained reduction peak current at –1.32 V plotting against quiet time, a curve was ob- tained as shown in Figure 4. The first part of the curve in quiet time range of 0 - 40 s was a straight line with the regression equation of, Figure 3. The relationship between reduction peak current and solution pH. Figure 4. The relationship between reduction peak current and quiet time. pc 117.3 1.608, R0.9974, SD0.7255 iA ts (4) The correlation coefficient and standard deviation of the regression were 0.9974 and 0.7255, respectively. The rest part of the curve in quiet time range of 40 - 170 s was a S-shaped curve, and can be regressed as a Re- chards model with an equation of, pc 0.041 120.0 1exp 12.080.082 iA ts (5) The correlation coefficient and standard deviation of the regression were 0.9958 and 1.29, respectively, and the inflection point located at 120 s. This relationship indicates the process is greatly influenced by initial po- tential due to the initial state of bismuthyl chloride and its interaction with melamine. With the increase of quiet time, the extraction amount of melamine increases so the reduction peak current decreases. The initial potential –0.6 V is also the potential for bismuth ion pre-reduced into bismuth, which can increase the reduction peak cur- rent without influence on melamine extraction. So in practice, the optimal quiet time was chosen at the inflec- tion point of 120 s. 3.5. The Effect of Accumulation Time Accumulation time is the period time of contacting elec- trode to melamine aqueous solution before the beginning of the electrochemical experiment. Accumulation time is also the extraction time without influence of initial po- tential. The electrodes were set into 0.50 M KCl solution including 5.0 10–4 M melamine for different accumula- tion time, and then PDV experiments at –0.60 V initial potential and quiet time of 120s were performed in the potential range of –0.60 V- –1.50 V. The obtained reduc- tion peak current at –1.32 V was plotted against accu- Copyright © 2011 SciRes. AJAC 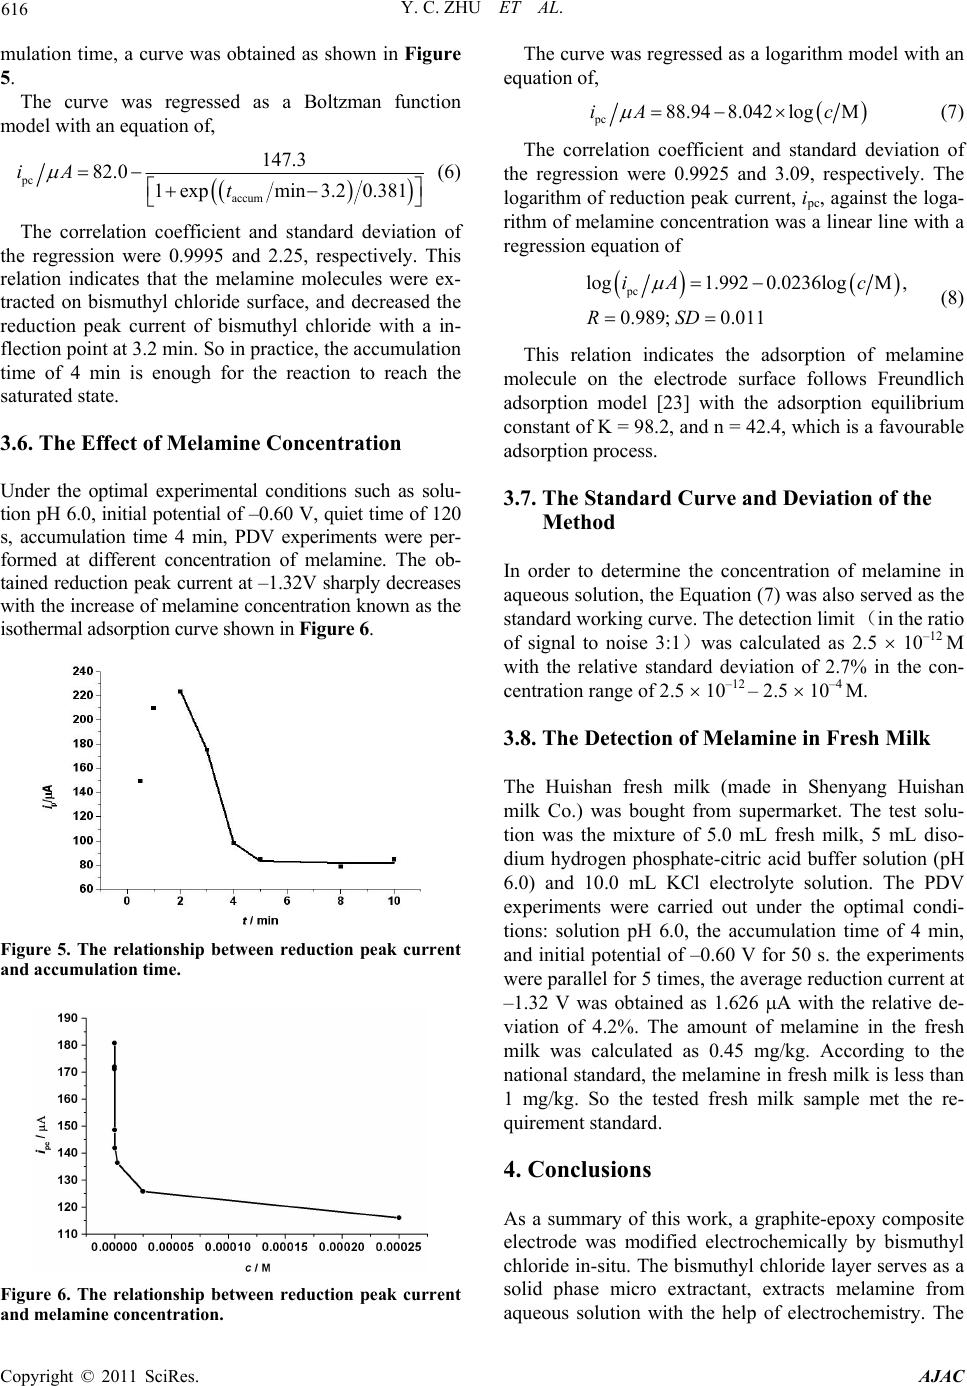 616 Y. C. ZHU ET AL. mulation time, a curve was obtained as shown in Figure 5. The curve was regressed as a Boltzman function model with an equation of, pc accum 147.3 82.0 1expmin 3.20.381 iA t (6) The correlation coefficient and standard deviation of the regression were 0.9995 and 2.25, respectively. This relation indicates that the melamine molecules were ex- tracted on bismuthyl chloride surface, and decreased the reduction peak current of bismuthyl chloride with a in- flection point at 3.2 min. So in practice, the accumulation time of 4 min is enough for the reaction to reach the saturated state. 3.6. The Effect of Melamine Concentration Under the optimal experimental conditions such as solu- tion pH 6.0, initial potential of –0.60 V, quiet time of 120 s, accumulation time 4 min, PDV experiments were per- formed at different concentration of melamine. The ob- tained reduction peak current at –1.32V sharply decreases with the increase of melamine concentration known as the isothermal adsorption curve shown in Figure 6. Figure 5. The relationship between reduction peak current and accumulation time. Figure 6. The relationship between reduction peak current and melamine concentration. The curve was regressed as a logarithm model with an equation of, pc 88.948.042 logMiA c (7) The correlation coefficient and standard deviation of the regression were 0.9925 and 3.09, respectively. The logarithm of reduction peak current, ipc, against the loga- rithm of melamine concentration was a linear line with a regression equation of pc log1.9920.0236logM , 0.989; 0.011 iA c RSD (8) This relation indicates the adsorption of melamine molecule on the electrode surface follows Freundlich adsorption model [23] with the adsorption equilibrium constant of K = 98.2, and n = 42.4, which is a favourable adsorption process. 3.7. The Standard Curve and Deviation of the Method In order to determine the concentration of melamine in aqueous solution, the Equation (7) was also served as the standard working curve. The detection limit (in the ratio of signal to noise 3:1)was calculated as 2.5 10–12 M with the relative standard deviation of 2.7% in the con- centration range of 2.5 10–12 – 2.5 10–4 M. 3.8. The Detection of Melamine in Fresh Milk The Huishan fresh milk (made in Shenyang Huishan milk Co.) was bought from supermarket. The test solu- tion was the mixture of 5.0 mL fresh milk, 5 mL diso- dium hydrogen phosphate-citric acid buffer solution (pH 6.0) and 10.0 mL KCl electrolyte solution. The PDV experiments were carried out under the optimal condi- tions: solution pH 6.0, the accumulation time of 4 min, and initial potential of –0.60 V for 50 s. the experiments were parallel for 5 times, the average reduction current at –1.32 V was obtained as 1.626 A with the relative de- viation of 4.2%. The amount of melamine in the fresh milk was calculated as 0.45 mg/kg. According to the national standard, the melamine in fresh milk is less than 1 mg/kg. So the tested fresh milk sample met the re- quirement standard. 4. Conclusions As a summary of this work, a graphite-epoxy composite electrode was modified electrochemically by bismuthyl chloride in-situ. The bismuthyl chloride layer serves as a solid phase micro extractant, extracts melamine from aqueous solution with the help of electrochemistry. The Copyright © 2011 SciRes. AJAC 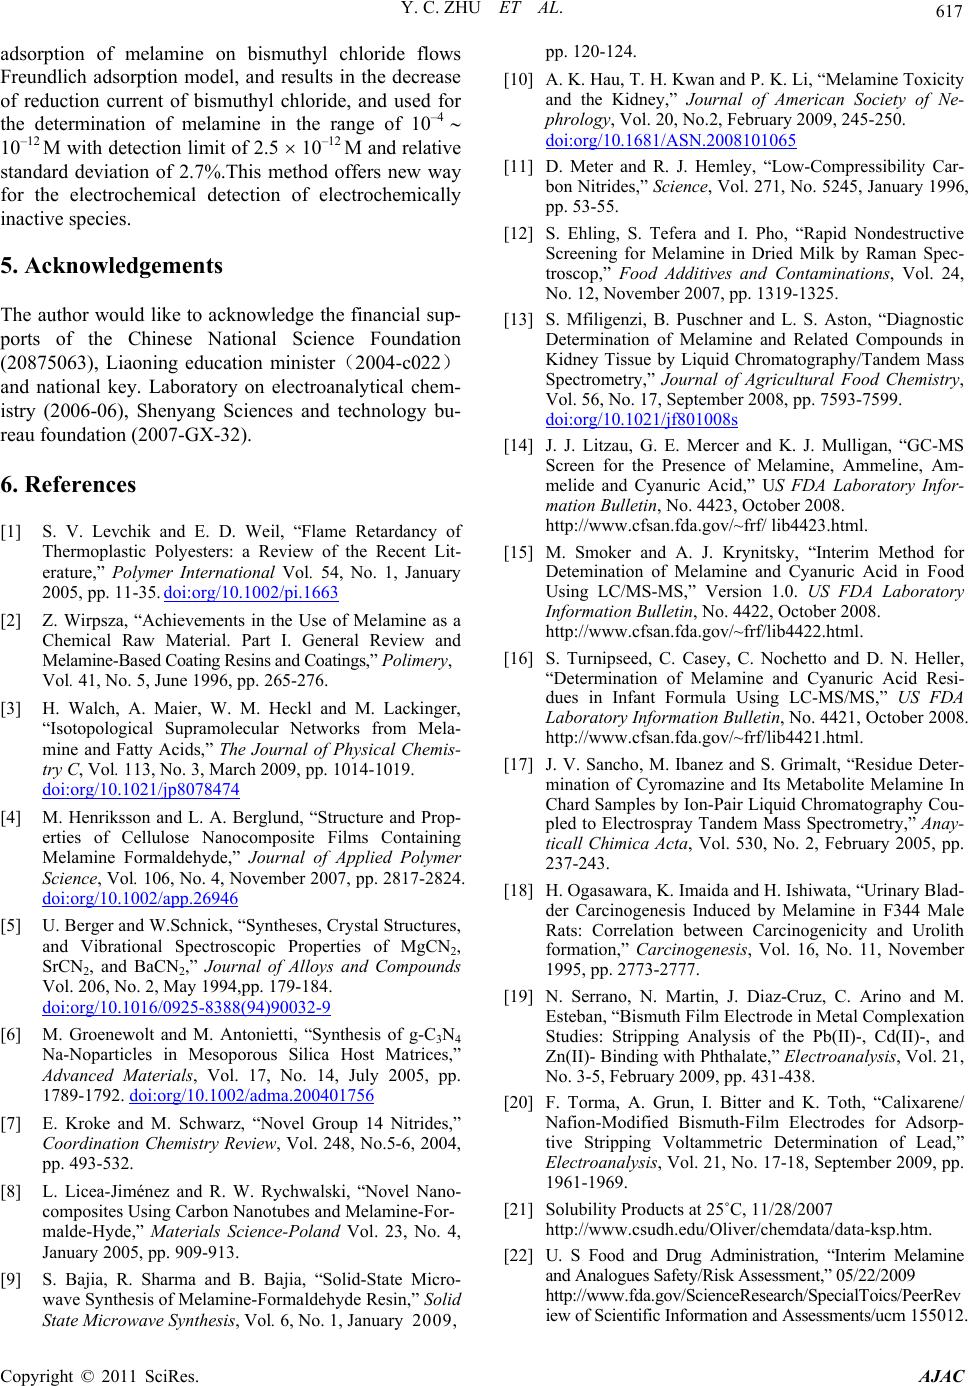 Y. C. ZHU ET AL. 617 adsorption of melamine on bismuthyl chloride flows Freundlich adsorption model, and results in the decrease of reduction current of bismuthyl chloride, and used for the determination of melamine in the range of 10–4 10–12 M with detection limit of 2.5 10–12 M and relative standard deviation of 2.7%.This method offers new way for the electrochemical detection of electrochemically inactive species. 5. Acknowledgements The author would like to acknowledge the financial sup- ports of the Chinese National Science Foundation (20875063), Liaoning education minister(2004-c022) and national key. Laboratory on electroanalytical chem- istry (2006-06), Shenyang Sciences and technology bu- reau foundation (2007-GX-32). 6. References [1] S. V. Levchik and E. D. Weil, “Flame Retardancy of Thermoplastic Polyesters: a Review of the Recent Lit- erature,” Polymer International Vol. 54, No. 1, January 2005, pp. 11-35. doi:org/10.1002/pi.1663 [2] Z. Wirpsza, “Achievements in the Use of Melamine as a Chemical Raw Material. Part I. General Review and Melamine-Based Coating Resins and Coatings,” Polimery, Vol. 41, No. 5, June 1996, pp. 265-276. [3] H. Walch, A. Maier, W. M. Heckl and M. Lackinger, “Isotopological Supramolecular Networks from Mela- mine and Fatty Acids,” The Journal of Physical Chemis- try C, Vol. 113, No. 3, March 2009, pp. 1014-1019. doi:org/10.1021/jp8078474 [4] M. Henriksson and L. A. Berglund, “Structure and Prop- erties of Cellulose Nanocomposite Films Containing Melamine Formaldehyde,” Journal of Applied Polymer Science, Vol. 106, No. 4, November 2007, pp. 2817-2824. doi:org/10.1002/app.26946 [5] U. Berger and W.Schnick, “Syntheses, Crystal Structures, and Vibrational Spectroscopic Properties of MgCN2, SrCN2, and BaCN2,” Journal of Alloys and Compounds Vol. 206, No. 2, May 1994,pp. 179-184. doi:org/10.1016/0925-8388(94)90032-9 [6] M. Groenewolt and M. Antonietti, “Synthesis of g-C3N4 Na-Noparticles in Mesoporous Silica Host Matrices,” Advanced Materials, Vol. 17, No. 14, July 2005, pp. 1789-1792. doi:org/10.1002/adma.200401756 [7] E. Kroke and M. Schwarz, “Novel Group 14 Nitrides,” Coordination Chemistry Review, Vol. 248, No.5-6, 2004, pp. 493-532. [8] L. Licea-Jiménez and R. W. Rychwalski, “Novel Nano- composites Using Carbon Nanotubes and Melamine-For- malde-Hyde,” Materials Science-Poland Vol. 23, No. 4, January 2005, pp. 909-913. [9] S. Bajia, R. Sharma and B. Bajia, “Solid-State Micro- wave Synthesis of Melamine-Formaldehyde Resin,” Solid State Microwave Synthesis, Vol. 6, No. 1, January 2009, pp. 120-124. [10] A. K. Hau, T. H. Kwan and P. K. Li, “Melamine Toxicity and the Kidney,” Journal of American Society of Ne- phrology, Vol. 20, No.2, February 2009, 245-250. doi:org/10.1681/ASN.2008101065 [11] D. Meter and R. J. Hemley, “Low-Compressibility Car- bon Nitrides,” Science, Vol. 271, No. 5245, January 1996, pp. 53-55. [12] S. Ehling, S. Tefera and I. Pho, “Rapid Nondestructive Screening for Melamine in Dried Milk by Raman Spec- troscop,” Food Additives and Contaminations, Vol. 24, No. 12, November 2007, pp. 1319-1325. [13] S. Mfiligenzi, B. Puschner and L. S. Aston, “Diagnostic Determination of Melamine and Related Compounds in Kidney Tissue by Liquid Chromatography/Tandem Mass Spectrometry,” Journal of Agricultural Food Chemistry, Vol. 56, No. 17, September 2008, pp. 7593-7599. doi:org/10.1021/jf801008s [14] J. J. Litzau, G. E. Mercer and K. J. Mulligan, “GC-MS Screen for the Presence of Melamine, Ammeline, Am- melide and Cyanuric Acid,” US FDA Laboratory Infor- mation Bulletin, No. 4423, October 2008. http://www.cfsan.fda.gov/~frf/ lib4423.html. [15] M. Smoker and A. J. Krynitsky, “Interim Method for Detemination of Melamine and Cyanuric Acid in Food Using LC/MS-MS,” Version 1.0. US FDA Laboratory Information Bulletin, No. 4422, October 2008. http://www.cfsan.fda.gov/~frf/lib4422.html. [16] S. Turnipseed, C. Casey, C. Nochetto and D. N. Heller, “Determination of Melamine and Cyanuric Acid Resi- dues in Infant Formula Using LC-MS/MS,” US FDA Laboratory Information Bulletin, No. 4421, October 2008. http://www.cfsan.fda.gov/~frf/lib4421.html. [17] J. V. Sancho, M. Ibanez and S. Grimalt, “Residue Deter- mination of Cyromazine and Its Metabolite Melamine In Chard Samples by Ion-Pair Liquid Chromatography Cou- pled to Electrospray Tandem Mass Spectrometry,” Anay- ticall Chimica Acta, Vol. 530, No. 2, February 2005, pp. 237-243. [18] H. Ogasawara, K. Imaida and H. Ishiwata, “Urinary Blad- der Carcinogenesis Induced by Melamine in F344 Male Rats: Correlation between Carcinogenicity and Urolith formation,” Carcinogenesis, Vol. 16, No. 11, November 1995, pp. 2773-2777. [19] N. Serrano, N. Martin, J. Diaz-Cruz, C. Arino and M. Esteban, “Bismuth Film Electrode in Metal Complexation Studies: Stripping Analysis of the Pb(II)-, Cd(II)-, and Zn(II)- Binding with Phthalate,” Electroanalysis, Vol. 21, No. 3-5, February 2009, pp. 431-438. [20] F. Torma, A. Grun, I. Bitter and K. Toth, “Calixarene/ Nafion-Modified Bismuth-Film Electrodes for Adsorp- tive Stripping Voltammetric Determination of Lead,” Electroanalysis, Vol. 21, No. 17-18, September 2009, pp. 1961-1969. [21] Solubility Products at 25˚C, 11/28/2007 http://www.csudh.edu/Oliver/chemdata/data-ksp.htm. [22] U. S Food and Drug Administration, “Interim Melamine and Analogues Safety/Risk Assessment,” 05/22/2009 http://www.fda.gov/ScienceResearch/SpecialToics/PeerRev iew of Scientific Information and Assessments/ucm 155012. Copyright © 2011 SciRes. AJAC  Y. C. ZHU ET AL. Copyright © 2011 SciRes. AJAC 618 htm. [23] J. T. Nwabanne and P. K. Igbokwe, “Kinetics and Equi- librium Modeling of Nickel Adsorption by Cassava Peel,” Journal of Engineering Applied Science, Vol. 3, No. 11, November 2008, pp. 829-834. |