American Journal of Anal yt ical Chemistry, 2011, 2, 573-581
doi:10.4236/ajac.2011.25065 Published Online September 2011 (http://www.SciRP.org/journal/ajac)
Copyright © 2011 SciRes. AJAC
Analysis of Sodium and Potassium in Total Parenteral
Nutrition Bags by ICP-MS and ICP-AES:
Critical Influence of the Ingredients
Nicolas Marie1, Claire Verdier1, Barbara Le Bot2, Gw en ol a Burg ot3
1Departme n t of Pharmacy , CHU de Rennes, Rennes, France
2LERES, Ecole des Hautes Etudes en Santé Publique, Rennes, France
3University of Rennes1, Faculty of Pharmacy, Rennes, France
E-mail: Gwenola.burgot@univ-rennes1.fr
Received June 2, 2011; revised July 1, 2011; accepted July 19, 2011
Abstract
The compounding of total parenteral nutrition solutions (TPN) in the hospital pharmacy is a high-risk activ-
ity for which a quality assurance programme is necessary. The complexity of parenteral nutrition solutions
containing almost 50 ingredients makes it difficult to measure each of them. On the other hand, the assay of
electrolytes such as sodium and potassium is accepted as a quality marker for estimating compounding errors.
Thus, the aim of this study was to estimate the influence of ingredients on the accuracy of assays of electro-
lytes. Experiments were performed with aqueous working simulated solutions of sodium and potassium pre-
pared by the addition of each nutrient step by step, (dextrose, amino acids, lipids, vitamins and trace ele-
ments). Sodium and potassium levels were measured by Inductively Coupled Plasma Mass Spectroscopy
(ICP-MS) and Atomic Emission Spectroscopy (ICP-AES). The performance of these methods was compared
using statistical evaluations (t-test and Mann–Whitney test).The study highlights the interference of amino
acids, vitamins and trace elements when measuring sodium, but no interference was noted during the meas-
urement of potassium. To reduce the risk and to improve the quality of compounding, we used an automated
compounding device but, even in this case, the acceptance criterion for sodium and potassium determination
was not <10%.
Keywords: Inorganic Cations, Electrolytes, Total Parenteral Nutrition, Atomic Emission Spectrometry
1. Introduction
The compounding of total parenteral nutrition (TPN)
solutions in the hospital pharmacy is a high-risk activity
for which a quality assurance programme is necessary
[1,2]. The complexity of parenteral nutrition solutions
containing almost 50 ingredients makes it difficult to
measure each of them. Some TPN automated compound-
ing device use electrical conductivity to check each solu-
tion type as it is transferred into the final bag [3]. But,
there is not the case for all of device and moreover, there
don’t measure the quantity of ingredients. On the other
hand, the assay of electrolytes such as sodium and potas-
sium is accepted as an end-product quality assurance
marker [4-7] with which to esti mate compounding errors
and moreover, the errors on them are potentially serious
clinical consequences [8].
There are some widely used analytical techniques for
sodium and potassium quantification that are based on
atomic emission spectrometry (flame photometry), in-
ductively coupled plasma atomic emission spectrometry
(ICP-AES) or quadrupole mass spectrometry (ICP-MS),
capillary electrophoresis coupled with indirect UV de-
tector or with capacitively coupled contactless conduc-
tivity detection, ion chromatography and electrochemical
methods with ion sensitive (selective) electrodes [9-16].
Some of them were developed for the analysis of inor-
ganic cations in pharmaceutical solutions and TPN such
as flame photometry, selective electrode and capillary
electrophoresis [5-7,17,18] but not always with success-
ful results [6,17,18]. These results would be reliable to
the fact that TPN have a high ionic force which product
seriously distorted results for methods function activity
and not concentratio n such as ion sensitive electrode.
574 N. MARIE ET AL.
At our knowledge, no stud y was carr ied with ICP-AES
or ICP-MS to determine the sodium and potassium con-
centration in TPN. ICP-AES and ICP-MS have found
popularity in many fields. Numerous methods were de-
veloped and validated to determine sodium and potas-
sium with ICP-AES and ICP-MS. These methods have
been shown to be very attractive since they require a low
sample volume and provide adequately low detection
limits and the possibility of measurements after just a
simple dilution step.
Also, it seems to us interesting to assess the perform-
ance of these methods with TPN and to estimate the in-
fluence of nutrient content on the accuracy of measure-
ment of the sodium and potassium concentration. The
overall aim is to improve the management process of
end-product release by the hospital pharmacist during
daily quality control.
2. Methods-Experimental Data
2.1. Reagents
All solutions were prepared with ultrapure water (18.2
Ohms) obtained b y passing tap w ater thr ough an RiO s 30
osmoseur and Milli-Q Gradient system (Millipore, St
Quentin en Yvelines, France).
Acids were purchased from Carlo Erba (Val de Reuil,
France): Hydrochloric acid was 34% - 37% superpure
quality and nitric acid was 67% - 69% super pure quality.
Standard solutions of Na (1 g·L–1 in 0.07% HNO 3) and
K (1 g·L–1 in 0.1% HNO3) were purchased from Analab
(Bischeim, France).
Water certified reference material from the National
Institute of Standards and Technology (NIST 1643) was
purchased from Techlab (Metz, France).
2.2. Samples
The composition of all components used for the paren-
teral nutrition solution is given in Table 1. We used 20%
sodium chloride solutions and 20% potassium chloride
solutions, a commercial source of amino acid infusions:
Vintène® (20 g·L–1 of nitrogen) and V aminolact® (9.3 g·L–1
of nitrogen) and dextrose infusion solutions (D50%). Fat
accounted for 30% of the standard distribution of non-
protein calories. Intravenous fat emulsions are made from
vegetal oil and the phospholipids of eggs. In this study,
we used Clinoléic® 20%. Calcium gluconate injection 10%
is the preferred form of calcium used in multicomponent
parenteral nutrition formulations. Magnesium was used
as a 15% magnesium sulphate injection. Phosphate was
purchased as glycerophosphate sodium in Phocytan®.
The composition of trace elements and vitamins is given
in Table 1.
Table 1. Qualitative and quantitative composition of reactives [19].
Amino acid solutions
Vintène® Vaminolact®
L-Alanine 1.3 g 0.63 g
L-Arginine 1.5 g 0.41 g
L-Aspartic acid 0.3 g 0.41 g
L-Cysteine chlo rhydrate 0.2 g 0.1 g
Glutamic acid 0.5 g 0.71 g
Glycine 0.92 g 0.21 g
L-Histidine 0.4 g 0.21 g
L-Isoleucine 0.7 g 0.31 g
L-Leucine 1.4 g 0.7 g
L-Lysine 1 g 0.56 g
L-Methionine 0.7 g 0.13 g
L-Ornithine chlorhydrate 0.1275 g 0
L-Phenylalanin e 0.9 g 0.27 g
L-Proline 1.1 g 0.56 g
L-Serine 0.3 g 0.38 g
L-Threonine 0.55 g 0.36 g
L-Tryptophan 0.25 g 0.14 g
L-Tyrosine 0.04 g 0.05 g
L-Valine 0.7 g 0.36 g
L-Taurine 0 0.03 g
Water for inje c t i on To 100 mL To 100 mL
Total nitrogen 20 g·L–1 9.3 g·L–1
Osmolarity 1140 mOsm·L–1 476 mOsm·L–1
Manufacturer Baxter Fresenius Kabi France
Excipients sodium hydrosulphite,
acetic acid, [Na+] = 0.32 g·L–1 water for injectable preparations
[Na+]a < 2 mg·L–1 ; [K+] a < 2 mg·L–1
Copyright © 2011 SciRes. AJAC
N. MARIE ET AL.
Copyright © 2011 SciRes. AJAC
575
Dextrose solutions: Dextrose 50%
Anhydrous dextrose 500 g
Water for i n j ection to 1000 mL
pH 3.6
Caloric intake 2000 kcal·L–1
Osmolarity 2775 mOsm·L–1
Manufacturer Aguettant
Lipids = Clinoléic®
Refined olive oil 16 g
Refined soya oil 4 g
Water for i njection to 100 mL
Excipients egg phosphatide, glycerol, sodium
oleate and sodium hydroxide
Osmolarity of dispersive phase
Caloric intake
270 mOsm·L–1
2000 kcal·L–1
Manufacturer Baxter
Electrolytes Manufacturer
Calcium gluconate 10% 10 mL [Ca2+] = 0.22 mol·L–1 Renaudin
NaCl 20% 500 mL [Na+] = [Cl¯] = 3.42 mol·L–1 Renaudin
KCl 20% 500 mL [K+] = 2.68 m ol · L–1 Renaudin
Magnesium sulphate 15% 10 mL [Mg²+] = 0.6 1 mol·L–1 Renaudin
Phocytan® 100 mL [Na+]a = 0.66 mol·L–1
[dextrose] = 0.33 mol·L–1
[phosphates] = 0.33 mol·L–1
Aguettant
Decan® per vial (40 mL)
Gluconate ferreux
dihydrate 8.64 mg
Copper gluconate 3.4 mg
Manganese gluconate
dihydrate 1.62 mg
Zinc gluconate trihydrate 77.96 mg
Fluorure sodium 3.2 mg
Cobalt gluconate 12.1 µg
Selenite sodium 233.2 µg
Sodium iodure 1.8 µg
Chrome chlorure
hexahydrate 76.8 µg
Ammonium molybdate
tetrahydrate 46 µg
Osmolarity 17.6 mOsm·L–1
Sodiuma 1.86 mg
Potassiuma < 80 µg
Manufacturer Aguettant
Excipients water for injection,
glucono delta lactone
avalue determin ed by ICP-AES in our laboratory
Cernevit ® per vial 5 mL (lyophilisate)
Vitamin A 3500 UI
Vitamin B1 3.51 mg
Vitamin B2 4.14 mg
Vitamin B5 17.25 mg
Vitamin B6 4.53 mg
Vitamin B8 0.069 mg
Vitamin B9 0.414 mg
Vitamin B12 0.00 6 mg
Vitamin C 125 mg
Vitamin D2
Vitamin D3 220 UI
Vitamin E 11.2 UI
Vitamin K1
Vitamin PP 46 mg
Sodiuma 22.84 mg
Potassiuma < 10 µg
Manufacturer Baxter
avalue determined by ICP-AES in our laboratory
N. MARIE ET AL.
Copyright © 2011 SciRes. AJAC
576
Working solutions or simulated electrolyte solutions
were prepared in the laboratory by mixing a fixed so-
dium chloride and potassium chloride concentration
(Table 2) with each nutrient likely to interfere step by
step. Mixing is made manually or automated compound-
ing device BAXA®; for each nutrient, the ratios of con-
centration were in the same proportion as in typically
prescribed parenteral nutrition solutions. The standard
distribution of non-protein calories is 70% as carbohy-
drate and 30% as fat.
2.3. Preparation of Standards and Diluted
Samples
Standard calibration solutions were prepared from 1 g·L–1
single elements by mixture and dilution in ultrapure wa-
ter acidified with 1% HNO3 and 0.5% HCl. Sequential
dilution was performed and five different concentration
levels were obtained as follows: 0, 2, 5, 10, 25˚ and 50
mg·L–1 for ICP-AES extern al calibration quantification.
Samples were diluted to 1/50, 1/100 and 1/200 with
ultrapure water acidified with 1% HNO3 and 0.5% HCl.
Standard added procedure analysis consisted of adding
2.5 ml of Na (1g·L–1) and 2.5 ml of K (1g·L–1) to 100 ml
of sample. After three sequential dilutions of this added
sample (2/5; 1/5; 2/25), the resulting four samples and a
control sample were analysed in ICP-AES. Calibration
curves were used to quantify the sample.
2.4. Instrumentation
2.4.1. ICP-MS
An Agilent 7500ce ORS ICP-MS system equipped with
an auto sampler (CETAC ASX-510), a micro flow nebu-
lizer, a Scott chamber and a quartz ICP torch was used.
During the analysis the following procedure was fol-
lowed: optimization of the instrument, calibration with
the standard solutions, analysis of the sample blank con-
sisting of 1% nitric acid and 0.5% chlorhydric acid,
analysis of the refere nce material (NIST 1643 ), and sam-
ples with one level calibration point and a blank after
every 10 samples. The isotopes and gas reaction mode
were as follows: for Na analysis, mass 23 (mode helium),
and for K analysis, mass 39 (mode helium)
Samples were quantified with ICP-MS with external
calibration on a 1/200 sample dilution. The ICP-MS op-
erating conditions and measurement parameters are
given in Table 3.
Table 2. Preparation of the working solutions.
N˚
mixture [Na+]
(mmol·L–1)
Volume
NaCl 20%
(mL)
[K+]
(mmol·L–1)
Volume
KCl 10%
(mL)
N
(g·L–1)
Volume
Vintène
(mL)
Lipids
(g·L–1)
Volume
Clinoleic
(mL)
Dextrose
(g·L–1)
Volume
D50%
(mL)
Volume
Cernevit
(mL)
Volume
TE
(mL) Water
ions 1 50 1.46 10 0.7460 0 0 0 0 0 0 0 To 100 mL
ions + Da 2 50 1.46 10 0.7460 0 0 0 150 30 0 0 To 100 mL
ions + AAa 3 50 1.46 10 0.7464 20 0 0 0 0 0 0 To 100 mL
ions + La 4 50 1.46 10 0.7460 0 4020 0 0 0 0 To 100 mL
ions + Da+ AAa 5 50 1.46 10 0.7464 20 0 0 150 30 0 0 To 100 mL
ions + Da + La 6 50 1.46 10 0.7460 0 4020 150 30 0 0 To 100 mL
ions + AAa+ La 7 50 1.46 10 0.7464 20 4020 0 0 0 0 To 100 mL
ions + Da +
AAa
+ La = ternaire 8 50 1.46 10 0.7464 20 4020 150 30 0 0 To 100 mL
ternaire + Vita
+ TEa 9 50 1.46 10 0.7464 20 4020 150 30 5 20 To 100 mL
aD = dextrose, AA = amino acids, L = lipids, vit = vitamins, TE = trace elements
Table 3. ICP-MS operating conditions and measurement parameters.
Rf generator
Rf power
Sampling depth
Carrier gas flow rate (Ar)
Auxiliary (make up) gas fl ow rate (Ar)
He gas flow rate
Integration time
Nebulizer pump
Acquisition mode
Quadruple bias
27.12 MHz
1550 W
8.2 mn
0.8 L·min–1
0.28 L·min–1
5 ml·min–1
0.1 s
0.08 rps
He mode
–3 (V)
N. MARIE ET AL.
Copyright © 2011 SciRes. AJAC
577
2.4.2. ICP-AES
An Activa instrument (Horiba Jobin Yvon, Longjumeau,
France) equipped with an autosampler AS500 (Horiba
Jobin Yvon, Longjumeau, France), a tangential nebulizer
(Miramist Peek Body), a cyclonic spray chamber, a ra-
dial torch, a Czerny-Turner monochromator, and an op-
tical path purged with nitrogen was used. The daily cali-
bration of the monochromator was performed by using
the carbon emission lines and each operating wavelength
was individually centred before the experiment began.
Three wavelengths were cho sen for Na analysis: 330.23 7,
588.995 and 589.592 nm and two wavelengths for K
analysis: 766.49 and 769.898 nm. The ICP-AES operat-
ing conditions are given in Table 4.
Samples were quantified with ICP-AES three times,
first with external calibration of the 1/50 sample dilution ,
and then with the standard added procedure on the 1/50
sample dilution and 1 /100 sample dilution.
The performance of the methods was compared using
statistical evaluations: t-test and Mann–Whitney test. A
maximum risk of 5% of the measures outside the accep-
tance limits was considered statistically significan t.
3. Results and Discussion
In the first experiment, we compare the quality of the re-
sults obtained from the vials of sodium chloride and po-
tassium chloride used for compounding parenteral nutri-
tion diluted using manually laboratory practice and using
the automated compounding system BAXA®.
This step is followed by a dilution in ultrapure water
acidified with 1% HNO3 and 0.5% HCl according the
ICP-MS procedure currently used by our laboratory (LE-
RES). The volume of sample, sodium chloride and po-
tassium chloride solution, is very weak. Thus, it doesn’t
affect the ability of the ICP-MS method to provide accu-
rate results.
In this case, the total measurement error of the results
is related to the trueness of the manufacturing products,
the dilution for working solutions and for ICP-MS pro-
cedure and the error on the analytical procedure.
The results obtained by ICP-MS are given in Table 5.
We also tested a solution of Phocytan®, which contains
glycerophosphate sodium and a blend of sodium chloride
or glycerophosphate solutions with potassium chloride
solution, to determine whether or not these solutions in-
terfere with the quality of the results.
The results show that the analytical performance, in
terms of trueness and precision, was identical for the
solutions prepared by each method (manually with labo-
ratory instruments or automated compounding system
BAXA®). The results are shown as the average obtained
after measuring the sample five times. Table 5 shows
that the bias was between –2.6 and 2.1% and the preci-
sion range was <1.6%, which means that the measure-
ment of electrolytes showed sufficient accuracy for the
determination of sodium and potassium in our study with
step by step complement. The results obtained on mix-
tures of sodium and potassium are also consistent with a
bias of between –3.4% and 0.2% and a precision range
between 1% and 5%.
Table 6 shows the results obtained for working solu-
tions prepared by mixing some fixed sodium and potas-
sium concentrations (50 mmol·L–1 and 10 mmol·L–1 re-
spectively) with each nutrient likely to interfere step by
step. The sodium and potassium concentrations were
carefully chosen as the most frequently used in our total
parenteral nutrition compounding The nutrients were
added one by one and then mixed. For these determina-
tions, we tested the performance of four analytical
methods: external calibration ICP-AES (dilution 1/50),
spiked ICP-AES with two dilutions (1/100 and 1/50) and
Table 4. ICP-AES operating conditions and measurement parameters.
ICP-source
Power
Argon flow rate
Coating gas flow rate
Generator type
Monochromateur
Wavelength range
Optical bench temperature
Focal length
Grating number 1
Grating number 2
Entrance slit 1
Entrance slit 2
Nitrogen flow r ate
1000 W
12 L·min–1
0.2L·min–1
JY 2501
165 - 800 nm
31.5˚C
0.64 m
4343 grooves·mm–1
2400 grooves·mm–1
10 µm
20 µm
3 L·min–1
578 N. MARIE ET AL.
Table 5. Sodium and potassium levels measured by ICP-MS.
Pharmaceutical product NaCl vial
78.66 g·L–1 KCl vial
52.42 g·L–1
NaCl contained in
Phocytan
15.18 g·L–1
NaCl vial
+
KCl vial
NaCl contained in phocytan
+
KCl vial
Ion assay Theorical value
of diluted solution ( mg·L–1) Na
1150
K
391
Na
1150
Na
1150
K
391
Na
1150
K
391
manually compounded with analytical instrumentation
Mean
S.D.
CV
Bias
1136
18
1.58
–1.15
399
5.11
1.28
2.09
1149
10.21
0.88
–0.75
1113
49.81
4.47
–3.15
382
18.42
4.81
–2.15
1151
18.38
1.59
0.12
391
6.31
1.6
0.2
Baxa® compounded
Mean
S.D.
CV
bias
1162
18.36
1.58
1.11
381
5.81
1.52
–2.51
1167
8.07
0.69
1.48
1120
6.8
0.61
–2.57
377
2.13
0.56
–3.37
1143
9.68
0.85
–0.59
379
6.09
1.6
–3.1
ICP-MS (dilution 1/200). No difference was observed
between the four methods according to the Student and
Mann–Whitney test, although better results appeared to
be obtained by external calibration ICP-AES (dilution
1/50).
The results obtained by these four methods (Table 6)
highlight the interference of amino acids, vitamins and
trace elements in sodium determination, but no interfer-
ence was noted in the potassium assay. The error was
only systematic since all precision results were correct.
Student and Mann–Whitney tests confirmed this hy-
pothesis. These studies indicate that potassium assay is a
better marker for quality insurance.
We also considered the composition of bulk products.
Vintene® solution contains 14 mmol·L–1 of sodium ac-
cording to available technical information [20]. The de-
termination of sodium by ICP-AES confirmed that the
quantity of sodium in the solution of amino acids
(Vaminolact®) is negligible <2 mg·L–1. For vitamins
(Cernevit®) and trace elements (Decan®) the sodium
content is much higher, with 22.84 mg in each 5 ml vial
of Cernevit® and 1.86 mg in each 40 ml vial of Decan®.
As a result, the bias in the determination o f so d ium in the
mixes containing vitamins and trace elements was wrong,
at 19.71% instead of –0.96% after correction. The proble m
was the same with the Vintene® solutions.
Using these values for correcting the results of Table
6, trueness was improved and was always smaller than
6.1%. We thus recommend estimating the content of
sodium and potassium in pharmaceutical supplies before
building an analytical procedure to control the quality of
parenteral nutrition solutions. We have noted in a previ-
ous study the same problem fo r the determination of cal-
cium in TPN [21].
Moreover, we also tested the impact of ultrafiltration
on the performance of the methods owing to the fact
TPN contains lipids. No significant difference was noted
(Table 7).
The value of the acceptability limit is not arbitrary but
depends on the objectives of the analytical procedure.
For instance, when expressed as a percent of the target
value, it may be 1% for bulk materials, 5% for the activ e
ingredient in an end-product pharmaceutical, and 15%
for biological samples [22-24]. The difficulty in defining
the acceptability criterion for parenteral nutrition solu-
tions comes from the fact that the solution is an extem-
poraneously pharmaceutical preparation that is as com-
plex as biological samples. In fact, some authors take as
the acceptability criterion for the assay of electrolytes at
+/–15%. According to our results we consider that it
would be possible to define the acceptability criterion for
the assay of electrolytes by ICP-MS and ICP-AES at
+/–10%. Ehling et al. [25] had given the same value of
acceptability limit for measure of sodium in foods by
ICP-MS.
4. Conclusions
The compounding of total parenteral nutrition solutions
in the hospital pharmacy is a high-risk activity. The
management process of preparation release involves the
routine analysis of electrolytes that are good quality
markers for the overall compounding practice. Moreover,
they are a key component of a quality assurance pro-
gramme because their variability may be responsible for
severe problems in patients.
Our study highlights the need to verify the effect of the
contents of the pharmaceutical supplies on the results.
Copyright © 2011 SciRes. AJAC
N. MARIE ET AL.
Copyright © 2011 SciRes. AJAC
579
Table 6. Levels of sodium and potassium measured by ICP-AES and ICP-MS in experiments in which each nutrient was
added step by step.
ICP AES External
Calibration
1/50 dilution
ICP AES
Standard added
1/100 dilution
ICP AES
Standard added
1/50 dilution
ICP MS
External calbration
1/200 dilution
Compounds Theoretical val ue
(mg·L-1) Na
1150 K
391 Na
1150 K
391 K
391 Na
1150 K
391
Ions + water for
injection
Mean (mg·L-1)
SD
RSD
bias
1092.37
19.64
1.80
–5.01
366.5
3.54
0.96
–6.27
1210
30.00
2.48
5.22
386.5
9.19
2.38
–1.15
397.5
10.61
2.67
1.66
1157
0.61
368
–5.88
Ions + dextrose
(150 g·L–1)
Mean (mg·L-1)
SD
RSD
bias
1094.37
11.41
1.04
–4.84
363.8
2.47
0.68
–6.97
1206.67
15.28
1.27
4.93
377.5
14.85
3.93
–3.45
384
2.12
0.55
–1.79
1164
1.22
378
–3.32
Ions + AAa
(4 g·L–1)
Mean (mg·L-1)
Mean corrected
SD
RSD
Bias
Bias corrected
1192.98
1128.58
10.26
0.86
3.74
–1.86
370
-
1.41
0.38
–5.37
-
1256.67
1192.27
41.63
3.31
9.28
3.68
368
-
7.07
1.92
–5.88
-
381.75
8.84
2.32
–2.37
-
1238
1173.6
7.65
2.05
375
-
–4.09
-
Ions + Lipids
(40 g·L–1)
Mean (mg·L-1)
SD
RSD
bias
1179.7
37.85
3.21
2.58
376
7.07
1.88
–3.84
1206.67
15.28
1.27
4.93
378.5
6.36
1.68
–3.20
397
4.95
1.25
1.53
1172
1.91
380
–2.81
Ions + Da(150 g/L)
+ AA (4 g/L)
Mean (mg·L-1)
Mean corrected
SD
RSD
Bias
Bias corrected
1204.08
1139.7
13.17
1.09
4.70
–0.9
373.5
-
0.71
0.19
–4.48
-
1276.67
1212.27
20.62
1.63
11.01
5.41
386.5
-
4.95
1.28
–1,15
401.75
-
4.60
1.14
2.75
-
1250
1185.6
8.7
3.1
375
–4.09
-
Ions + Da (150 g·L–1)
+ Lipids (40 g·L–1)
Mean (mg·L-1)
SD
RSD
bias
1154.43
8.04
0.70
0.39
379
0.71
0.19
–3.07
1183.33
28.87
2.44
2.90
370
15.56
4.20
–5.37
389.75
4.60
1.18
–0.32
1211
5.3
384
–1.79
Ions + vita + TEa
Mean (mg·L-1)
Mean corrected
SD
RSD
Bias
Bias corrected
1376.68
1138.98
10.62
0.77
19.71
–0.36
373
-
3.54
0.95
–4.60
-
1400.00
1162.3
34.64
2.47
21.74
1.07
368
-
8.49
2.31
–5.88
-
389.5
-
4.95
1.27
–0.38
-
1355
1117.3
17.83
–7.84
365
-
6.65
-
Ions + AAa (4 g/L)
+ lipids (40 g/L)
Mean (mg·L-1)
Mean corrected
SD
RSD
Bias
Bias corrected
1255.98
1191.58
6.02
0.46
9.22
3.62
383.8
-
1.06
0.28
–1.85
-
1273.33
1208.93
40.11
3.17
10.72
5.12
381.5
-
17.88
4.63
–2.43
-
399.25
-
4.60
1.15
2.11
-
1282
1217.6
11.48
5.88
388
-
–0.77
-
Ions + Da + AA + lipids
Mean (mg·L-1)
Meancorrected
SD
RSD
Bias
Bias corrected
1240.55
1176.15
11.28
0.91
7.87
2.27
380
-
0
0
–2.81
-
1293.33
1228.93
28.87
2.23
12.46
6.86
373
-
7.07
1.90
–4.60
-
391.25
-
1.06
0.27
0.06
-
1256
1191.6
9.22
3.62
384
-
–1.79
-
Ions + Da (150 g·L–1)
+ AAa (4 g·L-1)+ lipids (40
g·L–1)+ vita + TEa
Mean (mg·L-1)
Mean corrected
SD
RSD
Bias
Bias corrected
1462.18
1160.08
16.63
1.14
27.15
0.88
375.5
-
0.71
0.19
–3.96
-
1516.67
1214.57
51.32
3.38
31.88
5.61
362.5
-
10.61
2.93
–7.29
-
374.25
-
3.89
1.04
–4.28
-
1521
1218.9
32.26
6
413
-
5.63
-
aD = dextrose, AA = amino acids, L = lipids, vit = vitamins, TE = trace elements
580 N. MARIE ET AL.
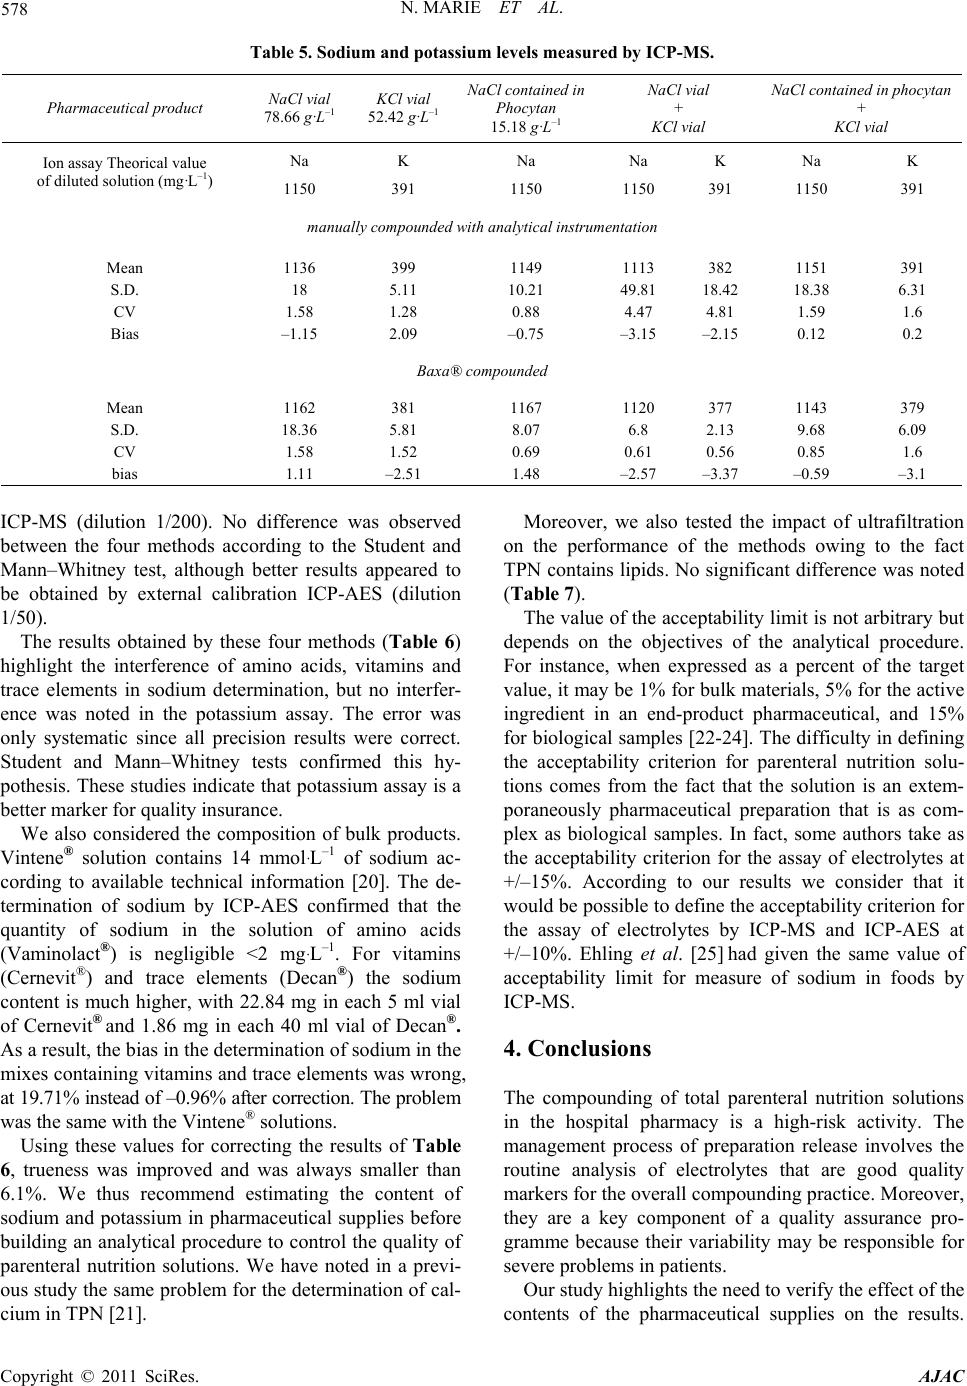
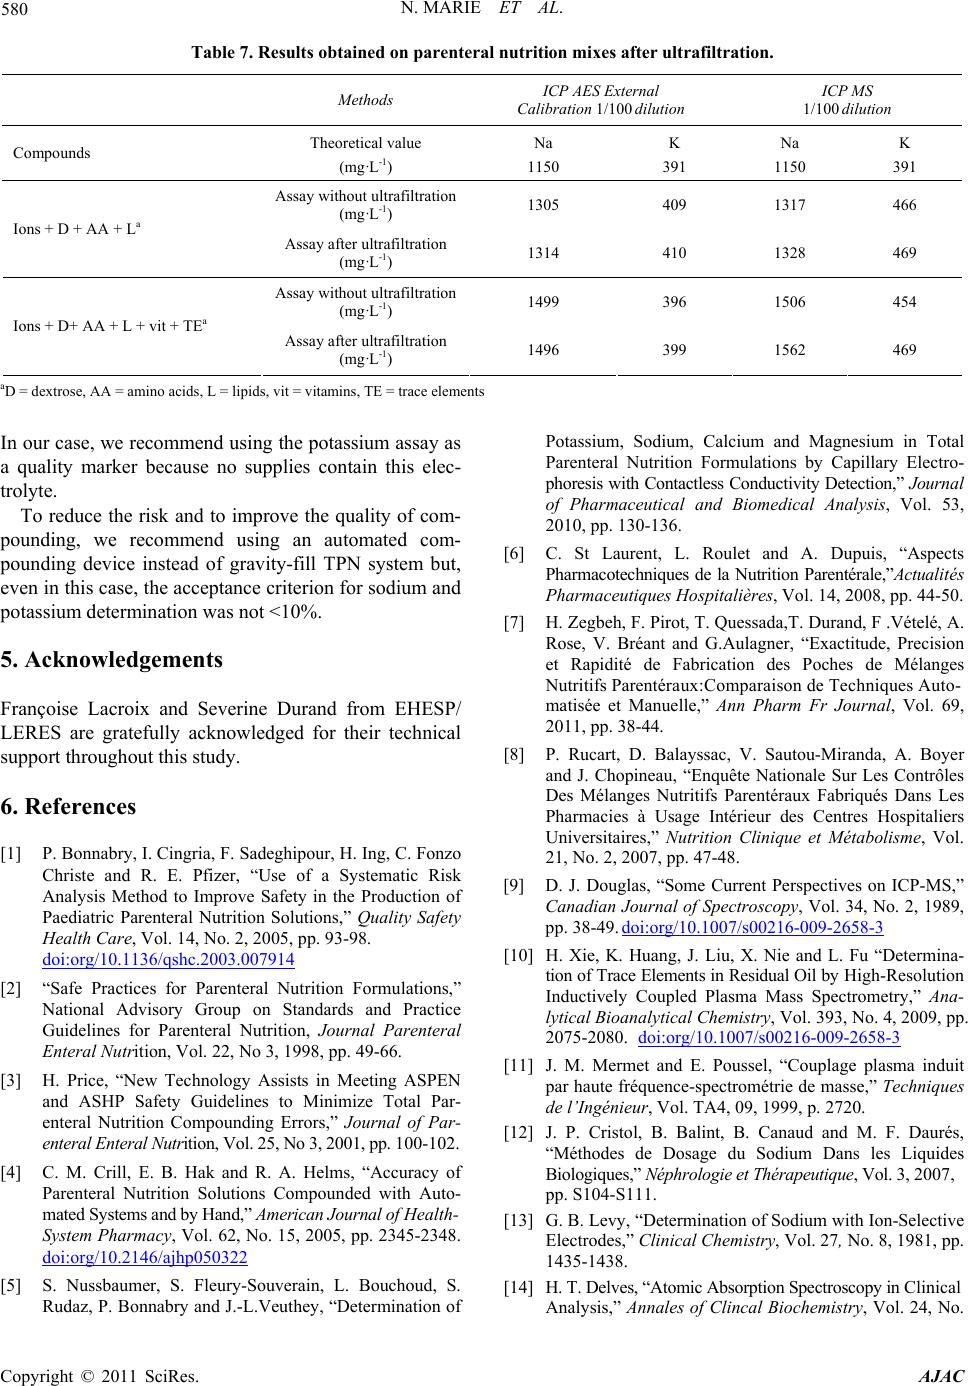
Table 7. Results obtained on parenteral nutrition mixes after ultrafiltration.
Methods ICP AES External
Calibration 1/100 dilution ICP MS
1/100 dilution
Compounds Theoretical value
(mg·L-1)
Na
1150
K
391
Na
1150
K
391
Assay without ultrafiltration
(mg·L-1) 1305 409 1317 466
Ions + D + AA + La Assay after ultrafiltration
(mg·L-1) 1314 410 1328 469
Assay without ultrafiltration
(mg·L-1) 1499 396 1506 454
Ions + D+ AA + L + vit + TEa Assay after ultrafiltration
(mg·L-1) 1496 399 1562 469
aD = dextrose, AA = amino acids, L = lipids, vit = vitamins, TE = trace elements
In our case, we recommend using the potassium assay as
a quality marker because no supplies contain this elec-
trolyte.
To reduce the risk and to improve the quality of com-
pounding, we recommend using an automated com-
pounding device instead of gravity-fill TPN system but,
even in this case, the acceptance criterion for sodium and
potassium determination was not <10%.
5. Acknowledgements
Françoise Lacroix and Severine Durand from EHESP/
LERES are gratefully acknowledged for their technical
support throughou t this study.
6. References
[1] P. Bonnabry, I. Cingria, F. Sadeghipour, H. Ing, C. Fonzo
Christe and R. E. Pfizer, “Use of a Systematic Risk
Analysis Method to Improve Safety in the Production of
Paediatric Parenteral Nutrition Solutions,” Quality Safety
Health Care, Vol. 14, No. 2, 2005, pp. 93-98.
doi:org/10.1136/qshc.2003.007914
[2] “Safe Practices for Parenteral Nutrition Formulations,”
National Advisory Group on Standards and Practice
Guidelines for Parenteral Nutrition, Journal Parenteral
Enteral Nutrition, Vol. 22, No 3, 1998, pp. 49-66.
[3] H. Price, “New Technology Assists in Meeting ASPEN
and ASHP Safety Guidelines to Minimize Total Par-
enteral Nutrition Compounding Errors,” Journal of Par-
enteral Enteral Nutrit i o n, V ol . 2 5, No 3 , 2001, pp. 100-102.
[4] C. M. Crill, E. B. Hak and R. A. Helms, “Accuracy of
Parenteral Nutrition Solutions Compounded with Auto-
mated Systems and by Hand,” American Journal of Health-
System Pharmacy, Vol. 62, No. 15, 2005, pp. 2345-2348.
doi:org/10.2146/ajhp050322
[5] S. Nussbaumer, S. Fleury-Souverain, L. Bouchoud, S.
Rudaz, P. Bonnabry and J.-L.Veuthey, “Determination of
Potassium, Sodium, Calcium and Magnesium in Total
Parenteral Nutrition Formulations by Capillary Electro-
phoresis with Contactless Conduc tivity Detection,” Journal
of Pharmaceutical and Biomedical Analysis, Vol. 53,
2010, pp. 130-136.
[6] C. St Laurent, L. Roulet and A. Dupuis, “Aspects
Pharmacotechniques de la Nutrition Parentérale,”Actualités
Pharmaceutiques Hospitalières, Vol. 14, 2008, pp. 44-50.
[7] H. Zegbeh, F. Pirot, T. Quessada,T. Durand, F .Vételé, A.
Rose, V. Bréant and G.Aulagner, “Exactitude, Precision
et Rapidité de Fabrication des Poches de Mélanges
Nutritifs Parentéraux :C omp a rai so n de Te ch ni que s Aut o -
matisée et Manuelle,” Ann Pharm Fr Journal, Vol. 69,
2011, pp. 38-44.
[8] P. Rucart, D. Balayssac, V. Sautou-Miranda, A. Boyer
and J. Chopineau, “Enquête Nationale Sur Les Contrôles
Des Mélanges Nutritifs Parentéraux Fabriqués Dans Les
Pharmacies à Usage Intérieur des Centres Hospitaliers
Universitaires,” Nutrition Clinique et Métabolisme, Vol.
21, No. 2, 2007, pp. 47-48.
[9] D. J. Douglas, “Some Current Perspectives on ICP-MS,”
Canadian Journal of Spectroscopy, Vol. 34, No. 2, 1989,
pp. 38-49. doi:org/10.1007/s00216-009-2658-3
[10] H. Xie, K. Huang, J. Liu, X. Nie and L. Fu “Determina-
tion of Trace Elements in Re sidual Oil by H i g h- R e so l u ti o n
Inductively Coupled Plasma Mass Spectrometry,” Ana-
lytical Bioanalytical Chemistry, Vol. 393, No. 4, 2009, pp.
2075-2080. doi:org/10.1007/s00216-009-2658-3
[11] J. M. Mermet and E. Poussel, “Couplage plasma induit
par haute fréquence-spectrométrie de masse,” Techniques
de l’Ingénieur, Vol. TA4, 09, 1999, p. 2720.
[12] J. P. Cristol, B. Balint, B. Canaud and M. F. Daurés,
“Méthodes de Dosage du Sodium Dans les Liquides
Biologiques,” Néphrologie et Thérapeutique, V ol . 3, 2007,
pp. S104-S111.
[13] G. B. Levy, “Determination of Sodium with Ion-Selective
Electrodes,” Clinical Chemistry, Vol. 27, No. 8, 1981, pp.
1435-1438.
[14] H. T. Delves, “Atomic Absorption Spectroscopy in Clinical
Analysis,” Annales of Clincal Biochemistry, Vol. 24, No.
Copyright © 2011 SciRes. AJAC
N. MARIE ET AL.
581
11, 1987, pp. 529-551.
[15] J. S. Fritz, “Recent Developments in the Separation of
Inorganic and Small Organic Ions by Capillary Electro-
phoresis,” Journal of Chromatograph A, Vol. 884, 2000,
pp. 261-275.
[16] A. J. Zemann, “Capacitively Coupled Contactless Con-
ductivity Detection in Capillary Electrophoresis,” Elec-
trophoresis, Vol. 24, 2003, pp. 2125-2137.
[17] M. Koberda, M. Konkowski, P. Youngberg, W. R. Jones
and A. Weston, “Capillary Electrophoretic Determination
of Alkali and Alkaline-Earth Cations in Various Multiple
Electrolyte Solutions for Parenteral Use,” Journal of
Chromatograph A, Vol. 602, No. 1-2, 1992, pp. 235-240.
[18] Q. Yang, M. Jimidar, T. P. Hamoir, J. Smeyers-Verbeke
and D. L. Massart, “Deter mination of Alkali and Alkaline
Earth Metals in Real Samples by Capillary Ion Analysis,”
ournal of Chromatograph A, Vol. 673, No. 2, 1994, pp.
275-285.
[19] Vidal, “Monographies des Médicaments,” OVP- éditions
du Vidal, Paris, 2010.
[20] RCP “Technical Information VINTENE®,” OVP-éditions
du Vidal, Paris, 2010.
[21] M. A. Lester, C. Verdier, A. Jary and G. Burgot, “Analy-
sis of Calcium in Total Parenteral Nutrition Bags: Critical
Influence of the Ingredient,” European Journal of Hospi-
tal Pharmacy Science, Vol. 16, No. 2, 2010, pp. 48-52.
[22] Directive 2009/53/CE du Parlement Européen et du
Conseil du 18 juin 2009. Journal Official Européen du 30
juin 2009.
[23] M. Feinberg, “LaboStat, Guide de Validation des Mé-
Thodes D’Analyse,” Lavoisier, Paris,Tec et Doc, 2009.
[24] E. Rozet, V. Wascotte, N. Lecouturier, V. Preat, W.
Dewe, B. Boulanger and Ph. Hubert, “Improvement of
the Decision Efficiency of The Accuracy Profile by
Means of a Desirability Function for Analytical Methods
Validation: Application to a Diacetyl-Monoxime Colori-
metric Assay Used for the Determination of Urea in
Transdermal Iontophoretic Extracts,” Analytical Chemis-
try Acta, Vol. 591, No. 5, 2007, pp. 239-247.
[25] S. Ehling, S. Tefera, R. Earl and S. Cole, “Evaluation of
Performance of Analytical Methods for Sodium in Foods
with Low Sodium Concentration,” Abstracts of paper,
238th ACS National Meeting, Washington DC, United
States, August 16-20, 2009.
Copyright © 2011 SciRes. AJAC