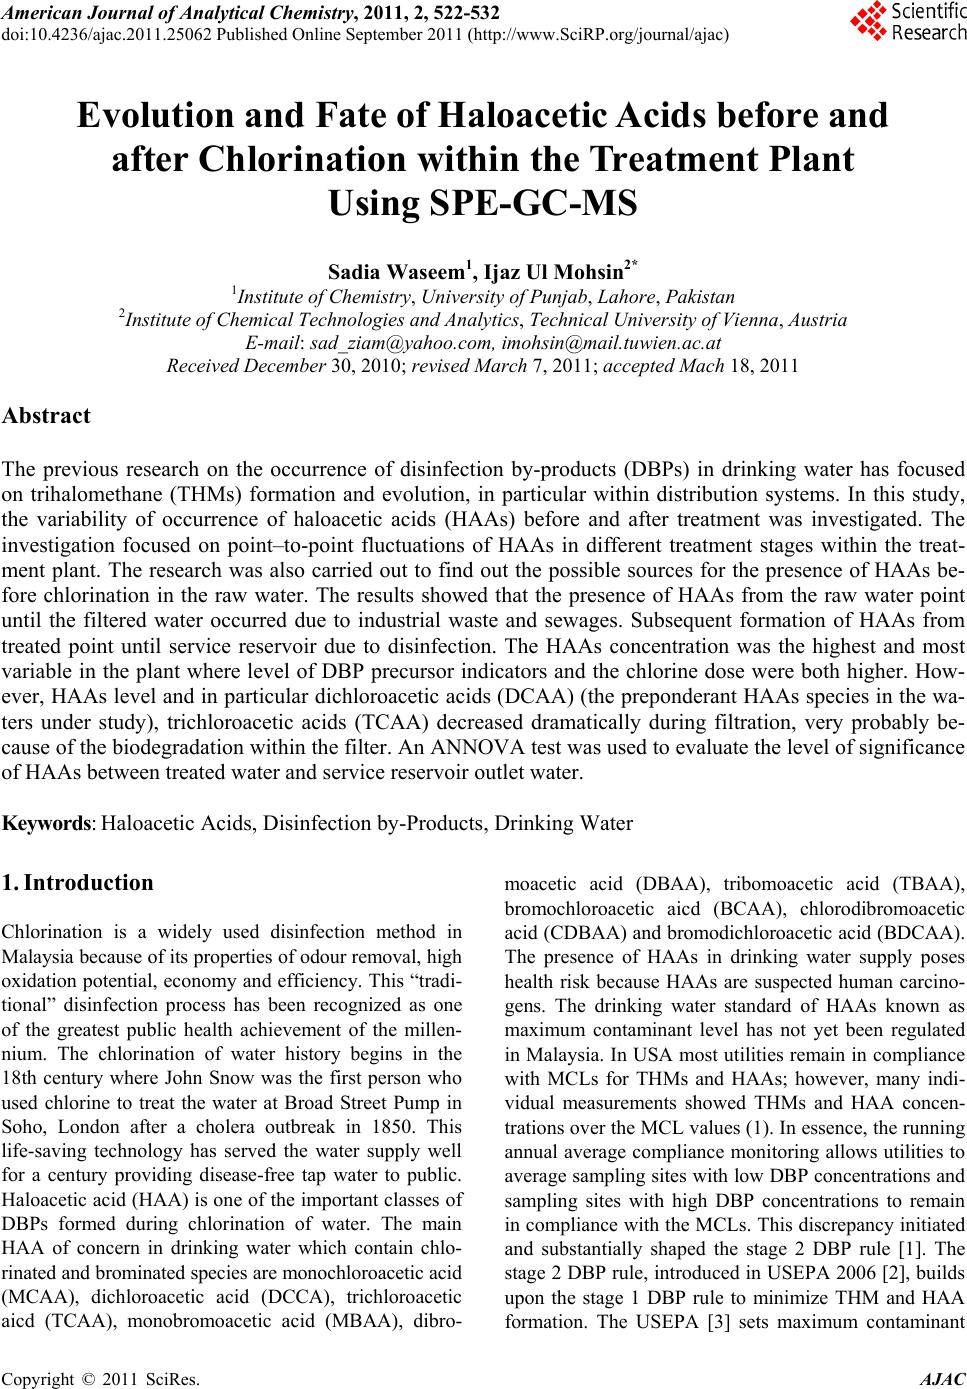
 American Journal of Anal yt ical Chemistry, 2011, 2, 522-532 doi:10.4236/ajac.2011.25062 Published Online September 2011 (http://www.SciRP.org/journal/ajac) Copyright © 2011 SciRes. AJAC Evolution and Fate of Haloacetic Acids before and after Chlorination within the Treatment Plant Using SPE-GC-MS Sadia Waseem1, Ijaz Ul Mohsin2* 1Institute of Chemistry, University of Punjab, Lahore, Pakistan 2Institute of Chemical Technologies and Analytics, Technical University of Vienna, Austria E-mail: sad_ziam@yahoo.com, imohsin@mail.tuwien.ac.at Received December 30, 2010; revised March 7, 2011; accepted Mach 18, 2011 Abstract The previous research on the occurrence of disinfection by-products (DBPs) in drinking water has focused on trihalomethane (THMs) formation and evolution, in particular within distribution systems. In this study, the variability of occurrence of haloacetic acids (HAAs) before and after treatment was investigated. The investigation focused on point–to-point fluctuations of HAAs in different treatment stages within the treat- ment plant. The research was also carried out to find out the possible sources for the presence of HAAs be- fore chlorination in the raw water. The results showed that the presence of HAAs from the raw water point until the filtered water occurred due to industrial waste and sewages. Subsequent formation of HAAs from treated point until service reservoir due to disinfection. The HAAs concentration was the highest and most variable in the plant where level of DBP precursor indicators and the chlorine dose were both higher. How- ever, HAAs level and in particular dichloroacetic acids (DCAA) (the preponderant HAAs species in the wa- ters under study), trichloroacetic acids (TCAA) decreased dramatically during filtration, very probably be- cause of the biodegradation within the filter. An ANNOVA test was used to evaluate the level of significance of HAAs between treated water and service reservoir outlet water. Keywords: Haloacetic Acids, Disinfection by-Products, Drinking Water 1. Introduction Chlorination is a widely used disinfection method in Malaysia because of its properties of odour removal, high oxidation potential, economy and efficiency. This “tradi- tional” disinfection process has been recognized as one of the greatest public health achievement of the millen- nium. The chlorination of water history begins in the 18th century where John Snow was the first person who used chlorine to treat the water at Broad Street Pump in Soho, London after a cholera outbreak in 1850. This life-saving technology has served the water supply well for a century providing disease-free tap water to public. Haloacetic acid (HAA) is one of the important classes of DBPs formed during chlorination of water. The main HAA of concern in drinking water which contain chlo- rinated and brominated species are monochloroacetic acid (MCAA), dichloroacetic acid (DCCA), trichloroacetic aicd (TCAA), monobromoacetic acid (MBAA), dibro- moacetic acid (DBAA), tribomoacetic acid (TBAA), bromochloroacetic aicd (BCAA), chlorodibromoacetic acid (CDBAA) and bromodichloroacetic acid (BDCAA). The presence of HAAs in drinking water supply poses health risk because HAAs are suspected human carcino- gens. The drinking water standard of HAAs known as maximum contaminant level has not yet been regulated in Malaysia. In USA most utilities remain in compliance with MCLs for THMs and HAAs; however, many indi- vidual measurements showed THMs and HAA concen- trations over the MCL values (1). In essence, the running annual average compliance monitoring allows utilities to average sampling sites with low DBP concentrations and sampling sites with high DBP concentrations to remain in compliance with the MCLs. Th is discrepancy initiated and substantially shaped the stage 2 DBP rule [1]. The stage 2 DBP rule, introduced in USEPA 2006 [2], builds upon the stage 1 DBP rule to minimize THM and HAA formation. The USEPA [3] sets maximum contaminant 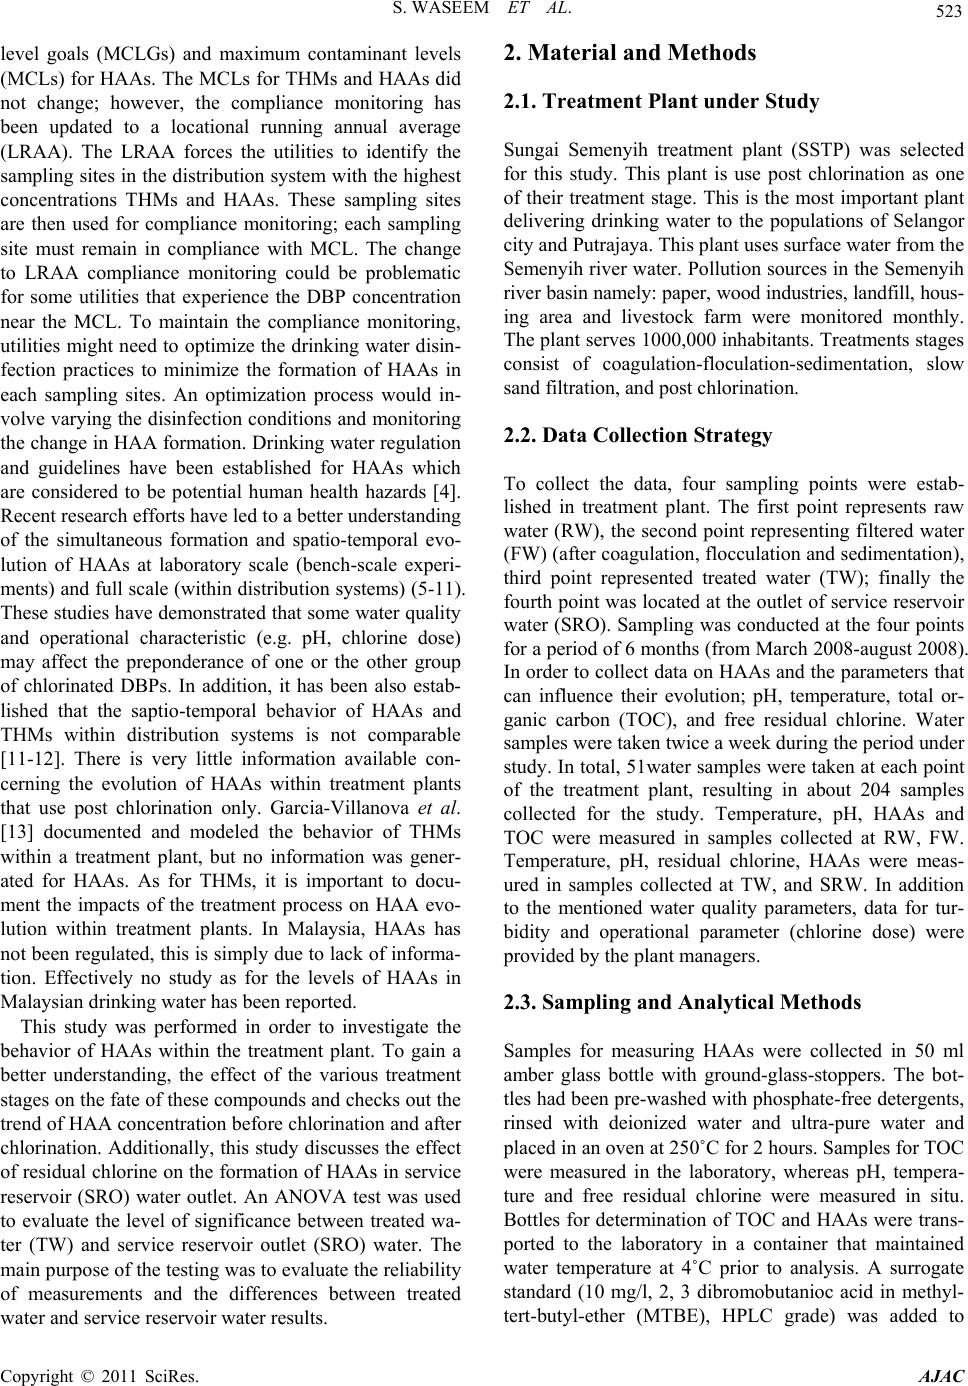 S. WASEEM ET AL. 523 level goals (MCLGs) and maximum contaminant levels (MCLs) for HAAs. The MCLs for THMs and HAAs did not change; however, the compliance monitoring has been updated to a locational running annual average (LRAA). The LRAA forces the utilities to identify the sampling sites in the distribution system with the highest concentrations THMs and HAAs. These sampling sites are then used for compliance monitoring; each sampling site must remain in compliance with MCL. The change to LRAA compliance monitoring could be problematic for some utilities that experience the DBP concentration near the MCL. To maintain the compliance monitoring, utilities might need to optimize the drinking water disin- fection practices to minimize the formation of HAAs in each sampling sites. An optimization process would in- volve varying the disinfection cond itions and monitoring the change in HAA formation. Drinking water regulation and guidelines have been established for HAAs which are considered to be potential human health hazards [4]. Recent research efforts have led to a better understanding of the simultaneous formation and spatio-temporal evo- lution of HAAs at laboratory scale (bench-scale experi- ments) and full scale (within distribution systems) (5-11). These studies have demonstrated that so me water quality and operational characteristic (e.g. pH, chlorine dose) may affect the preponderance of one or the other group of chlorinated DBPs. In addition, it has been also estab- lished that the saptio-temporal behavior of HAAs and THMs within distribution systems is not comparable [11-12]. There is very little information available con- cerning the evolution of HAAs within treatment plants that use post chlorination only. Garcia-Villanova et al. [13] documented and modeled the behavior of THMs within a treatment plant, but no information was gener- ated for HAAs. As for THMs, it is important to docu- ment the impacts of the treatment process on HAA evo- lution within treatment plants. In Malaysia, HAAs has not been regulated, this is simply due to lack of informa- tion. Effectively no study as for the levels of HAAs in Malaysian dri n ki n g wat er has been reported. This study was performed in order to investigate the behavior of HAAs within the treatment plant. To gain a better understanding, the effect of the various treatment stages on the fate of these compounds and checks out the trend of HAA concentration before chlorination and after chlorination. Additionally, this study discusses the effect of residual chlorine on the formation of HAAs in service reservoir (SRO) water outlet. An ANOVA test was used to evaluate the level of significance between treated wa- ter (TW) and service reservoir outlet (SRO) water. The main purpose of the testing was to evaluate the reliab ility of measurements and the differences between treated water and service reservoir water results. 2. Material and Methods 2.1. Treatment Plant under Study Sungai Semenyih treatment plant (SSTP) was selected for this study. This plant is use post chlorination as one of their treatment stage. This is the most important plant delivering drinking water to the populations of Selangor city and Putrajaya. This plant uses surface water fr o m the Semenyih river water. Pollution sources in the Semenyih river basin namely: paper, wood industries, landfill, hous- ing area and livestock farm were monitored monthly. The plant serves 1000,000 inhabitants. Treatments stages consist of coagulation-floculation-sedimentation, slow sand filtration, and post chlorination. 2.2. Data Collection Strategy To collect the data, four sampling points were estab- lished in treatment plant. The first point represents raw water (RW), the second point representing filtered water (FW) (after coagulation, flocculation and sedimentation), third point represented treated water (TW); finally the fourth point was located at the outlet of service reservoir water (SRO). Sampling was conducted at the four points for a period of 6 months (f rom March 20 08-august 2008) . In order to collect data on HAAs and the parameters that can influence their evolution; pH, temperature, total or- ganic carbon (TOC), and free residual chlorine. Water samples were taken twice a week during the period under study. In total, 51water samples were taken at each point of the treatment plant, resulting in about 204 samples collected for the study. Temperature, pH, HAAs and TOC were measured in samples collected at RW, FW. Temperature, pH, residual chlorine, HAAs were meas- ured in samples collected at TW, and SRW. In addition to the mentioned water quality parameters, data for tur- bidity and operational parameter (chlorine dose) were provided by the plant managers. 2.3. Sampling and Analytical Methods Samples for measuring HAAs were collected in 50 ml amber glass bottle with ground-glass-stoppers. The bot- tles had been pre-washed with phosphate-free detergents, rinsed with deionized water and ultra-pure water and placed in an oven at 250˚C for 2 hours. Samples for TOC were measured in the laboratory, whereas pH, tempera- ture and free residual chlorine were measured in situ. Bottles for determination of TOC and HAAs were trans- ported to the laboratory in a container that maintained water temperature at 4˚C prior to analysis. A surrogate standard (10 mg/l, 2, 3 dibromobutanioc acid in methyl- tert-butyl-ether (MTBE), HPLC grade) was added to Copyright © 2011 SciRes. AJAC  S. WASEEM ET AL. Copyright © 2011 SciRes. AJAC 524 sample to monitor method performance. A commercial (Silicabond SAX) was used as SPE sorben t. Disposable 3 ml SPE cartridges with 300 mg sorbent were employed. Cartridges were activated and conditioned prior to use using 10 ml methanol, followed by 10 ml deionised wa- ter. Once activated, 50 ml of sample solution was passed through the SPE cartridge without a vacuum system. HAAs retained were eluted with 3 ml of 10% H2SO4/ MeOH solution. After methylation, 7 ml of Na2SO4 solu- tion was added to increase the extraction efficiency. The methyl tertbutyl-ether (MTBE) extracted samples were placed in amber vial prior to GC-MS analysis. The pH of water was measured by using an electron pH meter (Corning 320, Hanning Instruments). Turbidity was measured with a HACH turbidimeter (2100N model). Total organic carbon (TOC) was analyzed using TOC analyzer (Aurora model 1030, O.I analytical) 3. Results and Discussion 3.1. Occurrence of HAAs within the Plant and Sungai Semenyih Catchment Area The concentration of HAAs was monitored throughout the treatment process at one treatment plant inclusive of different treatment steps. The selected plant, Semenyih water treatment plant (SWTP), located at Putrajaya. Ma- laysia has complete treatment process comprising four steps: raw water subjected to storage, coagulation/floc- culation, settlement, sand filtration, chlorination and fi- nally supplied to consumers through service reservoirs. The mean level of HAAs obtained is given in Figure 1 i.e. the levels of DCAA and TCAA slightly increased from treated water to service reservoir. This is due to further reaction of residual chlorine with the HAAs pre- cursors. After chlorination, lime is introduced in the fil- tered water and that leads to increase in pH which results in an increase in DCAA and a decrease in TCAA. As high pH causes the degradation of TCAA into DCAA, the reservoir water contains high DCAA rather than TCAA. The high formation potential of TCAA and DCAA level was found irrespective of treated water in the service reservoir due to contact time with the residual chlorine. The HAAs concentration depends on both the level of chlorination an d the quality of the water sample. For this treatment plant, DCAA and TCAA was two en- riched species of disinfection was found and mixed halogenated molecules were also observed. In addition to their occurrence in drinking water, HAAs have also been observed in swimming pool water and surface waters [14]. The sources of HAAs in surface waters include wastewater discharges and the deposition of HAAs formed in the upper atmosphere from degradation of chlorinated solven ts [14]. The volatile organochlorines are considered to be one of the main sources of HAAs in the environment [15]. These organochlorine compounds have been found to be of either anthropogenic origin, emanating from volca- noes and oceans or occurring naturally in some plants and soil fungi. As such, HAAs are distributed in the various environmental compartments like the hydro- sphere, air, biosphere and soil. Chemical and pharmaceu- tical manufacturing processes like the bleaching of wood pulp by paper mill and cooling water are yet other Figure 1. Variations of HAAs according to the various treatment stages within the Sungai Semenyih water treatment plant (SSTP).  S. WASEEM ET AL. Copyright © 2011 SciRes. AJAC 525 sources of HAAs in the environment [16]. The presence of HAAs in raw or un-treated water is understandable due to the fact that HAAs are distributed all around the world in lakes, groundwater, surface water, seawater and soil [17-18] and their production has been attributed to both anthropogenic and natural activities. Research con- ducted in Japan [18] has shown the presence of haloace- tic acids in coastal seawater. The occurrence and mass fluxes of MCA, DCA, and TCA were assessed on a re- gional scale over Switzerland, based on more than 1000 concentration measurements in rain and snow, surface water, groundwater, and wastewater. Among different precipitation events, the measured concentrations varied significantly from < 7100 - 11 ng/l. However, no statis- tically different average haloacetic acid (HAA) concen- trations among six precipitation sampling sites located in various areas in Switzerland were observed (range of average concentrations: MCA 1430 - 2770 ng/l, DCA 390 - 1370 ng/l, TCA 95 - 380 ng/l, TFA 33 - 220 ng/l). The similar average HAA concentrations in precipitation at a remote site close to the free troposphere at an eleva- tion of 3580 m above sea level (Jungfraujoch) and at a site that receives precipitation which scavenged the Earth’s boundary layer (urban site Dübendorf/Zürich) suggests that HAAs are derived from well-mixed pre- cursor(s) in the atmosphere (Berg et al. 2000). Whatever the type of process used, it seems that the HAAs are clearly formed at the chlorination step, but it is notable that raw water (untreated water) already contained DCAA, TCAA, and BCAA. These molecules, whose presence was confirmed by taking the sample in the Se- menyih river water from the pollution sources. The study has been carried out in the whole Semenyih catchment with nine stations. The nine stations were covering whole Sungai Semenyih catchment area right from Sungai Semenyih dam (SS1) down to intake point (SS9). As shown in Table 2 analysis of water samples within the Semenyih catchment area showed the pres- ence of HAAs started from Sungai Saringgit (SS2) and increased downstream up to the raw water intake point (SS9). The location of sampling points in Semenyih river is shown in Figure 2. Although all water samples were not chlorinated, the presence of HAAs even at low levels of 0.1 - 2.6 µg/l indicates other sources of these compounds. The antro- pogenic inputs could be from the industrial discharges, agricultural activities or the landfill. The high level of HAAs at Sungai Rinching (SS5) and Sungai Beranang (SS7) were indicative of impact of sewage discharges, paper industry, wood industry and palm oil mill effluent discharges around the SS5 and the discharge of leachate from the landfill near the SS7. The discharges were col- lected from potential pollution sources which have been determined by early research (19). In this present study, the presence of DCAA, TCAA, BCAA, in the raw water was acknowledged due to volatile organic chlorine compounds and paper mill waste in Sungai Semenyih catchment area. The results of this study indicate that all HAAs components present in raw water were signifi- cantly reduced by the sand filtration except BCAA. The biodegradation of DCAA, TCAA, BCAA, DBAA, DBCAA and TBAA in dry season was most probably due to the highly favorable conditions for microbial ac- tivity within the sand filter. This could be the reason the level of HAAs has been decreased after sand filtration. Conventional filtration always contributes significantly to the removal of HAAs (20). HAAs are either not de- tected or are present at very low levels in raw water (RW) samples, since this water is hardly ever subjected to chlorination since no pre-chlorination treatment stage is performed at this plant. After chlorination the major HAAs found in tr eated water (TW) and service reservoir outlet (SRO) examined were monochloroacetic acds (MCAA), dichloroacetic acids (DCAA), trichloroacetic Table 2. Mean concent rat ions of HAAs (µg/l) withi n the Sungai Semenyih catchment area. Station Numbers Compounds Occurrence (%) SS1 SS2 SS3 SS4 SS5 SS6 SS7 SS8 SS9 MCAA 12 - - - - 0.1 - - 0.1 - DCAA 48 - 0.1 0.7 0.5 3.3 1.0 2.9 3.0 1.8 TCAA 25 - 0.1 0.4 2.6 1.9 0.7 1.6 1.0 0.6 MBAA - - - - - - - - - - DBAA 15 - - 0.1 0.5 0.7 0.1 0.5 0.5 0.4 TBAA - - - - - - - - - - BCAA 1 - - - 0.1 1.0 0.1 1.0 1.4 0.5 CDBAA - - - - - - - - - BDCAA - - - - - - - - - -  S. WASEEM ET AL. Copyright © 2011 SciRes. AJAC 526 acids (TCAA), bromochloroacetic acids (BCAA), di- bromoacetic acids (DBAA), and dichlorobromoaceic acids (DCBAA). The impact of chlorination to the pro- duction of HAAs was clearly shown by the increased level of HAAs in the treated water and service reservoir outlet water. Mean levels and total concentrations of HAAs for raw water, filtered water, treated water and service reservoir outlet water samples collected at the treatment plant are listed in Table 3 together with their maximum contamination level (MCL) and there was a sharp increase in the total concentration of HAA in treated water (24.35 µg/l), as compared to raw water (3.3 µg/l), and filtered water (1.2 µg/l). These findings were in line with the reported levels of trihalomethane (THMs) in treated water in same treatment plant which were ac- knowledged due to chlorination process [21]. Figure 2. Location of sampling points in the Sungai Semenyih. Table 3. Mean concentration of HAAs in various drinking water samples (in µg/l). RW FW TW SRO Total Malaysian standards MCLa µg/l) MCAA - - 0.47 0.38 0.85 - DCAA 0.93 0.18 9.8 12.2 23.11 50 TCAA 0.95 0.19 7.9 9.4 18.4 100 BCAA 0.59 0..59 2.2 2.1 5.69 - DBAA 0.83 0.07 3.2 1.8 5.96 - DCBAA - - 0.78 0.84 1.62 - a = maximum contamination le vel  S. WASEEM ET AL. Copyright © 2011 SciRes. AJAC 527 The dominant species of HAA within the treatment plant was DCAA, followed in decreasing order by TCAA, BCAA, DBAA and DCBAA. Between treated water (TW) and service reservoir outlet (SRO), DCAA and TCAA concentration were not significantly (p < 0.05) different because low level of free residual chlorine in the TW contributed to a lesser rise of DCAA and TCAA levels in SRO (an increase of about 40% and 32% for TW, 45% and 35% for SRO, respectively). Similarly the concentrations of BCAA and DBAA decrease from TW (with an average of 9% and 13% respectively) to SRO (with an average of 8% and 7% respectively). This could be ascribed due to the instab ility of b rominated sp ecies at high pH (Xie 2004). Figure 3 shows the percentage of each component of the HAAs relative to the total of the 6HAAs, along the treatment process. The results showed that in TW an d SRO, DCAA was by far the p redominant species representing on average 40 % and 46% of HAAs respectively. These results are consistent with most stud- ies where raw water has been chlorinated experimentally [13,19]. However, as shown in Figure 3, for both stages (TW and SRO), the relative dominance of DCAA and TCAA varied because of contact time. This portrait changes dramatically in the RW and FW where DCAA represented on average 28% and 14% of total HAAs for SSTP, respectively. In the raw water (RW) and filtered water (FW) the av- erage percentage of TCAA (29%, 15%), DBAA (25%, 6%) are changed respectively except BCAA. The aver- age percentage of BCAA is 65% (0.59 µg/l) in filtered water and 18% (0.59 µg/l) in raw water (RW) which is almost same in term of concentration within the two treatment stages (RW, FW). This indicated that BCAA could not be removed using sand filtration. Average value of water quality parameters at the sampling points of the Sungai Semenyih water treatment plant (SSTP) are Figure 3. Percentages of individual HAAs compared to total HAAs along the treatment stages within Sungai Semenyih water treatment plant (SS T P).  S. WASEEM ET AL. Copyright © 2011 SciRes. AJAC 528 given in Tabl e 4. Biofiltration is an effective process for removing biodegradable organic matter and biodegrad- able HAAs. Sand, anthracite, and garnet are common media for biological filters. In this treatment plant, sand is used as media for biological filters. Preliminary studies conducted by the author’s a research group indicated that biologically active carbon (BCAA) is an effective proc- ess for HAAs removal [17]. In this plant, filtration proc- ess is carried out using sand which is not as efficient as BAC. This may be the reason why only little concentra- tion of HAAs species (DCAA, TCAA, and DBAA) is reduced. The presence of BCAA in filtered water indi- cated that filtration using sand is not effective for de- creasing the concentration of BCAA which is still same as in raw water. The presence of BCAA in filtered water is added by the fact that the bromochloroderivatives (BCAA) are not easily degradated due to their physical and chemical be- havior. The higher the number of halogen atoms and the corporation of bromine cause an increase in the biologi- cal stability of the HAAs. However, studies carried out in pond waters have shown DCAA to undergo faster deg- radation compared to that of MCAA and TCAA [18]. A decrease of DCAA, TCAA and DBAA between raw wa- ter (RW) and filtered water (FW) were observed. The degradation of D CAA, TCAA, and DBAA in dry season was very probably due to the highly favorable conditions for microbial activity within the filter. In fact, Williams and Fauntleroy [21] reported that specific type of bacte- ria (identified as a Bukholderia & Sphingomonas species) may degrade dihalogenated DBPs in warm water. In Malaysia, the weather is always warm that biodegrada- tion could be happened. The temperature would be fa- vorable conditions for the formation of such biomasses. 3.2. Temporal Variability of HAAs within the Period of Study HAAs level in the plant under study varied not only ac- cording to the sampling locations throughout the treat- ment processes, but also temporally from the beginning to the end of sampling period. Figures 4 - 7 show that monthly variation of HAAs in the four sampling loca- tions within the plant was considerable and also indi- cated that the monthly patterns of HAAs in the four sam- pling locations. For instances, in the month June, all HAAs species are higher in concentration rather than rest of months. In fact, this could be due to different level of TOC, dose of chlorine, and pH (see Table 4). Mono- chloroacetic acids (MCAA) was found at zero concentra- tion in SRO but in the TW the concentration of MCAA was above zero. The loss of MCAA in SRO was proba- bly due to biodegradation. The observed trend for the biodegradation of HAAs [18] is as follow: MCAA > DCAA > TCAA The loss of MCAA in SRO was indi- cated that MCAA is degradated faster than DCAA and TCAA, as can be seen in above mentioned trend. The effect of TOC, pH and Chlorine dose on the for- mation of HAA6 in TW and SRO is shown in Figure 8 (a), (b), (c). It is observed that the change in HAA6 is similar to the change in TOC except for the result ob- tained on June 16. The level of HAA6 in TW and SRO increased on June 30, probably because of the highest TOC value (8.9 mg/l), chlorine dose (3.3 mg/l). 4. Conclusions This study aimed to investigate variations of HAAs within treatment plant where river water is not pre-chlo- rinated before subsequent physico-chemical treatment. Analysis of raw water (RW), filtered water (FW) from the treatment process of the Sungai Semenyih water treatment plant showed that the HAAs mainly appeared at the chlorination step. However it was also possible to find HAAs species (DCAA, TCAA, BCAA, DBAA) before treatment in the raw water and filtered water. In this case, these could not be considered as chlorination by products, but probably from discharges of paper and waste, wood based industries and from sewage dis- charges. In this treatment plant, the results showed that Table 4. Average values of water quality parameters at the sampling points of the Sungai Semenyih water treatment plant (SSTP). Parameters RW FW TW SRO TOC (mg/l) 3.1 0.78 NM NM pH 6.4 5.9 7.1 7.3 Temperature (˚C) 25.9˚C 25.9˚C 25.9˚C 25.9˚C Chlorine dose (mg /l) NA NA 2.8 Na Residual c hl orine (mg/l) NA NA 1.88 1.75 Tu r b i d i ty (N TU ) 26 5 . 6 0. 6 8 0. 6 7 0. 6 2 Total HAAs (µg/l) 3.3 1.2 24.3 26.7 NM = non-m easured, NA = non-a pplicable  S. WASEEM ET AL. 529 Figure 4. Monthly variation of HAAs concentration in raw water. Figure 5. Monthly variation of HAAs con centration in filtered water. Copyright © 2011 SciRes. AJAC 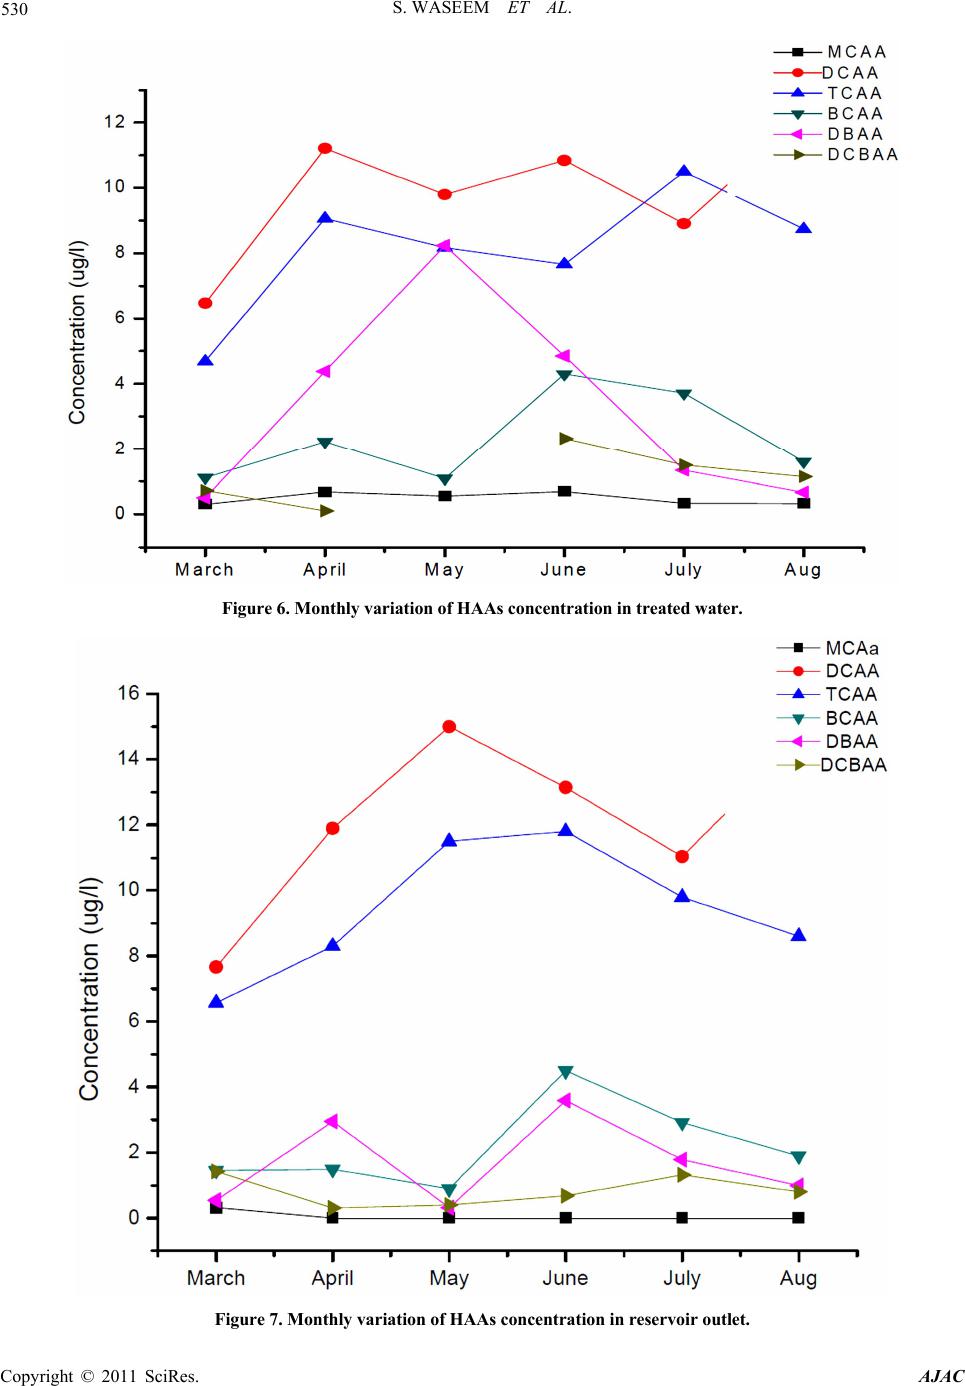 530 S. WASEEM ET AL. Figure 6. Monthly variation of HAAs con centration in treated water. Figure 7. Monthly variation of HAAs con centration in reservoir outlet. Copyright © 2011 SciRes. AJAC 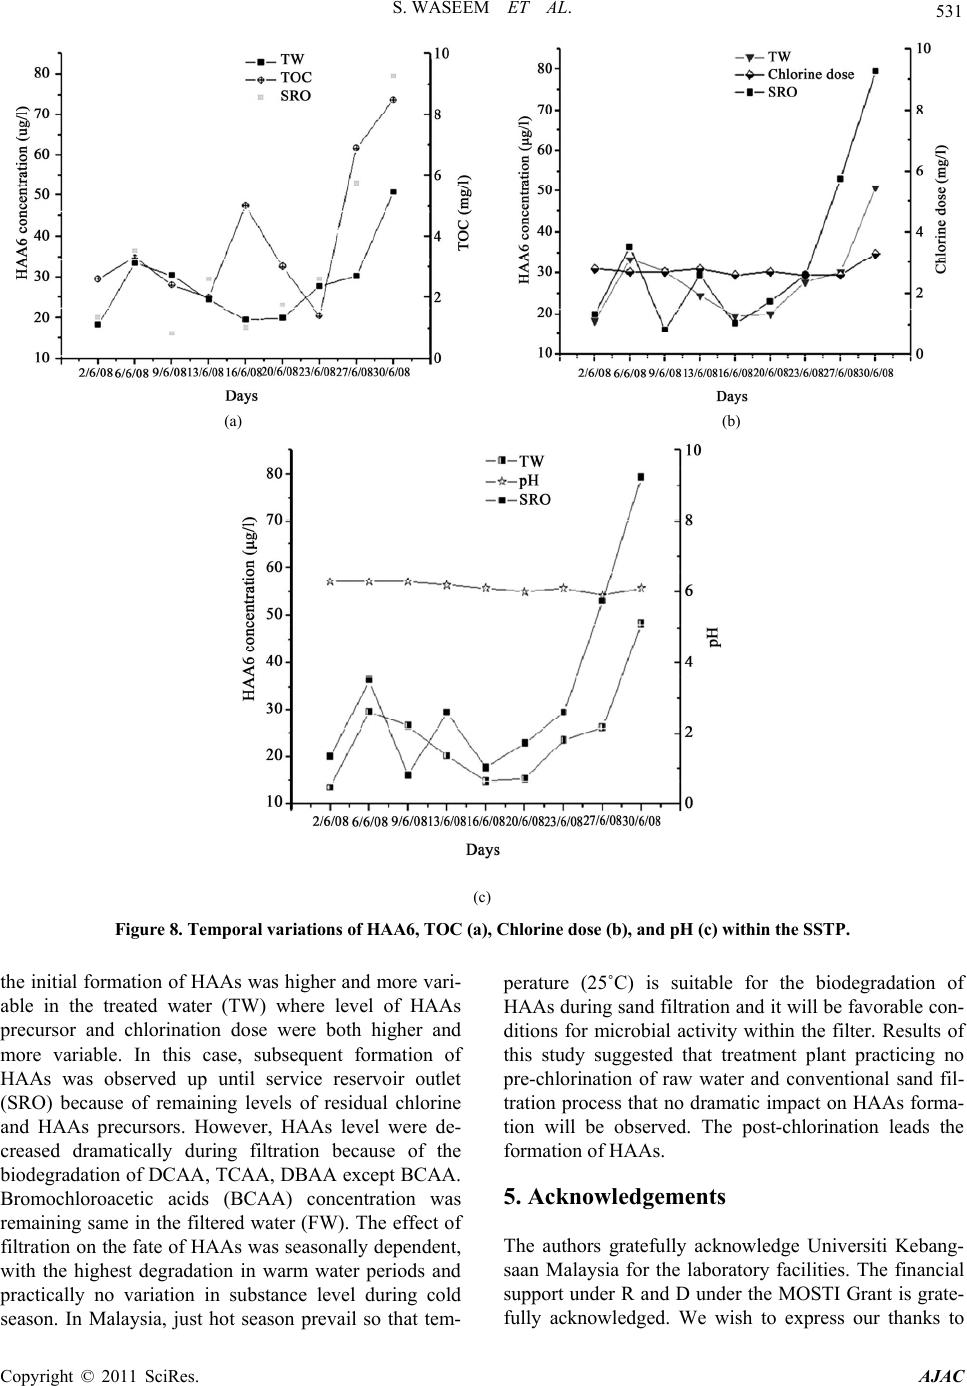 S. WASEEM ET AL. Copyright © 2011 SciRes. AJAC 531 (a) (b) (c) Figure 8. Temporal variations of HAA6, TOC (a), Chlorine dose (b), and pH (c) within the SSTP. the initial formation of HAAs was high er and more vari- able in the treated water (TW) where level of HAAs precursor and chlorination dose were both higher and more variable. In this case, subsequent formation of HAAs was observed up until service reservoir outlet (SRO) because of remaining levels of residual chlorine and HAAs precursors. However, HAAs level were de- creased dramatically during filtration because of the biodegradation of DCAA, TCAA, DBAA except BCAA. Bromochloroacetic acids (BCAA) concentration was remaining same in the filtered water (FW). The effect o f filtration on the fate of HAAs w as seasonally dependent, with the highest degradation in warm water periods and practically no variation in substance level during cold season. In Malaysia, just hot season prevail so that tem- perature (25˚C) is suitable for the biodegradation of HAAs during sand filtration and it will be favorable con- ditions for microbial activity within the filter. Results of this study suggested that treatment plant practicing no pre-chlorination of raw water and conventional sand fil- tration process that no dramatic impact on HAAs forma- tion will be observed. The post-chlorination leads the formation of HAAs. 5. Acknowledgements The authors gratefully acknowledge Universiti Kebang- saan Malaysia for the laboratory facilities. The financial support under R and D under the MOSTI Grant is grate- fully acknowledged. We wish to express our thanks to  532 S. WASEEM ET AL. Konsortium ABASS Sdn, Bhd, for opening their treat- ment plant for us to carry out t his stu dy. 6. References [1] M. McGuire, J. Am. Water Works Assoc, Vol. 98, No. 3, 2006, pp. 123-149. [2] G. E. Symons, J. Am. Water Works Assoc, Vol. 98, No. 3, 2006, pp. 87-98. [3] USEPA, “National Primary Drinking Water Regulation: Disinfection and Disinfection by-Products Rule: Final Rule,” Federal Register, 1998, pp. 63241-68390. [4] WHO, “Guidelines for Drinking-Water Quality,” 2th Edition, Recommendations, Geneva, Vol. 1, 1993. [5] G. L. LeBel, F. M. Benoit and D. T. Williams, “A One- Ye a r S urvey of Hal og e nate d Disinfe c tion by-Products in the Distribution System of Treatment Plants Using Three Different Disinfection Processes,” Chemosphere, Vol. 34, No. 11, 1997, pp. 2301-2317. doi:org/10.1016/S0045-6535(97)00042-8 [6] D. T. Williams, B. Lebel and F. Benoit, “Disinfection by-Products in Canadian Drinking Water,” Chemosphere, Vol. 34, No. 2, 1997, pp. 299-316. doi:org/10.1016/S0045-6535(96)00378-5 [7] W. J. Chen and C. P. Wessiel, J. Am. Water Works Assoc., Vol. 90, No. 4, 1998, pp. 151-163. [8] P. C. Singer, H. C. Weinberg, C. Brophy and L. Linang, at el., “Relative dominance of HAAs and THMs in Treated Drinking Water,” AWWARF Report, 2002. [9] C. M. Villanueva, M. Kogevinas and J. O. Grimalt, “Haloacetic Acids and Trihalomethanes in Finished Drinking Waters from Heterogeneous Sources,” Water Research, Vol. 37, No. 4, 2003, pp. 953-958. doi:org/10.1016/S0043-1354(02)00411-6 [10] M. J. Rodriguez, M. Huard and J. B. Serodes, “Experi- me nt a l S tu dy o f t he F ormation of Chlorinat i o n by-Products in Potable Water of Quebec City, Canada,” Bulletin of Environmental Contamination and Toxicology, Vol. 72, No. 1, 2004a, pp. 211-218. doi:org/10.1007/s00128-003-0261-4 [11] M. J. Rodriguez, J. B. Serodes and P. Levallois, “Behav- ior of Trihalomethanes and Haloacetic Acids in a Drink- ing Water Distribution System,” Water Research, Vol. 38, No. 20, 2004b, pp. 4367-4382. doi:org/10.1016/j.watres.2004.08.018 [12] H. Baribeau, L. Boulos and H. Haileselassie at el., “Pro- ceedings of American Water Works Assoociation of the Water Quality Technology Conference,” San Antonio, TX 2004. [13] R. J. Villanova, C. Garcia and J. A. Gomez at el., Water research, Vol. 31, 1997, pp. 1299-1308. [14] M. Berg, S. R. Muller, J. Muhlemann, A. Wiedmer and R. Schwarzenbach, “Concentrations and Mass Fluxes of Chloroacetic Acids and Trifluoroacetic Acid in Rain and Natural Waters in Switzerland,” Environment Science and Technology, Vol. 34, 2000, pp. 2675-2683. doi:org/10.1021/es990855f [15] http://Archiv.ub.uniheidelberg.de/volltextserver/volltexte/ 2003/3407/Pdf/dissertation [16] “DBP: Haloacetic Acids Fact Sheet” http://www.usbr.gov/pmts/water/media/pdfs/DBP%20HA As.pdf [17] M. L. Hanson and K. R. Solomon, Environmental pollu- tion, Vol. 130, No. 3, 2004, pp. 385-401. [18] S. Hashimoto, S. Azuma and T. Otsuki, Environemtal Toxicilogy and Chemistry, Vol. 17, No. 5, 2005, pp. 798-805. [19] P. Abdullah, A. Marini, J. Daud and S. Waseem, Malay- sian Journal of Analytical Sciences, Vol. 10, No. 1, 2006, pp. 75-80. [20] M. J. Rodrigues, J. Serodes and D. Roy, Water Research , Vol. 41, No. 18, 2007, pp. 4222-4232. [21] P. Abdullah, C. H. Yew, M. Ramli and R. Ali, Malaysian Journal of Chemistry, Vol. 5, No. 1, 2003, pp. 56-66. Copyright © 2011 SciRes. AJAC
|