 Modern Economy, 2011, 2, 561-568 doi:10.4236/me.2011.24062 Published Online September 2011 (http://www.SciRP.org/journal/me) Copyright © 2011 SciRes. ME A New Revisit Evidence of Stock Markets’ Interrelationships in the Greater China Chu-Chia Lin, Chung-Rou Fang, Hui-Pei Cheng Department of Economics, National Cheng-chi University, Taipei, Chinese Taipei E-mail: crfang@nccu.edu.tw Received April 4, 2011; revised May 15, 2011; accepted May 30, 2011 Abstract This paper investigates the recent stock markets’ interrelationships in Greater China (China, Hong Kong, and Taiwan). The main goal is to use more detailed and new daily stock market data from 2005/7 to 2010/5 to offer valuable and complementary insights on financial integration among these economies. From the em- pirical analysis, we found that China’s stock market has a positive impact on the other Greater China econo- mies, but the reverse is not true. In addition, Hong Kong’s stock market also has a significantly positive im- pact on Taiwan, but not on China, and the impact of Hong Kong on Taiwan is larger than that of China on Taiwan. This result is consistent with the previous empirical findings that the segmented and integrated China stock market is mixed, and this result implies that the China stock market is still “partially integrated” with the other Greater China stock markets after the 2008 global financial crisis. Keywords: China Stock Market, Greater China, Financial Integration, Global Financial Crisis 1. Introduction The economic reforms begun in 1978 have led to the rebirth of the stock markets in China. Later, the acces- sion of China to the WTO and stock market reforms in 2003 and 200 51 have been heralded as a watershed event, making a distinct break in China’s economic relations with the rest of the world. The Sh anghai Stock Exch ange and the Shenzhen Stock Exchange are the two major emerging Chinese capital markets, and are linked via the national stock exchange automated quotation system. The Shanghai Stock market was officially opened in 1990 and the Shenzhen Stock Market was inaugurated in 1991. Two types of stocks are traded in th e two markets: “A” shares and “B” shares. “A” shares are restricted to Chinese citizens and denominated in the Chinese cur- rency, the Yuan or Renminbi (hereafter RMB), while “B” shares can be bought and sold only by foreigners and settled in foreign currencies (US dollars for Shang- hai, Hong Kong dollars for Shenzhen). In this study, we focus on the analysis of “A” shares markets since the “B” shares market has been losing its appeal to foreign investors and “A” shares dominate “B” shares in terms of the number of listed companies, trading volume, and market capitalization.2 As the PRC gradually opens her markets to interna- tional trade, the concept of Greater China has begun to take shape. Thus far, the neighborhood region or culture cluster of Greater China consists of China, Hong Kong, and Taiwan.3 Improved relationships between these re- gions, coupled with th e return of Hong Kong to the PRC on July 1, 1997, have strengthened ties within Greater China. Since the three economies adopt export-led poli- cies, there have been many studies investigating the economic relationships within Greater China which want to know whether the interactions are becoming stronger due to the growing trade relations among them. There- fore, this paper will analyze the relationship among the stock markets of Greater China. We are interested in these economies because Greater China has led the world in economic growth for the last decade, and has become one of the major factors in the world economy. It is vir- tually certain to become even more important in the 1China’s stock market reforms, such as the qualified foreign institu- tional investors (QFII) policy in 2003, increased the proportion o shares that were freely tradable in the markets in 2005. The QFII pol- icy allowed foreign institutional investors to invest a meagerUS$ 10 illion in domestic equities at a time when market capitalization in 2007 grew to exceed US$ 3 trillion (see [1]). 2There are a lot of studies devoted to detailed discussion of this topic, such as [2-5], among others. 3[6] and [7] discussed the possibility of market integration or market clustering around the world.  C. C. LIN ET AL 562 years to come. Rapid economic growth in these econo- mies has been accompanied by an increase in the size of their stock markets. Along with the increased importance of these economies as leaders of the capital markets in the Asian economy, foreign participation in stock mar- kets and foreign interest in the behavior of the stock markets has been increasing in recent years. In addition, since these economies have implemented significant capital liberalization and domestic financial deregulation in recent years, we also want to use capital mobility and financial integration to investigate stock market interre- lationships in Greater China after the 2008 global finan- cial crisis. The remainder of this paper is arranged as follows. Section 2 provides a brief review of existing work and outlines our contribution to the literature. Section 3 de- scribes the data and empirical methodology applied in this study. Section 4 reports the estimation results. Fi- nally, Section 5 concludes the main findings of our analysis. 2. Literature Review There have been several studies examining the dynamic interrelationships among Greater China and developed markets, including [3-5,7-14]. Among them, [9] investi- gated the status of real and financial integration of Greater China by using monthly data on 1-month inter- bank rates, exchange rates, and prices. It was found that China and Hong Kong appear to experience increasing real and financial integration while Hong Kong and Tai- wan show no substantial gain in the integration process. However, the concept of integration is difficult to define and measure precisely. In another approach to assessing integration, [9] suggested that one could compare the expected yield on similar assets (e.g. stock market) in different economies in future studies. In addition to [8] and [3], [9] examined the dynamic interrelationships between the share markets of Greater China from 1992 to 2001 in detail, they examined the data before and after the Asian crisis of 1997-1998 by using VAR models. They found that Hong Kong and Taiwan have a strong contemporaneous relationship, but that the mainland markets are relatively isolated from the other two mar- kets. [7], [13], and [14] had similar findings. However, whether the recent modest growth in interrelationships within Greater China is due to the occurren ce of the 2008 global financial crisis or the greater integration of the Chinese economy into the world economy will require more detailed studies. In response, the main goal of this paper is that we try to use the more detailed and recent stock market daily data from 2005/7 to 201 0/5 to fill this gap, in order to offer valuable and complementary in- sights on integration between the Greater China econo- mies. In addition, there is also a lot of literature on the stock market interdependence and capital mobility between China and the other Asian countries, such as [5,6,15-22] and so on. Among them, [5] and [6] discussed the stock market interdependence between China and Asian Newly Industrialized Economies (NIEs), and found that after the Asian crisis, the Chinese equity markets became more interdependent among themselves, although Hong Kong remained non-influential. However, the studies about capital mobility in East Asia are quite different, and early previous studies show the lower degree of capital mobil- ity in developing coun tries. For ex ample, [17] studied th e experiences of developing countries in Africa, Asia, Eastern Europe, and Latin America. They found that these countries often use reserve requirements to depress capital flow and mitigate the impact on the domestic money supply. Based on the International Monetary Fund’s Annual Report on Exchange Arrangements and Exchange Restrictions, [19] developed a capital control index to measure the exten t of capital mobility. He found that imperfect capital mobility is a common fact in most developing countries. In addition, [18] suggested that capital mobility facing developing countries is not as high as some studies have concluded. In particular, tak- ing sterilization into account sharply lowers estimates of capital mobility. However, [20] applied the time-varying parameter estimates of the degree of capital mobility in NIEs. His estimates illustrated the different processes of capital accounts and domestic financial liberalization in the region, and the empirical results indicated that the degree of capital mobility has been increasing substan- tially in these countries. In addition, [21] explored the Saving-Investment correlation of East Asian countries in relation to international capital mobility. Their results were consistent with the fact that capital mobility in East Asia has increased but is still lower than that among the OECD countries. [22] have a similar description. Overall, since quite a few papers address the issues of capital markets in emerging economies and their relation to the performance in the stock markets, the other goal of this paper is to combine these two topics, using capital mo- bility to explain the stock market interrelationships in Greater China after the 2008 global financial crisis. 3. The Data and Empirical Methodology 3.1. Data Since the 1990s, the influence of the mainland’s eco- nomic and financial development on the Hong Kong stock exchange has increased. The first listing of a Copyright © 2011 SciRes. ME  C. C. LIN ET AL563 t mainland China company took place in 1993 through the system of the so-called H-shares (shares in mainland China companies listed in Hong Kong). Today, a large number of mainland companies are listed in Hong Kong. The main exchange company merged with the Hong Kong futures exchange and their clearinghouses in 1999. In addition, in the case of Taiwan’s stock market, its stock exchange was formed in 1961 and trading began in 1962. Both equities and fixed income are traded on the Taiwan stock exchange. However, compared to other developed countries, there are a number of restrictions in place. For example, the short-selling of stocks is prohib- ited and there are ceiling and floor limits on daily price changes of plus and minus 7%.4 Overall, as one of the indicators of the Greater China stock market, [7] show that the number of listed companies grew extremely quickly in mainland China, with the number of compa- nies in 2005 more than four times, that in 1995. Similarly, the number of listed companies in Hong Kong and Tai- wan more than doubled dur ing the same period. Since the accession of China to the WTO, stock mar- ket reform,5 and relaxing the control of RMB in 2005/7,6 this study applied a daily data from 2005/7 to 2010/5 and it is available from the Taiwan Economic Journal data- base (TEJ).7 The dataset includes the China Shanghai A share stock index, Taiwan weighted stock index and Hong Kong Hang Seng stock index. Following [3] and [9], we adapt Shanghai’s A share stock index to repre- sent China’s stock market.8 The reason we apply the A share index is that its trading value is much larger than the B share’s, and the number of listed companies in the A share index is much more than that in the B share in- dex. Moreover, as in [3], the B share index is not nor- mally considered by Asian fund managers as a serious component of Asian portfolios. Therefore, we believe that the Shanghai A share stock index should provide more information about China’s stock market and it could also capture the main trend of China’s stock ex- change. In order to know the interrelationships among the stock markets in Greater China, we use the stock markets’ returns to investigate the relationship in this study. 3.2. Methodology Since most time series variables have a unit root, one cannot use those data without considering their unit root property. Otherwise, a spurious regression problem may occur and the results may not be reliable. To avoid this problem, we have to check whether the variables applied in this study have a unit root or not. Therefore, we use the ADF test first to check the unit root property as fol- lows. The ADF test is called the augmented Dicker-Fuller test, and the original test was developed by [23]. By con- sidering the variables with autoregressive process with order p (AR(p)), the ADF test can be applied to check whether the high order autoregressive variables have unit root property. Let us illustrate the ADF test as follows: 112 21tt tptpt yy yyty 2 ~0, tN , (1) where t is the stock returns, 1tp are the first difference of the stock returns, t is the trend of the stock returns, 1t y,, t yy y is the lagged term of the stock re- turns, and t is an identical independent distribution (i.i.d.) white noise process. From Equation (1), 1 represents that the data in equation have unit root prop- erty, and we say that the data is nonstationary. On the other hand, 1 represents that the data have no unit root, thus they are a stationary process.9 In addition, if the data have a nonstationary property, we have to check if they have a cointegration relation- ship, and it implies that all variables have a long run equilibrium relationship.10 Therefore, we must examine whether the nonstationary variables have a cointegration relationship or not. If the cointegration relationship does not exist, then we take the first difference to deal with the nonstationary property. Thereafter, we can use the vector autoregressive method (VAR) to analyze the rela- tionship among the variables. 4There are a lot of studies devoted to detailed discussion of the Greater China stock markets, such as [2-5], and [7], among others. 5The reform of China’s stock market, such as the QFII policy in 2003, has increased the proportion of shares that are freely tradable in the market in 2005. It is expected that total shares need by QFII will reach 10% of foreign shares in A shares market a ft e r 2005 (see [5]). 6In the end of 2009, the foreign exchange reserve of China is abou US$2,399,152 million, and it is the number 1 in the world. Relaxation of RMB controls is expected to have great influence on the world economy. 7For the details of data obtained, please see the TEJ website: http://www.tej.com.tw. 8There is a little difference from [3], who use value-weighted stock returns in Shanghai and Shenzhen A shares; here we only use the re- turns of Shanghai A shares as an indicator of China’s stock market. The reason is that the trading value of Shanghai shares is larger than that of Shenzhen A shares; for example, the trading value of Shanghai A shares is about twice that of Shenzhen A s h ares in 2009. Consider a VAR(p) process as follows: 011ttptp YAAYAY t , ~0, tN (2) where contains t Y1n variables and ti Y, 1, 2i,, p are lagged dependent variables. From above, we consider the appropriate order selection in the ADF test and VAR(p) process. Here we use the Akaike’s information criterion (hereafter AIC, see [24]) for the model fitting. AIC is defined as: 9If neither mean nor autocovariance depend on the date t, the process t 10 For details, see [25]. y is called a (weakly) stationary process. Copyright © 2011 SciRes. ME  C. C. LIN ET AL 564 2lnmax2 IC MlikelihoodM , (3) where M is the number of estimated parameters in the model. The optimal order of the model is chosen by the value of M, which is a function of p, such that AIC(M) is minimal. After choosing the optimal order for the VAR(p) proc- ess, we can transfer the VAR(p) process to a moving average infinite (MA()) as follows: 112 2, tttt Y (4) Then, we can calculate the impulse response function. The element of in row i and column j can be ex- pressed as follows: , ,its ij t y , (5) where t is the jth variable’s innovation at data t, and ,its is the i-th variable at date t+s. The impulse re- sponse function means how much the ith variable at date t+s will change ,ij y units, as when the jth variable’s innovation increases by one unit at data t. By using the impulse response function, we can implement impulse response analysis (hereafter IRA) and also plot the im- pact of one unit increase in the j-th variable’s innovation at t on i-th variable at date t+s. At the same time, we can find the response of the key variables when shock occurs in the other variables. In our paper, we employ IRA to analyze the relationship among the stock markets. 4. Empirical Findings 4.1. Basic Statistics Description From Table 1, we can see that mean and standard de- viation of China are higher than those of Hong Kong and Taiwan, which means that Chinese stock market is more profitable but riskier. Consequently, the higher returns attract more international capital flow into this stock market and then reflect the higher economic growth rate in China.11 Finally, the skewness and kurtosis among all economies reflect that the financial time series data have fat tail properties. Table 1. Basic statistic description of stock returns, 2005/7 to 2010/5 unit: % Economies Mean S. D. Skewness Kurtosis China 0.0489 2.0944 –0.5590 5.6337 Hong Kong 0.0236 1.9820 0.1684 10.6260 Taiwan 0.0070 1.5088 –0.3590 5.4472 Source: Taiwan Economic Journal. Note: China = Shanghai A share stock returns; Taiwan = Taiwan stock returns; Hong Kong = Hang Seng stock returns. Table 2 is the annual growth rate of the number of listed companies from 2006 to 2010. Compared to [7] which show the number of China’s listed companies more than quadrupled from 1995 to 2005, but those in Hong Kong and Taiwan grew by only half as much dur- ing the same period, we found that the annual growth rate of Hong Kong is the largest among all three from 2005 to 2010. Since Hong Kong is more international- ized, international investors interested in profiting from China’s rapid economic growth have tended to go through Hong Kong recently. From Table 3, the results of the ADF test show that stock returns in the three economies have no unit root property. This means that all variables have no persistent impact, and the current effect of one market shock on the others will disappear in the future. Hence, we can im- plement the VAR estimation and IRA to proceed with our analysis in the following section. 4.2. Estimation Results 4.2.1. VAR Es ti mation Since the lag length is chosen as the minimum AIC value, it requires only one lagged period for estimation in this model. In addition, in order to deal with the 2008 global financial crisis, we construct a dummy variable into our estimation as well. Therefore, we set the dummy variable representing the period after September in 2008.12 In Table 4, one may see that the explanatory power (adj. ) of each equation is very low, and it implies that the daily returns contain too little information to do any meaningful prediction. Among them, China’s stock market is not significantly influenced by all returns of Hong Kong and Taiwan, but Hong Kong’s stock market is significantly influenced by the first lagged returns of China (CN(–1)) and Taiwan (TW(–1)). In addition, Tai- wan’s stock market is significantly influenced by the first lagged returns of China (CN(–1)), the first lagged returns of Hong Kong (HK(–1)), and the first lagged returns of Taiwan (TW(–1)). Furthermore, the dummy variable shows that the 2008 financial crisis had no significant impacts on all markets. The insignificant coefficient im- plies that the effect of the financial crisis may have gradually decayed after 2008. 2 R Overall, from Table 4, we can see that the interactions among all markets are complicated, and some findings such as China having an insignificant effect on all vari- ables are also difficult to explain. Since the VAR model is a reduced form, we cannot obtain any exact result. Therefore, we find that the explanatory power is poor in 12After September in 2008, the US Government took control of Fannie Mae and Freddie Mac, which are the major Federal Home Loan Mortgage Corporations in the US, and Lehman Brothers Holdings Inc. filed for bankruptcy. 11China’s economic growth rate was 11.6% in 2006, 13% in 2007, 9.0% in 2008, and 8.7% in 2009; the average economic growth rate in the past four years is the largest in Greater China. Copyright © 2011 SciRes. ME 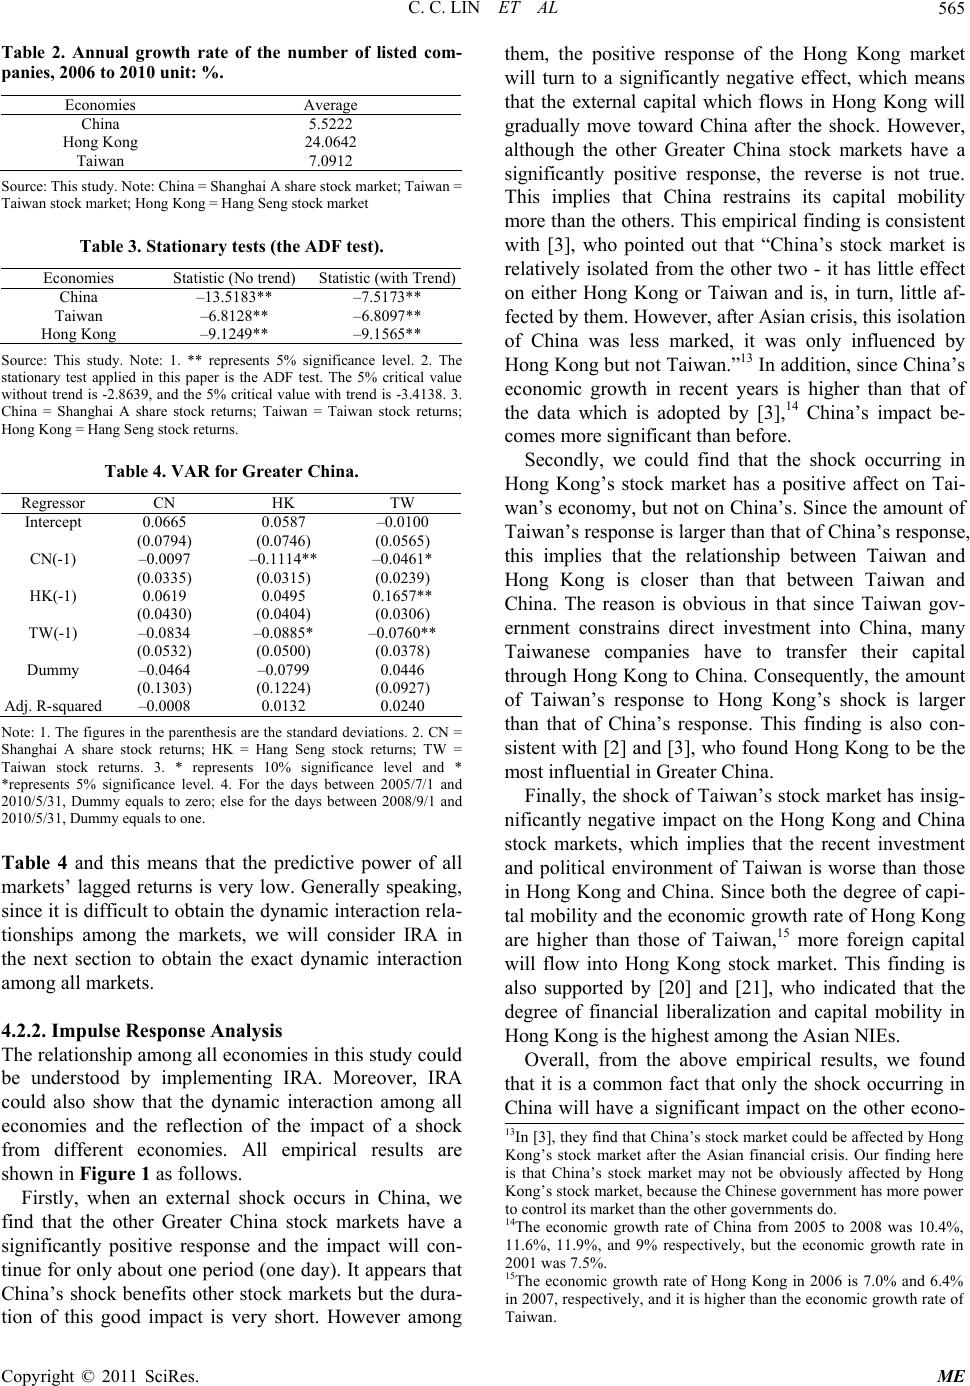 C. C. LIN ET AL565 Table 2. Annual growth rate of the number of listed com- panies, 2006 to 2010 unit: %. Economies Average China 5.5222 Hong Kong 24.0642 Taiwan 7.0912 Source: This st udy. Note: China = Shanghai A share stoc k market; Taiwan = Taiwan stock market; Hong Kong = Hang Seng st ock market Table 3. Stationary tests (the ADF test). Economies Statistic (No trend) Statistic (with Trend) China –13.5183** –7.5173** Taiwan –6.8128** –6.8097** Hong Kong –9.1249** –9.1565** Source: This study. Note: 1. ** represents 5% significance level. 2. The stationary test applied in this paper is the ADF test. The 5% critical value without trend is -2.8639, and the 5% critical value with trend is -3.4138. 3. China = Shanghai A share stock returns; Taiwan = Taiwan stock returns; Hong Kong = Hang Seng stock returns. Table 4. VAR for Greater China. Regressor CN HK TW Intercept 0.0665 0.0587 –0.0100 (0.0794) (0.0746) (0.0565) CN(-1) –0.0097 –0.1114** –0.0461* (0.0335) (0.0315) (0.0239) HK(-1) 0.0619 0.0495 0.1657** (0.0430) (0.0404) (0.0306) TW(-1) –0.0834 –0.0885* –0.0760** (0.0532) (0.0500) (0.0378) Dummy –0.0464 –0.0799 0.0446 (0.1303) (0.1224) (0.0927) Adj. R-squared –0.0008 0.0132 0.0240 Note: 1. The figures in the parenthesis are the standard deviations. 2. CN = Shanghai A share stock returns; HK = Hang Seng stock returns; TW = Taiwan stock returns. 3. * represents 10% significance level and * *represents 5% significance level. 4. For the days between 2005/7/1 and 2010/5/31, Dummy equals to zero; else for the days between 2008/9/1 and 2010/5/31, Dummy equals to one. Table 4 and this means that the predictive power of all markets’ lagged returns is very low. Generally speaking, since it is difficult to obtain the dynamic interaction rela- tionships among the markets, we will consider IRA in the next section to obtain the exact dynamic interaction among all markets. 4.2.2. Impulse Response Analysis The relationship among all economies in this study could be understood by implementing IRA. Moreover, IRA could also show that the dynamic interaction among all economies and the reflection of the impact of a shock from different economies. All empirical results are shown in Figure 1 as follows. Firstly, when an external shock occurs in China, we find that the other Greater China stock markets have a significantly positive response and the impact will con- tinue for only about one period (one day). It appears that China’s shock benefits other stock markets but the dura- tion of this good impact is very short. However among them, the positive response of the Hong Kong market will turn to a significantly negative effect, which means that the external capital which flows in Hong Kong will gradually move toward China after the shock. However, although the other Greater China stock markets have a significantly positive response, the reverse is not true. This implies that China restrains its capital mobility more than the others. This empirical finding is consistent with [3], who pointed out that “China’s stock market is relatively isolated from the other two - it has little effect on either Hong Kong or Taiwan and is, in turn, little af- fected by them. However, after Asian crisis, this isolation of China was less marked, it was only influenced by Hong Kong but not Taiwan.”13 In addition, since China’s economic growth in recent years is higher than that of the data which is adopted by [3],14 China’s impact be- comes more significant than before. Secondly, we could find that the shock occurring in Hong Kong’s stock market has a positive affect on Tai- wan’s economy, but not on China’s. Since the amount of Taiwan’s response is larger than that of China’s response, this implies that the relationship between Taiwan and Hong Kong is closer than that between Taiwan and China. The reason is obvious in that since Taiwan gov- ernment constrains direct investment into China, many Taiwanese companies have to transfer their capital through Hong Kong to China. Consequently, the amount of Taiwan’s response to Hong Kong’s shock is larger than that of China’s response. This finding is also con- sistent with [2] and [3], who found Hong Kong to be the most influential in Greater China. Finally, the shock of Taiwan’s stock market has insig- nificantly negative impact on the Hong Kong and China stock markets, which implies that the recent investment and political environment of Taiwan is worse than those in Hong Kong and China. Since both the degree of capi- tal mobility and th e economic growth rate of Ho ng Kong are higher than those of Taiwan,15 more foreign capital will flow into Hong Kong stock market. This finding is also supported by [20] and [21], who indicated that the degree of financial liberalization and capital mobility in Hong Kong is the highest among the Asian NIEs. Overall, from the above empirical results, we found that it is a common fact that only the shock occurring in China will have a significant impact on the other econo- 13In [3], they find that China’sstock market could be affected by Hong Kong’s stock market after the Asian financial crisis. Our finding here is that China’sstock market may not be obviously affected by Hong Kong’s stock market, because the Chinese government has morepower to control its market than the other governments do. 14The economic growth rate of China from 2005 to 2008 was 10.4%, 11.6%, 11.9%, and 9% respectively, but the economic growth rate in 2001 was 7.5%. 15The economic growth rate of Hong Kong in 2006 is 7.0% and 6.4% in 2007, respectively, and it is higher than the economic growth rate o Taiwan. Copyright © 2011 SciRes. ME  C. C. LIN ET AL Copyright © 2011 SciRes. ME 566 -0.5 0.0 0.5 1.0 1.5 2.0 2.5 12345678910 Respons e of CN t o C N -0.5 0.0 0.5 1.0 1.5 2.0 2.5 12345678910 Res pons e of C N t o H K -0.5 0.0 0.5 1.0 1.5 2.0 2.5 12345678910 Res pons e of CN t o TW -0.4 0.0 0.4 0.8 1.2 1.6 2.0 12345678910 Res pons e of HK t o CN -0.4 0.0 0.4 0.8 1.2 1.6 2.0 12345678910 Response of HK to HK -0.4 0.0 0.4 0.8 1.2 1.6 2.0 12345678910 Response of HK to TW 0.0 0.4 0.8 1.2 12345678910 Res pons e of TW t o CN 0.0 0.4 0.8 1.2 12345678910 Re sp ons e of TW t o H K 0.0 0.4 0.8 1.2 12345678910 Res pons e of TW t o TW Response to Cholesky One S.D. Innovations ± 2 S.E. Figure 1. Share market interrelationships in Greater China from 2005/7 to 2010/5 (daily data). Note: 1. The optimal lag pe- riods selected is 1 (days); 2. The definition of economies is the same as Table 1; 3. The real line is the impulse response to Cholesky one S.D. for the market in question, while the dotted line is a confidence interval corresponding to two S.D. The impact effect is significant if the confidence interval does not include the zero line. speaking, the China A- share market has long been con- sidered to be segmented from the other global financial markets. As a result, even though China has become a member of the WTO and its government has committed to the gradual opening of the A-share market over the next several years, we found that China’s stock market has a positive impact on the other Greater China econo- mies but not vice versa. In addition, Hong Kong’s stock market has also a positive impact on Taiwan’s economy, but not on China’s, and the impact of Hong Kong to Taiwan is larger than that of China to Taiwan. This result is consistent with the previous empirical findings that the segmented and integrated China stock market is mixed (see [5]). In addition, [11] found that the volatilities of most of Greater China market and other stock market indices have significant asymmetric coefficients, where mainland China’s stock market is not affected by both contemporaneous and delayed “bad news”. The overall findings provide evidence to support the view that the China stock markets are “partially integrated” with the international stock markets after the 2008 global finan- cial crisis. mies, but the reverse is not true. This means that China and other Greater China stock markets are complemen- tarily related, and they will benefit from the growth of China’s stock market. Additionally, international capital mobility is a well-documented phenomenon after the financial deregulation and capital liberalization pursued in the Asian developing countries during the last two decades. Increasing integration of capital markets has promoted a surge of private capital of developed coun- tries flowing into developing countries. Therefore, the financial deregulation process has led many to argue that stock markets across the world are becoming increas- ingly integrated (see [5]). A large number of empirical studies have paid attention to measure the degree of capital mobility in these Asian developing countries, though the findings are quite different.16 Generally 16Consequently, one market that has recently stimulated high interest with regard to the question of integration is the China stock market. For example, some studies including [3] and [6] found modest growth in the interrelationship among the mainland China stock market, Hong Kong stock market, and Taiwan stock market after the Asian financial crisis. However, [2] and [26] found little evidence that other Asian markets have great influences on the China A-share market.  C. C. LIN ET AL567 5. Concluding Remarks This paper investigates the interrelationships among the indices of the mainland China stock market and those in the neighboring markets of Greater China. Since the con- cept of financial integration is difficult to define and measure precisely, one important approach is to compare the expected yield on similar assets (stock markets) in different economies (see [10]). In the literature about the Greater China stock market, the mainland market is rela- tively isolated from the other two markets considered. However, whether the growth of interrelationships in Greater China is due to the occurrence of the Asian crisis or due to the closer integration of the China economy into the world economy requires more decent studies (see [3]). Therefore, the main goal of this paper is to use newer, and more detailed daily stock market data from 2005/7 to 2010/5 to fill this gap, in order to offer valuable and com- plementary insights on financial integration within Greater China after the 2008 global financial crisis. Additionally, international capital mobility is a well- documented phenomenon after the financial deregulation and capital liberalization pursued in the Asian develop- ing countries during the last two decades. Increasing in- tegration of capital markets has promoted a surge of pri- vate capital from developed countries flowing into de- veloping countries. Therefore, the financial deregulation process has led many to argue that stock markets across the world are becoming increasingly integrated (see [5]). A large number of empirical studies have paid attention to measure the degree of capital mobility in these Asian developing countries, but the findings are quite mixed. Overall, since quite a few papers address both the issues of capital markets in emerging economies and the rela- tionship to the performance in the stock markets, the another goal of this paper is to combine these two issu es by using capital mobility to explain the stock market interrelationships in Greater China. From the empirical analysis in this paper, we found that China’s stock market has a positive impact on the other Greater China economies, while the reverse is not true. In addition, Hong Kong’s stock market also has a significantly positive impact on Taiwan’s economy, but not on China’s, and the impact of Hong Kong on Taiwan is larger than that of China on Taiwan. This result is con- sistent with the previous empirical findings that the seg- mented and integrated China stock market is mixed, and the result implies that the China stock market is still “partially integrated” with the international stock mar- kets after the 2008 global financial crisis. 6. References [1] B. Jiang, J. Laurenceson and K. K. Tang, “Share Reform and the Performance of China’s Listed Companies,” China Economic Review, Vol. 19, No. 3, 2008, pp. 489- 501. doi:10.1016/j.chieco.2008.02.001 [2] Y. H. Yeh and T. S. Lee, “The Interaction and Volatility Asymmetry of Unexpected Return in the Greater China Stock Markets,” Global Finance Journal, Vol. 11, No. 1, 2000, pp. 129-149. doi:10.1016/S1044-0283(00)00014-4 [3] N, S. Groenewold, H. K. Tang and Y. Wu, “The Dynamic Interrelationships between the Greater China Share Mar- kets,” China Economic Review, Vol. 15, No. 1, 2004, pp. 45-62. [4] E. Girardin and Z. Liu, “The Financial Integration of China: New Evidence on Temporally Aggregated Data for the A-Share Market,” China Economic Review, Vol. 18, No. 3, 2007, pp. 354-371. doi:10.1016/j.chieco.2007.02.009 [5] Y. Wang and A. D. Iorio, “Are the China-Related Stock Markets Segmented with Both World and Regional Stock Markets?” Journal of International Financial Markets Institutions and Money, Vol. 17, No. 3, 2007, pp. 277- 290. doi:10.1016/j.intfin.2005.12.001 [6] A. Hatemi-J. and E. D. Roca, “Do Birds of the Same Feather Flock Together? The Case of the Chinese States Equity Markets?” Journal of International Financial Markets Institutions and Money, Vol. 14, No. 3, 2004, pp. 281-294. doi:10.1016/j.intfin.2003.08.001 [7] A. C. Johansson and C. Ljungwall, “Spillover Effects Among the Greater China Stock Markets,” World Devel- opment, Vol. 37, No. 4, 2009, pp. 839-851. doi:10.1016/j.worlddev.2008.07.015 [8] W. S. J. Hu, M. Y. Chen, R. C. W. Fok and B. N. Huang, “Causality in Violating Spillover Effects between US, Japan and Four Equity markets in the South China Growth Triangular,” Journal of International Financial Markets Institutions and Money, Vol. 7, No. 4, 1997, pp. 351-367. doi:10.1016/S1042-4431(97)00027-9 [9] B. N. Huang, C. W. Yang and J. W. S. Hu, “Causality and Cointegration of Stock Markets Among the South China Growth Triangle,” International Review of Finan- cial Analysis, Vol. 9, No. 3, 2000, pp. 281-297. doi:10.1016/S1057-5219(00)00031-4 [10] Y. W. Cheung, M. D., Chinn and E. Fujii, “China, Hong Kong, and Taiwan- A Quantitative Assessment of Real and Financial Integration,” China Economic Review, Vol. 14, No. 3, 2003, pp. 281-303. doi:10.1016/S1043-951X(03)00023-3 [11] S. S. Wang and M. Firth, “Do Bears and Bulls Swim across Ocean? Market Information Transmission between Greater China and the Rest of the World,” Journal of In- ternational Financial Markets Institutions and Money, Vol. 14, No. 3, 2004, pp. 235-254. doi:10.1016/j.intfin.2003.07.002 [12] H. Cheng and J. L. Glascock, “Dynamic Linkages Be- tween the Greater China Economic Area Stock Mar- kets-Mainland China, Hong Kong, and Taiwan,” Review of Quantitative Finance and Accounting , Vol. 24, No. 4, 2005, pp. 343-357. doi:10.1007/s11156-005-7017-7 [13] G. G. Tian, “Are Chinese Stock Markets Increasing Inte- Copyright © 2011 SciRes. ME  C. C. LIN ET AL Copyright © 2011 SciRes. ME 568 gration With Other Markets in the Greater China Region and Other Major Markets?” Australian Economic Papers, Vol. 46, No. 3, 2007, pp. 240-253. doi:10.1111/j.1467-8454.2007.00317.x [14] N. Huyghebaert and L. Wang, “The Co-movement of Stock Markets in East Asia: did the 1997-1998 Asian Fi- nancial Crisis Really Strengthen Stock Market Integra- tion?” China Economic Review, Vol. 21, No. 1, 2010, pp. 98-112. doi:10.1016/j.chieco.2009.11.001 [15] A. R. Chowdhury, “Stock Market Interdependencies: Evidence from the Asian NIEs,” Journal of Macroeco- nomics, Vol. 16, No. 4, 1994, pp. 629-651. doi:10.1016/0164-0704(94)90004-3 [16] C. E. Chang, G. R. McQeen, and J. M. Pinegar, “Cross-autocorrelation in Asia Stock Markets,” Pacific— Basin Finance Journal, Vol. 7, No. 5, 1999, pp. 471-493. [17] C. M. Reinhart and R. R. Reinhart, “On the Use of Re- serve Requirements in Dealing with Capital Flow Prob- lems,” International Journal of Finance and Economics, Vol. 4, No. 1, 1999, pp. 27-54. doi:10.1002/(SICI)1099-1158(199901)4:1<27::AID-IJFE 92>3.0.CO;2-T [18] T. D. Willett, M. W. Keil and Y. S. Ahn, “Capital Mobil- ity for Developing Countries Is Not Be So High,” Journal of Development Economics, Vol. 68, No. 2, 2002, pp. 421-434. doi:10.1016/S0304-3878(02)00020-2 [19] L. Alfaro, “Capital Controls: a Political Economy Ap- proach,” Review of International Economics, Vol. 12, No. 4, 2004, pp. 571-590. doi:10.1111/j.1467-9396.2004.00468.x [20] L Sun, “Measuring Time-Varying Capital Mobility in East Asia,” China Economic Review, Vol. 15, No. 3, 2004, pp. 281-291. doi:10.1016/j.chieco.2003.07.003 [21] S. Kim, S. H. Kim and Y. Wang, “Saving, Investment and International Capital Mobility in East Asia,” Japan and the World Economy, Vol. 19, No. 2, 2007, pp. 279- 291. doi:10.1016/j.japwor.2006.05.001 [22] F. Guo and Y. S. Huang, “Does ‘Hot Money’ Drive China’s Real Estate and Stock Markets?” International Review of Economics and Finance, Vol. 19, No. 3, 2010, pp. 452-466. doi:10.1016/j.iref.2009.10.014 [23] D. A. Dickey and W. A. Fuller, “Distribution of the Es- timators for Autoregressive Time Series with a Unit Root,” Journal of the American Statistical Association, Vol. 74, No. 366, 1979, pp. 427-431. doi:10.2307/2286348 [24] H. Akaike, “A New Look at the Statistical Model Identi- fication,” IEEE Transactions on Automatic Control, Vol. 19, No. 6, 1974, pp. 716-723. doi:10.1109/TAC.1974.1100705 [25] R. F. Engle and C. W. J. Granger, “Co-Integration and Error Correction: Representation, Estimation, and Test- ing,” Econometrica, Vol. 55, No. 2, 1987, pp. 251-276. [26] S. S. Wang and L. Jiang, “Local of Trade, Ownership Restraints, and Market Illiquidity: Examining Chinese A- and H-shares,” Journal of Banking and Finance, Vol. 28, No. 6, 2004, pp. 1273-1297. doi:10.1016/S0378-4266(03)00119-5
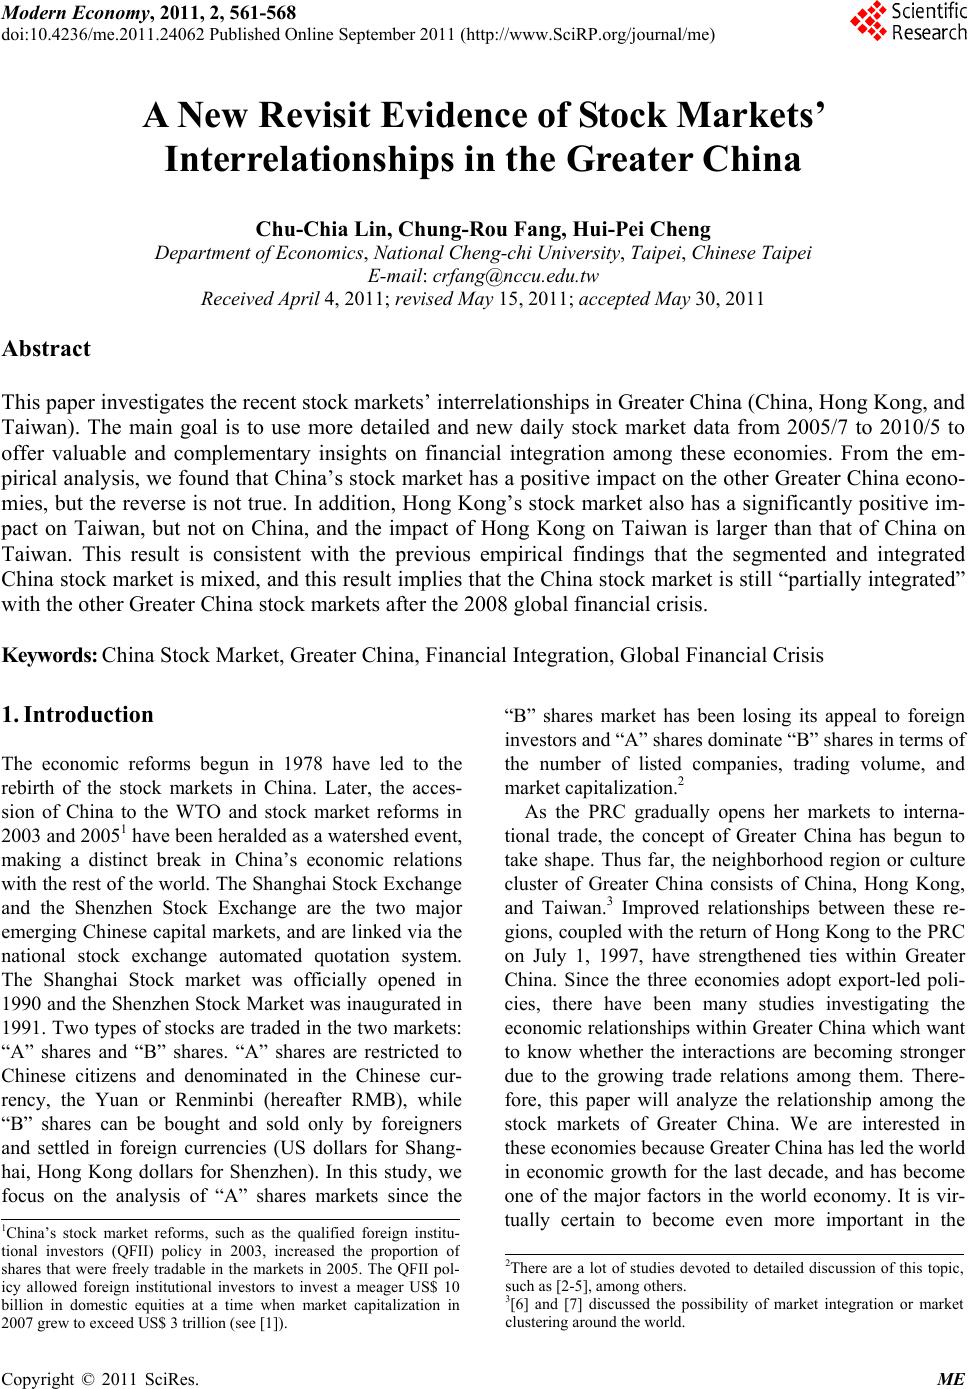
|