 Modern Economy, 2011, 2, 447-454 doi:10.4236/me.2011.24050 Published Online September 2011 (http://www.SciRP.org/journal/me) Copyright © 2011 SciRes. ME Trade Intensity Spillover Effects on East Asian Sustainable Economic Growth Elsadig Musa Ahmed Economics Unit, Faculty of Business and Law, Multimedia University, Melaka, Malaysia E-mail: elsadigmusa@yahoo.com, asadiq29@hotmail.com Received January 26, 2011; revised March 15 , 20 1 1; accepted April 2, 2011 Abstract This paper has included the exports and imports per unit of labour (trade intensity) in the intensive growth model beside the traditional factors of production such as capital deepening to find out the contribution of total factor productivity per unit of labour (TFP intensity) to the economic growth of the most significant East Asian countries [China, Indonesia, Japan, South Korea (Republic of Korea), Malaysia, Philippines, Singapore and Thailand]. This paper finds out that the impact of trade intensity is positive with little contri- bution to TFP intensity growth with light contribution of labour productivity to these countries economic growth. These findings showed that most of East Asian productivity is input driven without technological progress to display the spillover effects of the interaction of foreign technology and human capital that should be translated into technology transfer to local firms and advanced skills, with the exception of Japan and South Korea. Keywords: Trade Intensity, Sustainable TFP Growth, Spillover Effects, East Asian Economies 1. Introduction East Asian region considered to be one of the most growing regions in the world and open economies for exports and imports activities around the globe. Thanks to foreign direct investment (FDI) inflows that helped these countries to grow faster than industrialised coun- tries. However, this growth is considered to be input driven rather than productivity driven growth based on huge inputs that is used to produce outputs without pro- gressing technologically and based on foreign multina- tional national corpo rations (MNCs) investment form the hyper markets to electronics products. Meanwhile, Japan and South Korea had showed technical progress through their MNCs that were competed internationally through high quality products that had been accepted worldwide. This means that the spillover effects of interaction be- tween foreign technology and local human capital and firms has taken place in Japan and South Korea, in this regard, their productivity considered to be productivity driven. Moreover, Juthathip [1] explains that economic growth in East and Southeast Asia since the early 1980s has been underpinned by rapid expansion in manufac- turing exports. The surge in exports of manufactured goods during this period has been accompanied by a shift in commodity composition. While the speed of adjust- ment has varied, the countries in the region tended to start with a focus on tech nologically simple labou r inten- sive goods such as apparel and footwear, and then moved to a range of more capital-intensive, technology courte- ous items, especially electrical and non-electrical ma- chinery. In addition, Juthathip [1] affirms trade liberali- zation and investment policy reforms in developing countries have significantly shortened barriers to trade and investment, thus, further encouraging expansion and dispersion of outward direct investment of multinational enterprises (MNEs). The author points out that these emerging patterns could have implications for the factors that influence export performance. Then, reviewed the work of Jones and Kierzkowski [2] and Arndt and Hue- mer [3] have argued that a surge in intermediate goods trade could dilute real exchange rate impacts as interme- diate exports involve a high proportion of imported parts and components and high fixed costs in establishing the “service links.” However, Obstfeld [4] and Rauch and Trindade [5] have argued that the increasing importance of product fragmentation and of trade in parts and com- ponents could induce stronger substitution responses as the presence of production facilit ies in different co untries  E. M. AHMED 448 would allow firms to respond more quickly to interna- tional price changes by shifting activities across bord ers. Literature Review In the issu e of trad e and techn ology tra nsfer, Bla lock and Veloso [6] affirm that the internation al economics litera- ture has had a lasting interest in the relationship between trade and technology transfer (Keller, [7]; Saggi, [8]; Werner, [9]). It should be recalled, that early studies us- ing aggregate country-level data suggest trade is an im- portant driver of economic growth and these findings have prompted a stream of research on firm-level mecha- nisms that support these aggregate findings. The existing research has mostly focused on two mechanisms: exports by local firms and FDI by multinational firms. Meanwhile, the majority of studies associate both mechanisms with increases in productivity, although the direction of the causality is still under scrutiny. None- theless, much less effort has been devoted to the export counterpart, imports, which are th e fo cus of this paper. In particular, few studies have used firm-level data to ex- amine imports as a mechanism for technology transfer (Amiti and Konings, [10]; Fernandes, [11]; Keller and Yeaple, [12]; MacGarvie, [13]; Muendler, [14]), and the results so far have been mixed. Blalock and Veloso [6] ask whether imports can improve firm technological ca- pabilities, as measured by productivity gains. Using a rich panel dataset on Indonesian manufacturers from 1988 to 1996, they examine factory productivity growth and its relation to imports in downstream industries. Be- sides, control for the potential endogeneity between im- ports and productivity by conditioning on static industrial sector and firm-level attributes and by considering only import activity largely exogenous to the focal firm. Bla- lock and Veloso [6] find strong evidence that firms sell- ing to sectors that rely more on imports have greater productivity growth than other firms. This finding is consistent with the hypothesis that vertical supply rela- tionships are an important mechanism through which import-driven technology transfer occurs. Identifying imports as a source of international technology transfer adds a critical third component, along with exports and FDI, to the argument that trade promotes economic growth. In the case, of most of East Asian countries trade hasn’t show the spillover effects of technology interac- tions with local human capital and firms to transfer the technology and skills to the host countries of FDI in- vestment. Total factor productivity (TFP) growth in place of the centre of spillover effects of this interaction has long been identified as one of the important sources of eco- nomic growth in the western countries (Solow [15,16], Abromovitz [17], Denison [18], Kim and Lau [19]. In a study on sources of growth in nine western countries, Denison [20] found that advanced knowledge, improved allocation of resources and economies of scale accounted for almost 60 to 90 percent of the growth in income per capita, with factor inputs (labour, capital and land) ex- plaining a relatively small percentage of the overall eco- nomic growth. This implies that the growth of the West- ern countries has been mainly driven by TFP growth rather than the growth in factor inputs, or by what so called productivity driven. This finding is supported by another recent study conducted by Kim and Lau [19], who find that almost 45 to 70 percent of the economic growth in five of the Organization for Economic Coop- eration and Development (OECD) countries was con- tributed by productivity growth. This growth phenome- non is somewhat different from the growth pattern ob- served in the East Asia Newly Industrialized Countries. Studies indicated that the growth of these countries has been mainly input-driven through massive factor accu- mulation rather th an productivity driven (Young [21,22], Krugman [23], Kim and Lau [19], Young [21], for ex- ample, finds that over the period of 1966-1990 produc- tivity growth in the aggregate non-agriculture economy ranges from as low as 0.2 percent in Singapore to a high of only 2.3 percent in Hong Kong, whereas in manufac- turing productivity ranges from a low of 1.0 percent in Singapore to a high of only 3.0 percent in South Korea (Elsadig [24]). [1] In conclusion of this section, the sustainability of economic growth will be highly dependent on the inter- action of technology and human capital that is will ap- peared in the form of TFP or technical progress. That is measuring the relationship between output and its total inputs (a weighted sum of all inputs), which represent the residual output changes not accounted by total factor input changes. Being a residual, changes in TFP are not influenced by changes in the various factors which affect technological progress such as the quality of factors of production, flexibility of resource use, capacity utilisa- tion, quality of management, economies of scale, and the like (Rao and Preston, [25]). In addition, it has been documented in empirical work on economic growth by Solow [15,16], that after accounting for physical and human capital accumulation, “something else” accounts for the bulk of output growth in most countries. Both physical and human capital accumulations are certainly critical for economic growth. This is should be the com- bined contribution of inputs used in the production ac- tivities. Additionally, the process becomes more complicated with the role of knowledge in the economic growth process. Knowledge obviously accounts for a part of the growth that is not accounted for by the other factors of production; namely capital a nd labour. In growth theory, the Solow residual is an unexplained residual of labour Copyright © 2011 SciRes. ME  E. M. AHMED449 and capital and it is attributable to the growth of TFP. The notion of TFP is interpreted as an “ind ex of all those factors other than labour and capital not explicitly ac- counted for but which contribute to the generation of output.” TFP refers to the additional output generated through enh ancements in the efficiency accounted for by such things as advancement in human capital, skills and expertise, acquisition of efficient management tech- niques and know-how, improvements in an organisation, gains from specialisation, introduction of new technol- ogy, innovation or upgrading of present technology and enhancement in Information and Communication Tech- nology (ICT), (Elsadig [24], [26] and [27]). The TFP is the indictor of technological progress expresses through the interaction between physical and digital technologies with human capital to make the differences between the countries and firms development based on the quality of human capital that is called the spillover effects which transfer the technology, the process and skills. Moreover, Madsen [28] states that from the time when the influential paper of Solow [15], it has been known that technological change has been an important factor behind the increasing labour productivity that has been experienced over the past century; see also Prescott [29] and Hall and Jones [30]. However, very little is known about the importance of ideas for growth in TFP, the international diffusion of ideas, the origin and the direc- tion of the flow of ideas since the second industrial revolution, and whether the spillover of ideas has de- terred or contributed to TFP convergence among the in- dustrialized countries. In the Solow [15] model techno- logical progress is exogenous and, as such, technological knowledge is a free good, i.e., it is free of charge and accessible to everybody. Solow did not discuss the im- plications of this for international knowledge spillovers; however, subsequent research in the neoclassical tradi- tion has suggested that technological knowledge is freely available internation ally; for a discussion of these issues, see Fagerberg [31]. It should be mentioned, that none of the exiting re- viewed studies has used labour productivity approach (intensive growth theory) to address the impact of trade on productivity growth. Economists are more interested in intensive growth, which is expressed as growth in output per worker (labour productivity). Moreover, an economy’s standard of living is not determined by its total output but by the amount of output available per person (Dollar and Sokoloff [32], Elsadig [24,26,27]). This study aims to investigate the role of decomposition of labour productivity growth into contributions of capi- tal deepening, increased usage of trade intensity, and the simultaneous contribution of the quality of these factors. This has expressed as the contribution of TFP intensity growth in accomplishing productivity driven growth in these economies and showing the spillover effects of the technology interaction with human capital. This paper gives details as follows. Section 2 contains descriptions on the estimation methods employed in this paper, Section 3 demonstrates details of the data. Results of the empirical analysis are explained in Section 4. Fi- nally, Section 5 presents the concluding remarks and recommendations. 2. Methods and Estimation In this paper, an attempt is made to apply the conven- tional growth accounting framework developed. These include results achieved by Solow [15,16], which finally brought to fruition by Kendrick [33,34] and further re- fined by Denison [19], Denison and Edward [35], Griliches and Jorgenson [36], Jorg enson et al. [37], Dol- lar and Sokoloff [32] and Elsadig [24,27]. The production function for economies can be repre- sented as follows: ,,,,,,,,,GDPtiFKt i Lt i EXPt i IMPt iTt i,, (1) where fo r Country 1,2,, 8i in Year 1965-2006, the output is annual real GDP, and the inputs are; real fixed physical capital K, number of persons employed (human capital) L, Exports EXP, Imports IMP and time T, that proxies for total factor productivity (TFP) as a tech- nological progress of the countries and an indicator of spillover effects. t The Divisia Index basically decomposes the aggregate output growth into the contribution of changes in inputs (such as aggregate capital, labour, exports and imports growth), and TFP growth. This calculates the productiv- ity indicators to show the reliability of the results gener- ated without considering statistical analysis (Mahadevan [38]). The paper attempts to fill this gap by developing the model below into a parametric model and providing its statistical analysis in the first step as follows; ln,.ln,.ln ,.ln, .ln, , GDPt iaKt iLt iEXPt i IMPt it i , (2) (t 1965-2006) where is the output elasticity with respect to cap ital, is the output elasticity with respect to labo ur, is the output elasticity with respect to expo rts, is the output elasticity with respect to imports a is the intercept or constant of the model1, is the residual term2, 1The intercept term, as usual, gives the mean or average effect on de- endent variable of all the variables excluded from the model. 2The residual term proxies for the total factor productivity growth that accounts for the technological progress of the economy through the quality of input terms. Copyright © 2011 SciRes. ME  E. M. AHMED 450 ln is the logarithm to transform the variables. Following Dollar and Sokoloff, [32], Wong [39], Felipe [40] and Elsadig [24,27]; when constant returns (1 ) to scale is imposed, Equation (2) becomes; ln,. ln,.ln,.ln, (1).l n,, GDPti aKtiEXPItiIMPti Lt it i (1965-2006) (3) t For the purposes of this paper, Equation (3) is trans- formed by dividing each term by L (labour input) and then the output elasticity is calculated with respect to capital deepening, exports and imports intensities, i.e., , and , respectively becomes; ln/,. ln/, .ln/ , ln/ ,, GDPLt ibKLt i EXPL ti MPLt it i (4) Then, it follows that ln/ ,GDPLt i is the contribution of labour pro- ductivity (outpu t per worker), ln/, , Lti is the contribution of Capital deep- ening, ln/ ,EXPL t i is the contribution of the exports intensity, ln/ , MPL t i is the contribution of imports in- tensity ,ti is the residual term that prox- ies for TFP intensity growth, ln/ ,TFPLt i is the difference operator denoting proportionate change rate. To calculate the average annual contribution growth rate of the TFP intensity and labour productivity as well as the contribution of the capital deepening, exports in- tensity and imports intensity, as the intercept (b) has no position in the calculation of the productivity growth rate Equation (4) becomes ln/,ln/,.ln / , .ln/,ln/, TFPLti GDPLtiKLti EXP LtiIMP Lti (5) Thus, Equation (5) expresses the decomposition of la- bour productivity g rowth into the contributions of capital deepening, increasing usage of exports and imports per unit of labour (trade intensity), and the simultaneous contribution of the quality of these factors. This is ex- pressed as the TFP intensity growth. 3. Data Sources The data for this paper were collected from various sec- ondary sources. Real GDP, real aggregate fixed capital, number of employment, exports and imports were col- lected from Asian Development Bank: Key indicators of developing Asia and Pacific countries, Statistical and Data Systems Division, and international financial statis- tics of International Monetary Fund, online database. As well as from the individual countries databases, World Development indictors of the World Bank and the Inter- national Labour Organization for the period of 1965- 2006. Due to lack of data on man-hours of work, the la- bour input index is constructed based on the number of persons employed which is considered to be very sig- nificant proxy of human capital when spillover effects is addressed. Moreover, following Mahadevan [41] GDP is adjusted to exclude the components of trade, both ex- ports and imports shares are found to have an out- standing influence on GDP growth. These feedback links are further strengthened by two-way relationship be- tween the growth of imports and exports. It has been documented in literature (Mahadevan, [41]), that a high level of intra-industry trade is associated with imports and exports moving together (Bernard and Jensen, [42]). 4. Results and Discussion In this paper, autoregressive estimator has been applied to Equation (4) of the modified model that is generated from Cobb-Douglas production function to measure the shift in the production functions of ASEAN 5 plus 3. An annual time series data over the period of 1965-2006 for GDP, aggregate physical capital, number of employment, exports and imports have been employed for the indi- vidual countries. Meanwhile, analysis of the data using Equation (4) has shown that most estimated coefficients of the explana- tory variables of the model mainly are significant at 5% and 10% levels. According to Durbin-H values the model has no problem of autocorrelation Table 1. In addition, the adjusted and t-values do not indicate multicol- linearity in the model Table 1. Meanwhile, the model used in this paper has been specified in first differences and the calculated growth rates and contribution of the productivity indicators were used in the discussions of results and findings of the study, the model is found to be stationary. This found to be consistent with the statement of Engle and Granger [43] of noble prize honour, that if economic relationships are specified in first differences instead of levels, the statistical difficulties due to non- stationary variables can be avoided because the differ- enced variables are usually stationary even if the original variables are not. 2 R Empirical Analysis In this paper, empirical analysis was carried out to com- pare the productivity indicators between 8th East Asian Copyright © 2011 SciRes. ME 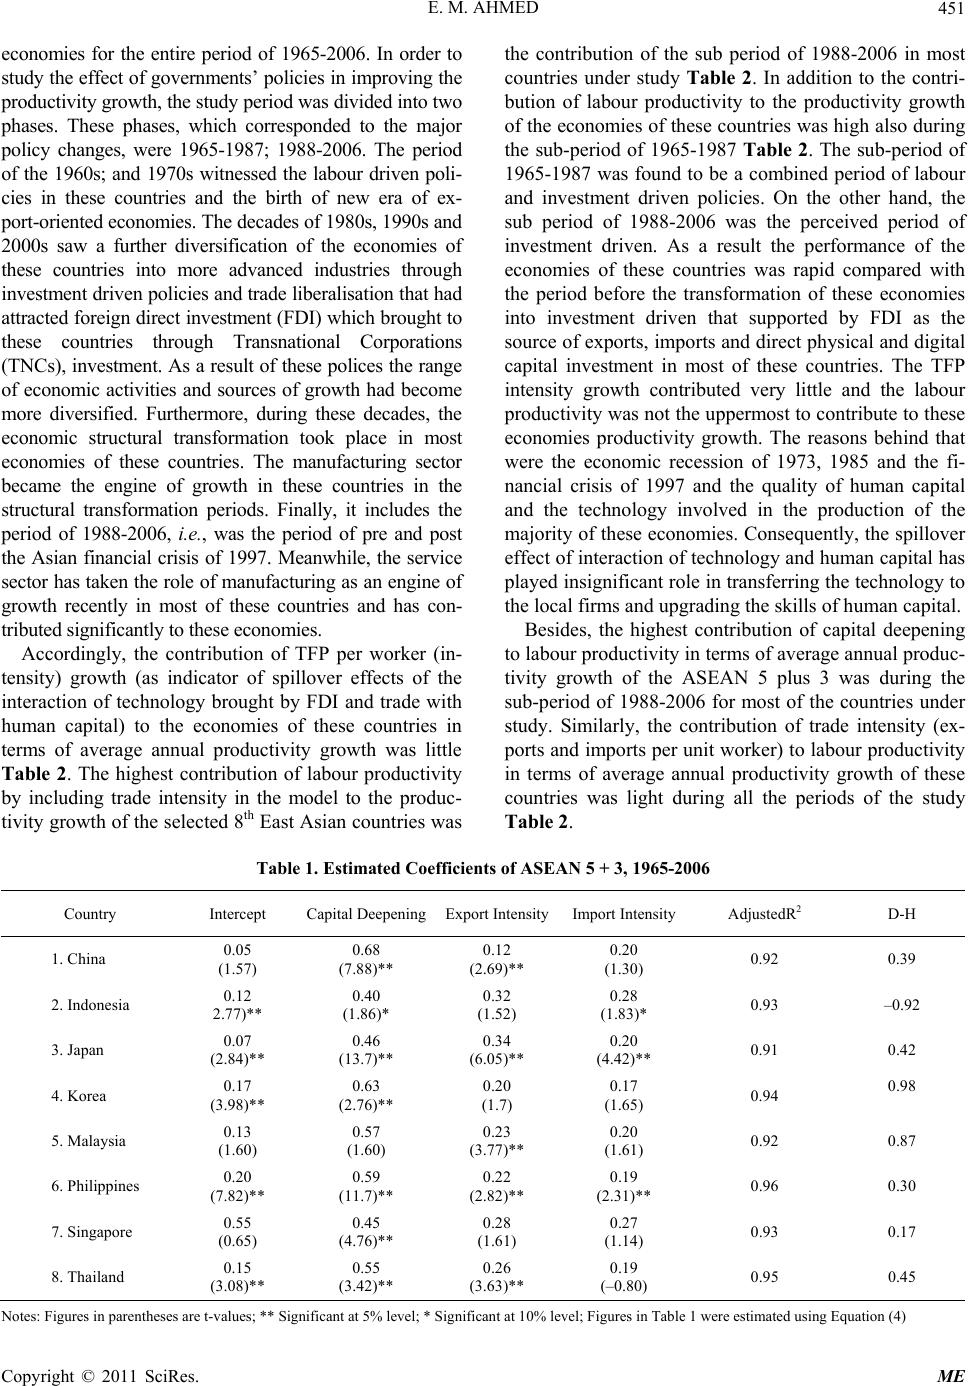 E. M. AHMED Copyright © 2011 SciRes. ME 451 economies for the entire period of 1965-2006. In order to study the effect of governments’ policies in improving the productivity growth, the study period was divided into two phases. These phases, which corresponded to the major policy changes, were 1965-1987; 1988-2006. The period of the 1960s; and 1970s witnessed the labour driven poli- cies in these countries and the birth of new era of ex- port-oriented economies. The decades of 1980s, 1990s and 2000s saw a further diversification of the economies of these countries into more advanced industries through investment driven policies and trade liberalisation that had attracted foreign direct investment (FDI) which brought to these countries through Transnational Corporations (TNCs), investment. As a result of these polices the range of economic activities and sources of growth had become more diversified. Furthermore, during these decades, the economic structural transformation took place in most economies of these countries. The manufacturing sector became the engine of growth in these countries in the structural transformation periods. Finally, it includes the period of 1988-2006, i.e., was the period of pre and post the Asian financial crisis of 1997. Meanwhile, the service sector has taken the role of manufacturing as an engine of growth recently in most of these countries and has con- tributed significantly to these economies. Accordingly, the contribution of TFP per worker (in- tensity) growth (as indicator of spillover effects of the interaction of technology brought by FDI and trade with human capital) to the economies of these countries in terms of average annual productivity growth was little Table 2. The highest contribution of labour productivity by including trade intensity in the model to the produc- tivity growth of the selected 8th East Asian countries was the contribution of the sub period of 1988-2006 in most countries under study Table 2. In addition to the contri- bution of labour productivity to the productivity growth of the economies of these countries was high also during the sub-period of 1965-1987 Table 2. The sub-period of 1965-1987 was found to be a combined period of labour and investment driven policies. On the other hand, the sub period of 1988-2006 was the perceived period of investment driven. As a result the performance of the economies of these countries was rapid compared with the period before the transformation of these economies into investment driven that supported by FDI as the source of exports, imports and direct ph ysical and digital capital investment in most of these countries. The TFP intensity growth contributed very little and the labour productivity was not the uppermost to contribute to these economies productivity growth. The reasons behind that were the economic recession of 1973, 1985 and the fi- nancial crisis of 1997 and the quality of human capital and the technology involved in the production of the majority of these economies. Consequently, the spillover effect of inter action of technology and hu man capital has played insignificant role in transferring the technology to the local firms and upgrading the skills of human capital. Besides, the highest contribution of capital deepening to labour productivity in terms of average annual produc- tivity growth of the ASEAN 5 plus 3 was during the sub-period of 1988-2006 for most of the countries under study. Similarly, the contribution of trade intensity (ex- ports and imports per unit worker) to labour productivity in terms of average annual productivity growth of these countries was light during all the periods of the study Table 2. Table 1. Estimated Coefficients of ASEAN 5 + 3, 1965-2006 Country Intercept Capit a l D eepeningExport IntensityImport IntensityAdjustedR2 D-H 1. China 0.05 (1.57) 0.68 (7.88)** 0.12 (2.69)** 0.20 (1.30) 0.92 0.39 2. Indonesia 0.12 2.77)** 0.40 (1.86)* 0.32 (1.52) 0.28 (1.83)* 0.93 –0.92 3. Japan 0.07 (2.84)** 0.46 (13.7)** 0.34 (6.05)** 0.20 (4.42)** 0.91 0.42 4. Korea 0.17 (3.98)** 0.63 (2.76)** 0.20 (1.7) 0.17 (1.65) 0.94 0.98 5. Malaysia 0.13 (1.60) 0.57 (1.60) 0.23 (3.77)** 0.20 (1.61) 0.92 0.87 6. Philippines 0.20 (7.82)** 0.59 (11.7)** 0.22 (2.82)** 0.19 (2.31)** 0.96 0.30 7. Singapore 0.55 (0.65) 0.45 (4.76)** 0.28 (1.61) 0.27 (1.14) 0.93 0.17 8. Thailand 0.15 (3.08)** 0.55 (3.42)** 0.26 (3.63)** 0.19 (–0.80) 0.95 0.45 Notes: Figures in parentheses are t-values; ** Significant at 5% level; * Significa nt at 10% level; Figures in Table 1 were estimated using Equation (4) 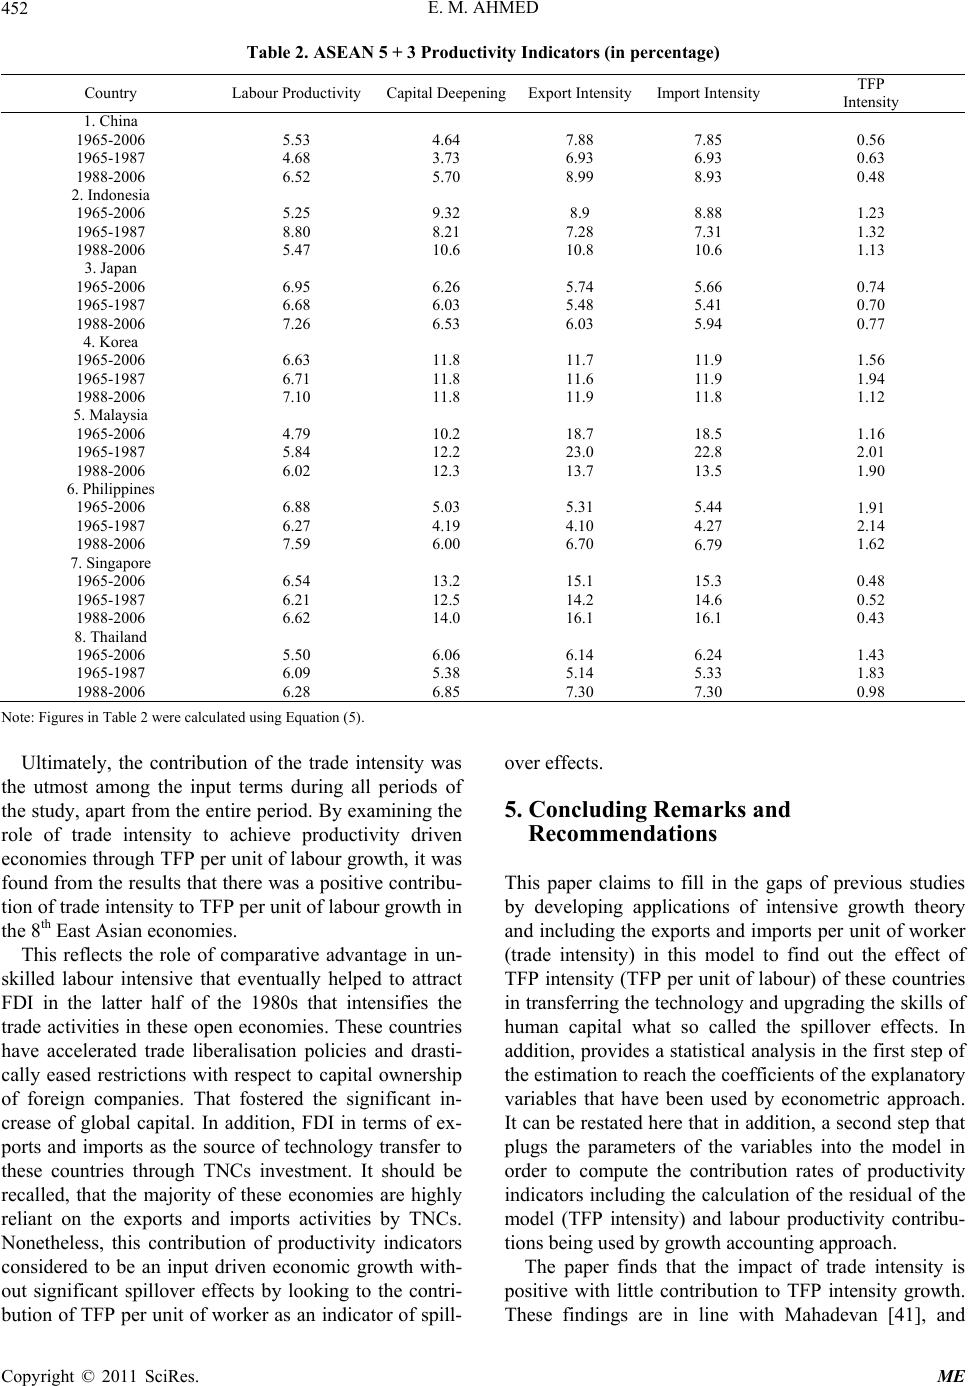 E. M. AHMED 452 Table 2. ASEAN 5 + 3 Productivity Indicators (in percentage) Country Labour Produ c t iv i t y Capital DeepeningExport IntensityImport Intensity TFP Intensity 1. China 1965-2006 1965-1987 1988-2006 5.53 4.68 6.52 4.64 3.73 5.70 7.88 6.93 8.99 7.85 6.93 8.93 0.56 0.63 0.48 2. Indonesia 1965-2006 1965-1987 1988-2006 5.25 8.80 5.47 9.32 8.21 10.6 8.9 7.28 10.8 8.88 7.31 10.6 1.23 1.32 1.13 3. Japan 1965-2006 1965-1987 1988-2006 6.95 6.68 7.26 6.26 6.03 6.53 5.74 5.48 6.03 5.66 5.41 5.94 0.74 0.70 0.77 4. Korea 1965-2006 1965-1987 1988-2006 6.63 6.71 7.10 11.8 11.8 11.8 11.7 11.6 11.9 11.9 11.9 11.8 1.56 1.94 1.12 5. Malaysia 1965-2006 1965-1987 1988-2006 4.79 5.84 6.02 10.2 12.2 12.3 18.7 23.0 13.7 18.5 22.8 13.5 1.16 2.01 1.90 6. Philippines 1965-2006 1965-1987 1988-2006 6.88 6.27 7.59 5.03 4.19 6.00 5.31 4.10 6.70 5.44 4.27 6.79 1.91 2.14 1.62 7. Singapore 1965-2006 1965-1987 1988-2006 6.54 6.21 6.62 13.2 12.5 14.0 15.1 14.2 16.1 15.3 14.6 16.1 0.48 0.52 0.43 8. Thailand 1965-2006 1965-1987 1988-2006 5.50 6.09 6.28 6.06 5.38 6.85 6.14 5.14 7.30 6.24 5.33 7.30 1.43 1.83 0.98 Note: Figures in Table 2 were calculated using E quation (5). Ultimately, the contribution of the trade intensity was the utmost among the input terms during all periods of the study, apart fro m the entire period. By examining the role of trade intensity to achieve productivity driven economies through TFP per unit of labour growth, it was found from the results that there was a positive contribu- tion of trade intensity to TFP per unit of labour growth in the 8th East Asian economies. This reflects the role of comparative advantage in un- skilled labour intensive that eventually helped to attract FDI in the latter half of the 1980s that intensifies the trade activities in these open economies. These countries have accelerated trade liberalisation policies and drasti- cally eased restrictions with respect to capital ownership of foreign companies. That fostered the significant in- crease of global capital. In addition, FDI in terms of ex- ports and imports as the source of technology transfer to these countries through TNCs investment. It should be recalled, that the majority of these economies are highly reliant on the exports and imports activities by TNCs. Nonetheless, this contribution of productivity indicators considered to be an input driven economic growth with- out significant spillover effects by looking to the contri- bution of TFP per unit of worker as an indicator of spill- over effects. 5. Concluding Remarks and Recommendations This paper claims to fill in the gaps of previous studies by developing applications of intensive growth theory and including the exports and imports per unit of worker (trade intensity) in this model to find out the effect of TFP intensity (TFP per unit of labour) of these countries in transferring the technology and upgrading the skills of human capital what so called the spillover effects. In addition, provides a statistical analysis in the first step of the estimation to reach the coefficients of the explanatory variables that have been used by econometric approach. It can be restated here that in addition, a second step that plugs the parameters of the variables into the model in order to compute the contribution rates of productivity indicators including the calculation of the residual of the model (TFP intensity) and labour productivity contribu- tions being used by growt h accountin g app ro ach. The paper finds that the impact of trade intensity is positive with little contribution to TFP intensity growth. These findings are in line with Mahadevan [41], and Copyright © 2011 SciRes. ME  E. M. AHMED453 Robert and David [44] findings; both find that TFP growth has no significant effect on exports or imports growth in some of these countries such as (Japan, Korea and Malaysia). Though, their findings should be put in the precise concept that trade intensity has no significant contribution to the TFP intensity of these countries. TFP is measuring the relationship between output and the quality of its total inputs (a weighted sum of all inputs), by this means giving the residual output changes not ac- counted by total factor input changes. Being a residual, changes in TFP are influenced by changes in the various factors which affect technological progress such as the quality of factors of production, flexibility of resource use, capacity utilisation, quality of management, econo- mies of scale through the quality of inputs not the quan- tity of the inputs. In this regard, the spillover effects which are viewing the interaction between technology and human capital will take place through TFP intensity contribution to display the technological progress of the economy brought to the local firms and skills upgrading of the local human capital. These results also confirm that trade intensity had a very significant role in achieving light labour productiv- ity contribution that is produced by these economies through using huge input to produce output. Apprecia- tion to FDI that is helped the manufacturing sector to become the engine of economic growth instead of agri- cultural sector when economic structural transformation took place at most of these economies and recently the service sector has over taken the manufacturing sector role to be the engine of growth in most of these countries. Unlike other Eastern Asian nations Japan model that is followed by South Korean model had constructed com- panies such as Daewoo, Samsung and LG, those com- peted globally side by side with their Japanese counter- parts in the automobile and electronics and electrical industries and products. This indicates the spillover ef- fects that took place in Japan and South Korea through technology transfer and human capital skills upgrading that translated their products to high quality products and their ability to compete and led the global markets. In addition to their companies to led the foreign direct in- vestment in East Asia and the rest of the world. 6. References [1] J. Juthathip, “Determinants of Export Performance in East and Southeast Asia,” ERD Working Paper, Asian Development Bank No. 106, 2007. [2] R. W. Jones and H. Kierzkowski, “A Framework for Fragmentation.” In: S. W. Arndt and H. Kierzkowski, Eds., Fragmentation: New Production Patterns in the World Economy, Oxford University Press, New York, 2001. [3] S. W. Arndt and A. Huemer, “Trade, Production Net- works and the Exchange Rate,” Lowe Institute of Politi- cal Economy, Claremont McKenna College, 2004. http://ssrn.com/abstract=900416. [4] M. Obstfeld, “Exchange Rates and Adjustment: Perspec- tives from the New Open-Economy Macroeconomics,” Discussion Paper 3533, Centre for Economic Policy Re- search, London, 2002. [5] J. E. Rauch and V. Trindade, “Information, International Substitutability and Globalization,” University of Cali- fornia, San Diego and Syracuse University, 2002. [6] G. Blalock and F. M. Veloso, “Imports, Productivity Growth, and Supply Chain Learning,” World Develop- ment, Vol. 35, No. 7, 2007, pp. 1134-1151. doi:10.1016/j.worlddev.2006.10.009 [7] W. Keller, “Do Trade Patterns and Technology Flows Affect Productivity Growth,” World Bank Economic Re- view, Vol. 14, No. 1, 2000, pp. 17-47. [8] K. Saggi, ‘Trade, Foreign Direct Investment, and Interna- tional Technology Transfer: A Survey,” World Bank Re- search Observer, 2002. [9] S. Werner, “Recent Development in International Man- agement Research: A Review of 20 Top Management Journals,” Journal of Management, Vol. 28, No. 3, 2002, pp. 277-305. [10] M. Amiti and J. Konings, “Trade Liberalization, Interme- diate Inputs, and Productivity: Evidence from Indonesia,” American Economic Review, Vol. 97, No. 5, 2007, pp. 1611-1638. [11] A. M. Fernandes, “Trade Policy, Trade Volumes, and Plant-Level Productivity in Colombian Manufacturing Industries,” Journal of International Economics, Vol. 71, No. 1, 2007, pp. 52-71. [12] W. Keller and S. R. Yeaple, “Multinational Enterprises, International Trade, and Productivity Growth: Firm Level Evidence from the United States,” Discussion Paper, Working Paper 9504, National Bureau of Economics Re- search, Cambridge, February 2003. [13] M. MacGarvie, “Do Firms Learn from International Trade,” Review of Economics and Statistics, Vol. 88, No. 1, 2006, pp. 46-60. [14] M. A. Muendler, “Trade, Technology, and Productivity: A Study of Brazilian Manufacturers 1986-1998,” CESifo Working Paper No. 1148, Ifo Institute for Economic Re- search, Munich, 2004. [15] R. M. Solow, “The Production Function and the Theory of Capital,” Review of Economics Studies, Vol. XXIII, 1956, pp. 101-108. [16] R. M. Solow, “Technical Change and the Aggregate Pro- duction Function,” Review of Economics and Statistics, Vol. 39, 1957, pp. 312-320. [17] M. Abramovitz, “Resource and Output Trends in the United States since 1870,” American Economic Review, Vol. 46, No. 2, 1956, pp. 5-23. [18] E. F. Denison, “Why Growth Rates Differ,” Brookings, Washington D.C, 1967. Copyright © 2011 SciRes. ME  E. M. AHMED Copyright © 2011 SciRes. ME 454 [19] J.-II Kim, and L. Lau, “The Sources of Economic Growth of the East Asian Newly Industrialised Countries,” Jour- nal of Japanese and International Economies, Vol. 8, No. 3, 1994, pp. 235-271. doi:10.1006/jjie.1994.1013 [20] E. F. Denison, “The Sources of Economic Growth in the United States and the Alternative before Use,” Supple- mentary Study, Committee for Economic Development, New York, 1962, pp. 229-255. [21] A. Young, “A Tale of Two Cities; Factor Accumulation and Technological Change in Hong-Kong and Singa- pore,” Macroeconomics Annual, National Bureau of Economic Research, 1992, pp. 13-54. [22] A. Young, “The Tyranny of Numbers; Confronting the Statistical Realities of the East Asian Growth Experi- ence,” Quarterly Journal of Economics, Vol. 110, No. 3, 1995, pp. 641-680. doi:10.2307/2946695 [23] P. Krugman, “The Myth of Asia’s Miracle,” Foreign Affairs, November-December 1994, pp. 62-78. [24] M. A. Elsadig, ‘Foreign Direct Investment Intensity Ef- fects on TFP Intensity of ASEAN 5 Plus 2,” Journal of Economic Development, Vol. 33, No. 2, 2008, pp. 155- 166. [25] P. S. Rao and R. S. Preston. “Inter-Factor Substitution, Economic of Scale, and Technical Change: Evidence from Canadian Industries,” Empirical Economics, Vol. 9, No. 4, 1984, pp. 247-62. [26] M. A. Elsadig, “Biochemical Oxygen Demand Emissions Impact On Malaysia’s Manufacturing Productivity Growth,” Global Economic Review, Vol. 36, No. 4, 2007, pp. 305-319. [27] M. A. Elsadig, “Carbon Dioxide Emissions, Impact on Malaysia’s Manufacturing Productivity Growth,” World Review of Science, Technology and Sustainable Devel- opment, Vol. 3, No. 1, 2006, pp. 58-69. [28] J. Madsen, “Economic Growth, TFP Convergence and the World Export of Ideas: A Century of Evidence,” The Scandinavian Journal of Economics, Vol. 110, No. 1, 2008, pp. 145-167. [29] E. C. Prescott, “Needed: A Theory of Total Factor Pro- ductivity,” International Economic Review, Vol. 39, No. 3, 1998, pp. 525-551. [30] Hall, R. Hall, C. Jones, “Why Do Some Countries Pro- duce So Much More Output per Worker than Others?” Quarterly Journal of Economics, Vol. 114, No. 1, 1999, pp. 83-116. [31] J. Fagerberg, “Technology and International Differences in Growth Rates,” Journal of Economic Literature, Vol. 32, 1994, pp. 1147-1175. [32] D. Dollar and K Sokoloff, “Patterns of Productivity Growth in South Korean Manufacturing Industries 1963-1979,” Journal of Development Economics, Vol. 33, No. 2, 1990, pp. 309-327. doi:10.1016/0304-3878(90)90026-8 [33] J. W. Kendrick, “Producative Trends Capital and La- bour,” Review of Economics and Statistics, Vol. 38, No. 3, 1956, pp. 248-257. doi:10.2307/1925777 [34] J. W. Kendrick, “Productivity Trends in the United States,” Princeton University Press, Princeton, 1961. [35] E. F. Denison and P. Edward, “Accounting of Slower Economic Growth; the United States in the 1970s,” The Brooking Institution, Washington DC, 1979. [36] Z. Griliches and D. W. Jorgenson, “Capital Theory: Technical Progress and Capital Structure, Sources of Measured Productivity Change Capital Input,” American Economic Review, Vol. 52, No. 1, 1962, pp. 50-61. [37] D. W. Jorgenson, F. M. Gollop and B. Fraumenri, “Pro- ductivity and US Economic Growth,” Amsterdam North Holland, 1987. [38] R. Mahadevan, “Assessing the Output and Productivity Growth of Malaysia’s Manufacturing Sector,” Journal of Asian Economics, Vol. 12, No. 4, 2001, pp. 587-597. doi:10.1016/S1049-0078(01)00104-X [39] F.C. Wong, “Patterns of Labour Productivity Growth and Employment Shift in the Singapore Manufacturing In- dustries,” The Singapore Economic Review, Vol. 38, No. 2, 1993, pp. 231-251. [40] J. Felipe, “On the Myth and Mystery of Singapore’s Zero TFP,” Asian Economic Journal, Vol. 14, No. 2, 2000, pp. 187-208. doi:10.1111/1467-8381.00108 [41] R Mahadevan, “New Evidence on the Export-led Growth Nexus: A Case Study of Malaysia,” The World Economy, Vol. 30, No. 7, 2007, pp. 1069-1083. doi:10.1111/j.1467-9701.2007.01030.x [42] A. B. Bernard and B. Jensen, “Exporting and Productivity in the USA,” Oxford Review of Economic Policy, Vol. 20, No. 3, 2004, pp. 343-357. doi:10.1093/oxrep/grh020 [43] R. F. Engle and C. W. J. Granger, “Time-Series Econo- metrics: Cointegration and Autoregressive Conditional Heteroskedasticity,” Advanced Information on the Bank of Sweden Prize in Economic Sciences in Memory of Al- fred Nobel, 2003. [44] Z. L. Robert and D. E. David, “Trade and Growth: Import Led or Export Led? Evidence from Japan and Korea,” Center on Japanese Economy and Business Columbia Business School, Working Paper, No. 165, 1999, pp. 1- 29.
|