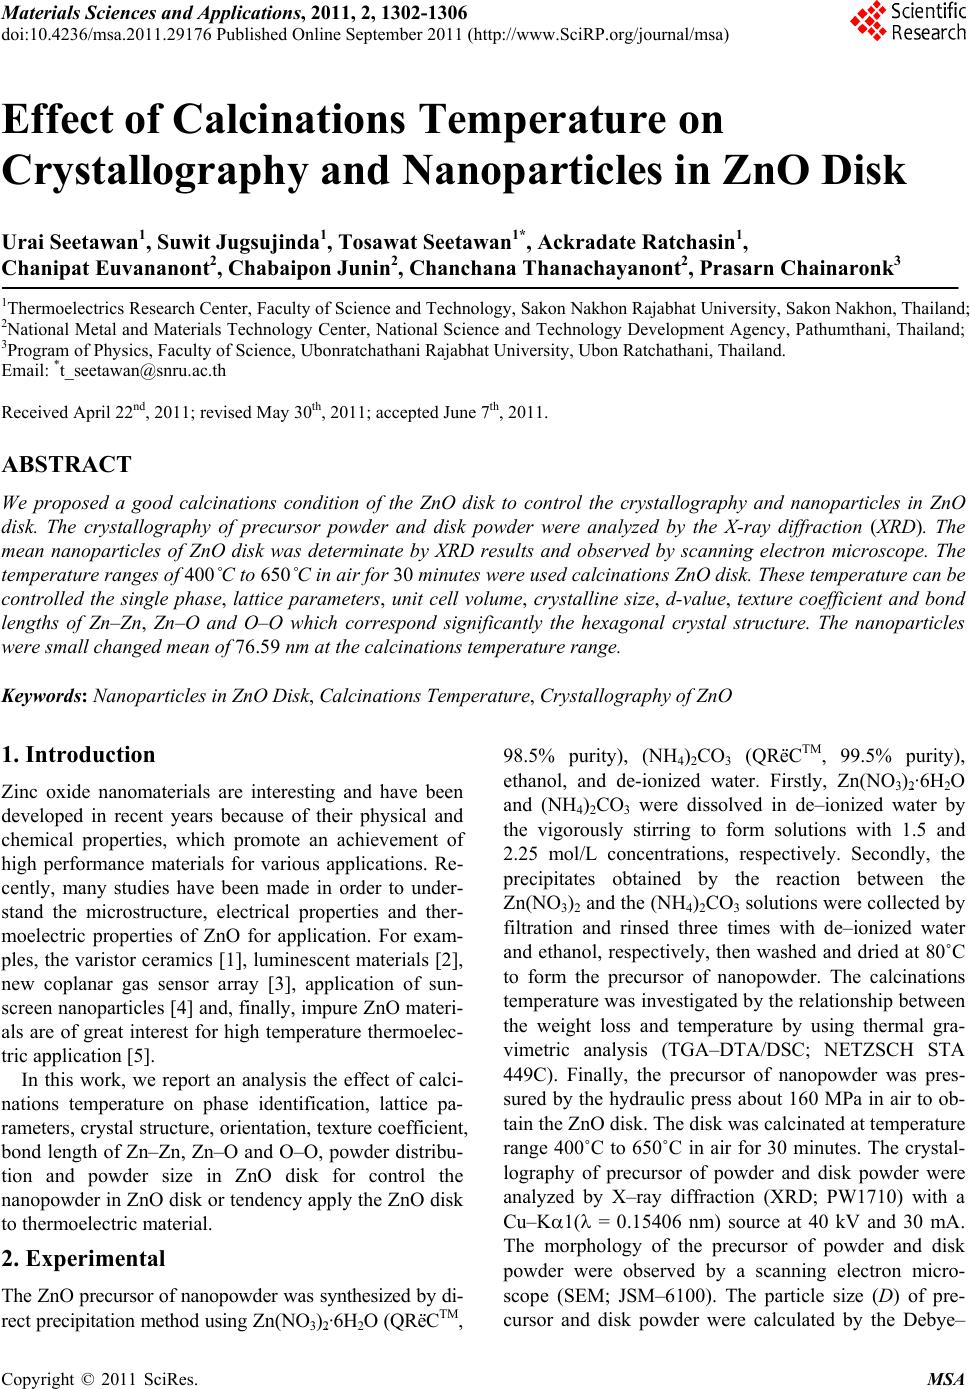
 Materials Sciences and Applications, 2011, 2, 1302-1306 doi:10.4236/msa.2011.29176 Published Online September 2011 (http://www.SciRP.org/journal/msa) Copyright © 2011 SciRes. MSA Effect of Calcinations Temperature on Crystallography and Nanoparticles in ZnO Disk Urai Seetawan1, Suwit Jugsujinda1, Tosawat Seetawan1*, Ackradate Ratchasin1, Chanipat Euvananont2, Chabaipon Junin2, Chanchana Thanachayanont2, Prasarn Chainaronk3 1Thermoelectrics Research Center, Faculty of Science and Technology, Sakon Nakhon Rajabhat University, Sakon Nakhon, Thailand; 2National Metal and Materials Technology Center, National Science and Technology Development Agency, Pathumthani, Thailand; 3Program of Physics, Faculty of Science, Ubonratchathani Rajabhat University, Ubon Ratchathani, Thailand. Email: *t_seetawan@snru.ac.th Received April 22nd, 2011; revised May 30th, 2011; accepted June 7th, 2011. ABSTRACT We proposed a good calcinations condition of the ZnO disk to control the crystallography and nanoparticles in ZnO disk. The crystallography of precursor powder and disk powder were analyzed by the X-ray diffraction (XRD). The mean nanoparticles of ZnO disk was determinate by XRD results and observed by scanning electron microscope. The temperature ranges of 400˚C to 650˚C in air for 30 minutes were used calcinations ZnO disk. These temperature can be controlled the single phase, lattice parameters, unit cell volume, crystalline size, d-value, texture coefficient and bond lengths of Zn–Zn, Zn–O and O–O which correspond significantly the hexagonal crystal structure. The nanoparticles were small changed mean of 76.59 nm at the calcinations temperature range. Keywords: Nanoparticles in ZnO Disk, Calcinations Temperature, Crystallography of ZnO 1. Introduction Zinc oxide nanomaterials are interesting and have been developed in recent years because of their physical and chemical properties, which promote an achievement of high performance materials for various applications. Re- cently, many studies have been made in order to under- stand the microstructure, electrical properties and ther- moelectric properties of ZnO for application. For exam- ples, the varistor ceramics [1], luminescent materials [2], new coplanar gas sensor array [3], application of sun- screen nanoparticles [4] and, finally, impure ZnO materi- als are of great interest for high temperature thermoelec- tric application [5]. In this work, we report an analysis the effect of calci- nations temperature on phase identification, lattice pa- rameters, crystal structure, orientation, texture coefficient, bond length of Zn–Zn, Zn–O and O–O, powder distribu- tion and powder size in ZnO disk for control the nanopowder in ZnO disk or tendency apply the ZnO disk to thermoelectric material. 2. Experimental The ZnO precursor of nanopowder was synthesized by di- rect precipitation method using Zn(NO3)2 ฺ·6H2O (QRëCTM, 98.5% purity), (NH4)2CO3 (QRëCTM, 99.5% purity), ethanol, and de-ionized water. Firstly, Zn(NO3)2 ฺ·6H2O and (NH4)2CO3 were dissolved in de–ionized water by the vigorously stirring to form solutions with 1.5 and 2.25 mol/L concentrations, respectively. Secondly, the precipitates obtained by the reaction between the Zn(NO3)2 and the (NH4)2CO3 solutions were collected by filtration and rinsed three times with de–ionized water and ethanol, respectively, then washed and dried at 80˚C to form the precursor of nanopowder. The calcinations temperature was investigated by the relationship between the weight loss and temperature by using thermal gra- vimetric analysis (TGA–DTA/DSC; NETZSCH STA 449C). Finally, the precursor of nanopowder was pres- sured by the hydraulic press about 160 MPa in air to ob- tain the ZnO disk. The disk was calcinated at temperature range 400˚C to 650˚C in air for 30 minutes. The crystal- lography of precursor of powder and disk powder were analyzed by X–ray diffraction (XRD; PW1710) with a Cu–K1( = 0.15406 nm) source at 40 kV and 30 mA. The morphology of the precursor of powder and disk powder were observed by a scanning electron micro- scope (SEM; JSM–6100). The particle size (D) of pre- cursor and disk powder were calculated by the Debye– 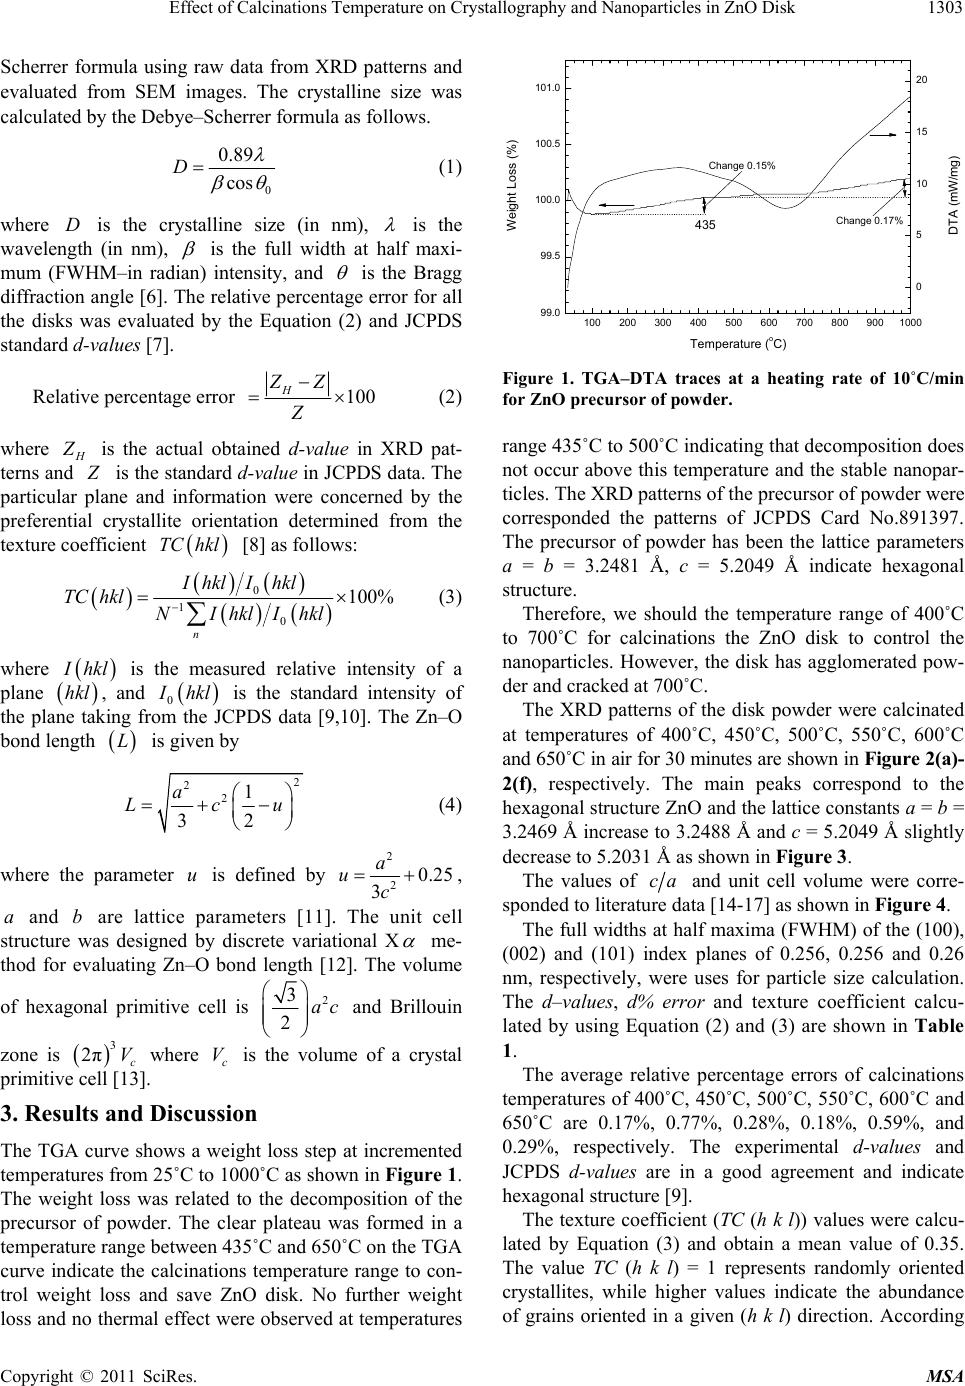 Effect of Calcinations Temperature on Crystallography and Nanoparticles in ZnO Disk1303 Scherrer formula using raw data from XRD patterns and evaluated from SEM images. The crystalline size was calculated by the Debye–Scherrer formula as follows. 0 0.89 cos D (1) where is the crystalline size (in nm), D is the wavelength (in nm), is the full width at half maxi- mum (FWHM–in radian) intensity, and is the Bragg diffraction angle [6]. The relative percentage error for all the disks was evaluated by the Equation (2) and JCPDS standard d-values [7]. Relative percentage error 100 H ZZ (2) where is the actual obtained d-value in XRD pat- terns and is the standard d-value in JCPDS data. The particular plane and information were concerned by the preferential crystallite orientation determined from the texture coefficient [8] as follows: TC hkl 0 1 0 100% n Ihkl I hkl TC hklNIhklIhkl (3) where hkl hkl is the measured relative intensity of a plane , and 0 hkl is the standard intensity of the plane taking from the JCPDS data [9,10]. The Zn–O bond length is given by L 2 2 21 32 a Lcu (4) where the parameter is defined by u 2 20.25 3 a uc , a and b are lattice parameters [11]. The unit cell structure was designed by discrete variational X me- thod for evaluating Zn–O bond length [12]. The volume of hexagonal primitive cell is 2 3 2ac and Brillouin zone is where is the volume of a crystal primitive cell [13]. 3 2πc Vc V 3. Results and Discussion The TGA curve shows a weight loss step at incremented temperatures from 25˚C to 1000˚C as shown in Figure 1. The weight loss was related to the decomposition of the precursor of powder. The clear plateau was formed in a temperature range between 435˚C and 650˚C on the TGA curve indicate the calcinations temperature range to con- trol weight loss and save ZnO disk. No further weight loss and no thermal effect were observed at temperatures 100 200 300 400 500 600700 800 9001000 99.0 99.5 100.0 100.5 101.0 Weight Loss (%) Temperature (oC) Change 0.17% DTA (mW/mg) Change 0.15% 0 5 10 15 20 435 Figure 1. TGA–DTA traces at a heating rate of 10˚C/min for ZnO precursor of powder. range 435˚C to 500˚C indicating that decomposition does not occur above this temperature and the stable nanopar- ticles. The XRD patterns of the precursor of powder were corresponded the patterns of JCPDS Card No.891397. The precursor of powder has been the lattice parameters a = b = 3.2481 Å, c = 5.2049 Å indicate hexagonal structure. Therefore, we should the temperature range of 400˚C to 700˚C for calcinations the ZnO disk to control the nanoparticles. However, the disk has agglomerated pow- der and cracked at 700˚C. The XRD patterns of the disk powder were calcinated at temperatures of 400˚C, 450˚C, 500˚C, 550˚C, 600˚C and 650˚C in air for 30 minutes are shown in Figure 2(a)- 2(f), respectively. The main peaks correspond to the hexagonal structure ZnO and the lattice constants a = b = 3.2469 Å increase to 3.2488 Å and c = 5.2049 Å slightly decrease to 5.2031 Å as shown in Figure 3. The values of ca and unit cell volume were corre- sponded to literature data [14-17] as shown in Figure 4. The full widths at half maxima (FWHM) of the (100), (002) and (101) index planes of 0.256, 0.256 and 0.26 nm, respectively, were uses for particle size calculation. The d–values, d% error and texture coefficient calcu- lated by using Equation (2) and (3) are shown in Table 1. The average relative percentage errors of calcinations temperatures of 400˚C, 450˚C, 500˚C, 550˚C, 600˚C and 650˚C are 0.17%, 0.77%, 0.28%, 0.18%, 0.59%, and 0.29%, respectively. The experimental d-values and JCPDS d-values are in a good agreement and indicate hexagonal structure [9]. The texture coefficient (TC (h k l)) values were calcu- lated by Equation (3) and obtain a mean value of 0.35. The value TC (h k l) = 1 represents randomly oriented crystallites, while higher values indicate the abundance of grains oriented in a given (h k l) direction. According Copyright © 2011 SciRes. MSA 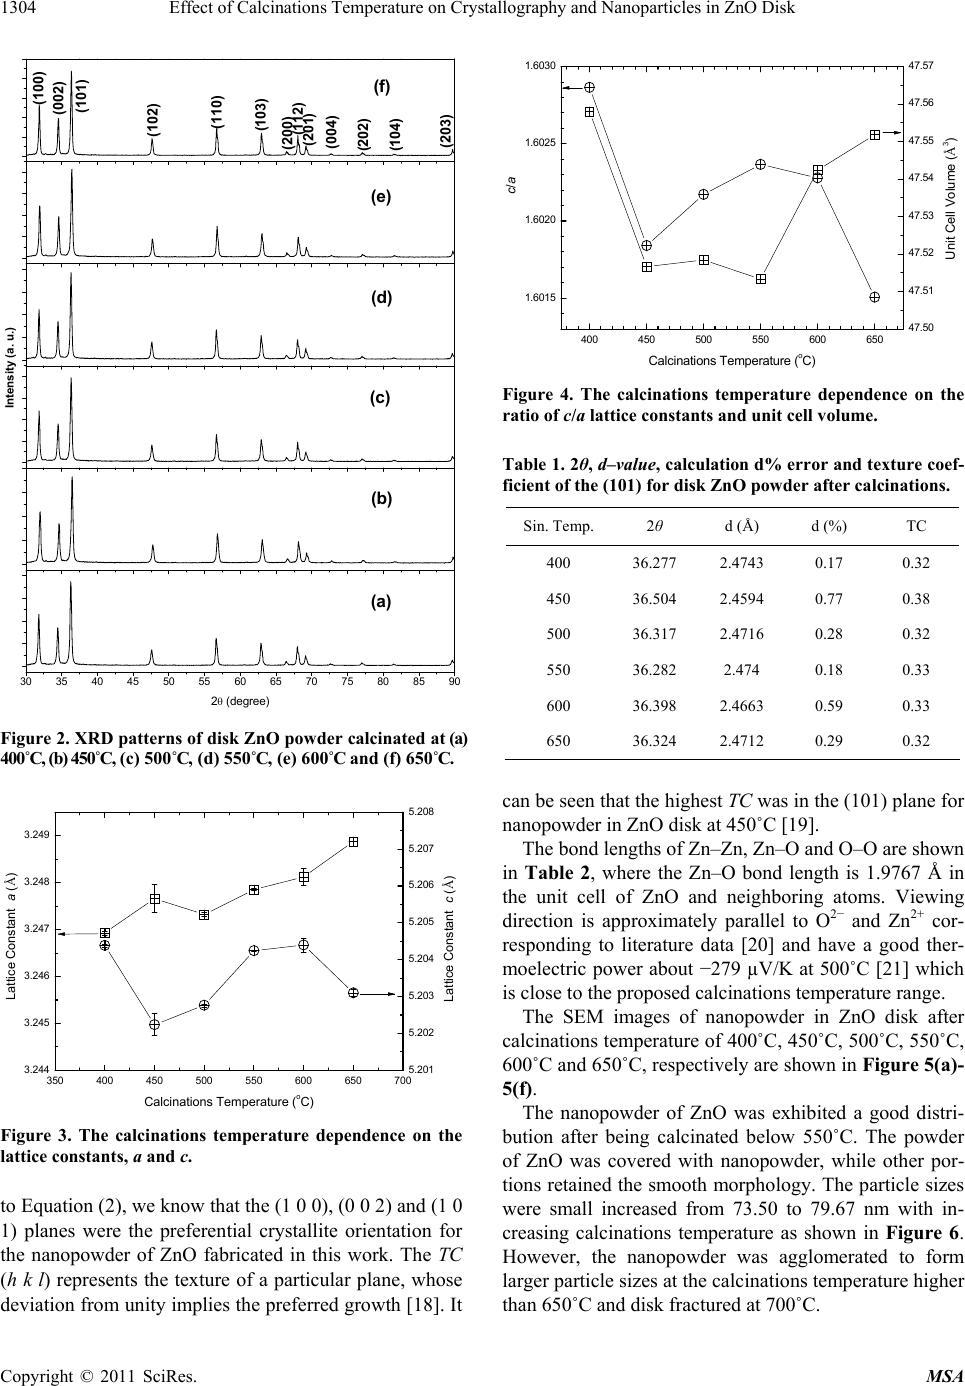 Effect of Calcinations Temperature on Crystallography and Nanoparticles in ZnO Disk 1304 (f) (203) (104) (202) (004) (201) (112) (200) (103) (110) (102) (101) (002) (100) (e) (d) Intensity (a. u.) (c) (b) 30 35 40 45 50 5560 65 70 75 80 85 90 2 (degree) (a) Figure 2. XRD patterns of disk ZnO powder calcinated at (a) 400˚C, (b) 450˚C, (c) 500˚C, (d) 550˚C, (e) 600˚C and (f) 650˚C. 350 400 450 500 550 600 650 700 3.244 3.245 3.246 3.247 3.248 3.249 Lattice Const an t c (Å) Lattice Constant a (Å) Calcinations Temperature ( oC) 5.201 5.202 5.203 5.204 5.205 5.206 5.207 5.208 Figure 3. The calcinations temperature dependence on the lattice constants, a and c. to Equation (2), we know that the (1 0 0), (0 0 2) and (1 0 1) planes were the preferential crystallite orientation for the nanopowder of ZnO fabricated in this work. The TC (h k l) represents the texture of a particular plane, whose deviation from unity implies the preferred growth [18]. It 400 450 500 550 600 650 1.6015 1.6020 1.6025 1.6030 Unit Cell Volume (Å3) c/a Calcinations Temperature (oC) 47.50 47.51 47.52 47.53 47.54 47.55 47.56 47.57 Figure 4. The calcinations temperature dependence on the ratio of c/a lattice constants and unit cell volume. Table 1. 2θ, d–value, calculation d% error and texture coef- ficient of the (101) for disk ZnO powder after calcinations. Sin. Temp. 2θ d (Å) d (%) TC 400 36.277 2.4743 0.17 0.32 450 36.504 2.4594 0.77 0.38 500 36.317 2.4716 0.28 0.32 550 36.282 2.474 0.18 0.33 600 36.398 2.4663 0.59 0.33 650 36.324 2.4712 0.29 0.32 can be seen that the highest TC was in the (101) plane for nanopowder in ZnO disk at 450˚C [19]. The bond lengths of Zn–Zn, Zn–O and O–O are shown in Table 2, where the Zn–O bond length is 1.9767 Å in the unit cell of ZnO and neighboring atoms. Viewing direction is approximately parallel to O2− and Zn2+ cor- responding to literature data [20] and have a good ther- moelectric power about −279 µV/K at 500˚C [21] which is close to the proposed calcinations temperature range. The SEM images of nanopowder in ZnO disk after calcinations temperature of 400˚C, 450˚C, 500˚C, 550˚C, 600˚C and 650˚C, respectively are shown in Figure 5(a)- 5(f). The nanopowder of ZnO was exhibited a good distri- bution after being calcinated below 550˚C. The powder of ZnO was covered with nanopowder, while other por- tions retained the smooth morphology. The particle sizes were small increased from 73.50 to 79.67 nm with in- creasing calcinations temperature as shown in Figure 6. However, the nanopowder was agglomerated to form larger particle sizes at the calcinations temperature higher than 650˚C and disk fractured at 700˚C. Copyright © 2011 SciRes. MSA  Effect of Calcinations Temperature on Crystallography and Nanoparticles in ZnO Disk1305 Table 2. The bond length lists of ZnO compound. 1 th (Å) 2nd (Å) 3th (Å) 4th (Å) 5th (Å) Zn–Zn 3.2138 3.2568 4.5755 5.2125 5.6162 Zn–O 1.9767 1.9959 3.2166 3.8099 3.8197 O–O 3.2138 3.2568 4.5755 5.2125 5.6162 (a) (b) (c) (d) (e) (f) 400 C450 C 500 C550 C 600 C650 C Figure 5. SEM morphology of ZnO disk powder after cal- cinated at (a) 400˚C, (b) 450˚C, (c) 500˚C, (d) 550˚C, (e) 600˚C and (f) 650˚C. 400 450 500 550 600 650 73 74 75 76 77 78 79 80 81 Particle Size (nm) Calcinations Temperature (oC) Figure 6. The calcinations temperature dependence on par- ticle sizes of ZnO disk powder. 4. Conclusions The temperature range of 400˚C to 650˚C was chosen for calcinations temperature and controled the nanoparticle in ZnO disk. The crystallography of disk powder was corresponding to the hexagonal structure and the lattice constants. The experimental d–values were in a good agreement with JCPDS I and indicated the hexagonal structure. The Zn–O bond length of 1.9767 Å was related with ZnO unit cell viewed direction approximate parallel to O2− and Zn2+. The disk powder was exhibited good distribution after being calcinated below 550˚C covering with the nanoparticles, while other portions retained the smooth morphology and the mean particle size of 76.59. 5. Acknowledgements Financial support was provided by the Electricity Gener- ating Authority of Thailand, EGAT (52-2115-043-JOB No. 803-SNRU). REFERENCES [1] D. Xu, X. F. Shi, X. N. Cheng, J. Yang, Y. E. Fan, H. M. Yuan and L. Y. Shi, “Microstructure and Electrical Prop- erties of Lu2O3–Doped ZnO–Bi2O3–Based Varistor Ce- ramics,” Transactions of Nonferrous Metals Society of China, Vol. 20, No. 12, December 2010, pp. 2303-2308. doi:10.1016/S1003-6326(10)60645-0 [2] N. Hagura, T. Ogi, T. Shirahama, F. Iskandar and K. Okuyama, “Highly luminescent Silica–Coated ZnO Nano- particles Dispersed in Anaqueousmedium,” Journal of Luminescence, Vol. 131, No. 5, May 2011, pp. 921-925. doi:10.1016/j.jlumin.2010.12.024 [3] C. Li, S. Zhang, M. Hu and C. Xie, “Nanostructural ZnO Based Coplanar Gas Sensor Arrays from the Injection of Metal Chloride Solutions: Device Processing, Gas-Sens- ing Properties and Selectivity in Liquors Applications,” Sensors and Actuators B, Vol. 153, No. 2, April 2011, pp. 415-420. .doi:10.1016/j.snb.2010.11.008 [4] A. P. Popov, A. V. Priezzhev, J. Lademann and R. Myllylä, “Alteration of Skin Light–Scattering and Ab- sorption Properties by Application of Sunscreen Nanoparticles: A Monte Carlo Study,” Journal of Quan- titative Spectroscopy & Radiative Transfer, 2011, Article in Press. [5] X. Qu, W. Wang, S. Lva and D. Jia, “Thermoelectric Properties and Electronic Structure of Al–Doped ZnO,” Solid State Communications, Vol. 151, No. 4, February 2011, pp. 332-336. doi:10.1016/j.ssc.2010.11.020 [6] C. Chen, B. Yu, J. Liu, Q. Dai and Y. Zhu, “Investigation of ZnO Films on Si(111) Substrate Grown by Low En- ergy O+ Assisted Pulse Laser Deposited Technology,” Material Letters, Vol. 61, No. 14-15, June 2007, pp. 2961-2964. [7] D. P. Padiyan and A. Marikani, “X–Ray Determination of Lattice Constants of CdXSn1–XSe Mixed Crystal Sys- tems,” Crystal Research and Technology, Vol. 37, No. 11, November 2002, pp. 1241-1248. doi:10.1002/1521-4079(200211)37:11<1241::AID-CRAT 1241>3.0.CO;2-C Copyright © 2011 SciRes. MSA 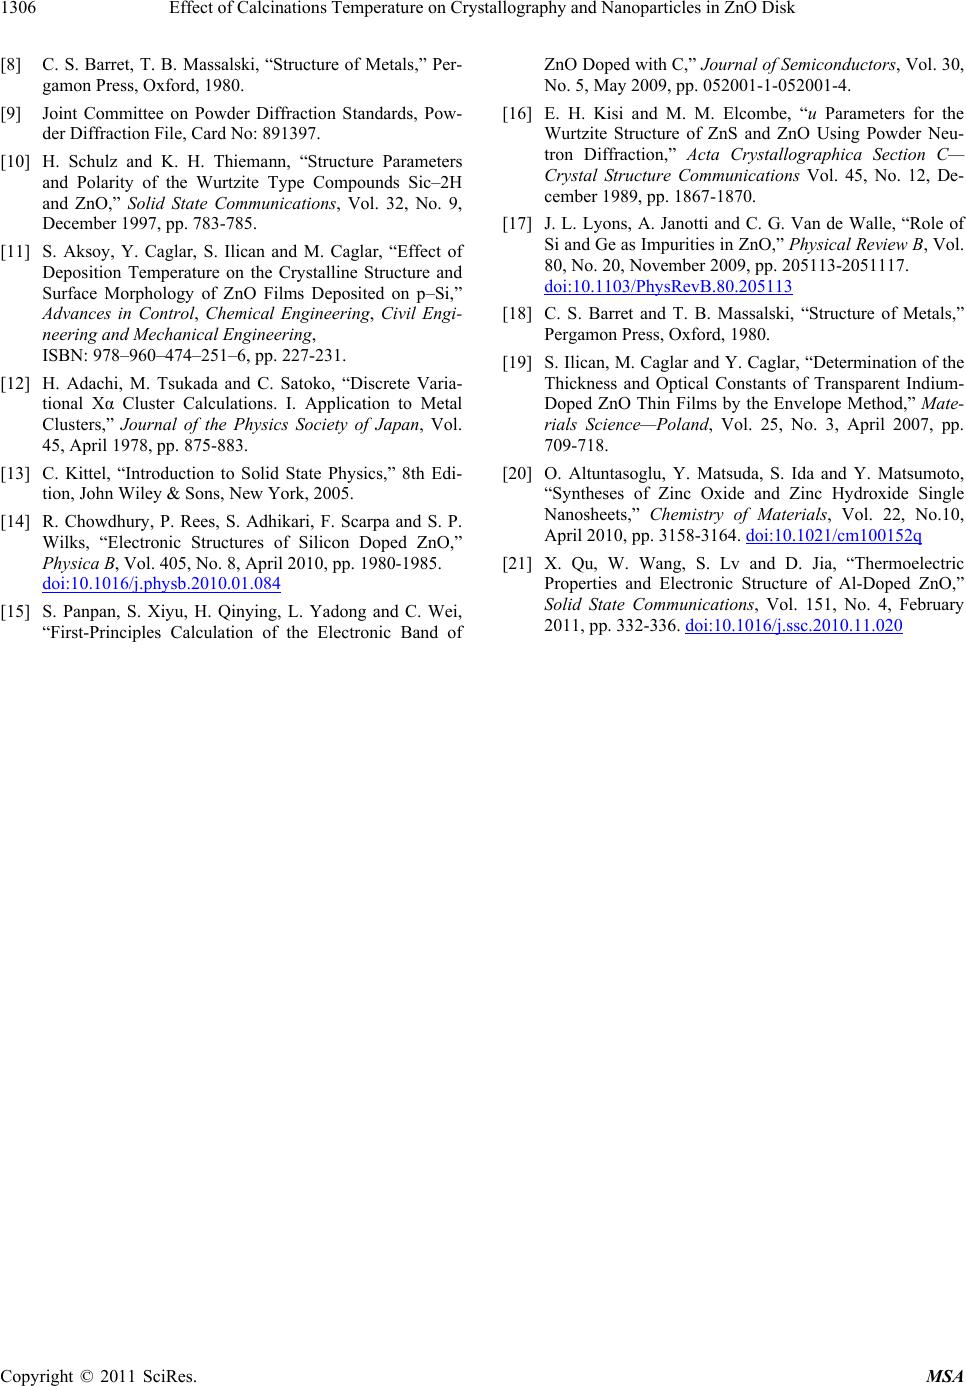 Effect of Calcinations Temperature on Crystallography and Nanoparticles in ZnO Disk Copyright © 2011 SciRes. MSA 1306 [8] C. S. Barret, T. B. Massalski, “Structure of Metals,” Per- gamon Press, Oxford, 1980. [9] Joint Committee on Powder Diffraction Standards, Pow- der Diffraction File, Card No: 891397. [10] H. Schulz and K. H. Thiemann, “Structure Parameters and Polarity of the Wurtzite Type Compounds Sic–2H and ZnO,” Solid State Communications, Vol. 32, No. 9, December 1997, pp. 783-785. [11] S. Aksoy, Y. Caglar, S. Ilican and M. Caglar, “Effect of Deposition Temperature on the Crystalline Structure and Surface Morphology of ZnO Films Deposited on p–Si,” Advances in Control, Chemical Engineering, Civil Engi- neering and Mechanical Engineering, ISBN: 978–960–474–251–6, pp. 227-231. [12] H. Adachi, M. Tsukada and C. Satoko, “Discrete Varia- tional Xα Cluster Calculations. I. Application to Metal Clusters,” Journal of the Physics Society of Japan, Vol. 45, April 1978, pp. 875-883. [13] C. Kittel, “Introduction to Solid State Physics,” 8th Edi- tion, John Wiley & Sons, New York, 2005. [14] R. Chowdhury, P. Rees, S. Adhikari, F. Scarpa and S. P. Wilks, “Electronic Structures of Silicon Doped ZnO,” Physica B, Vol. 405, No. 8, April 2010, pp. 1980-1985. doi:10.1016/j.physb.2010.01.084 [15] S. Panpan, S. Xiyu, H. Qinying, L. Yadong and C. Wei, “First-Principles Calculation of the Electronic Band of ZnO Doped with C,” Journal of Semiconductors, Vol. 30, No. 5, May 2009, pp. 052001-1-052001-4. [16] E. H. Kisi and M. M. Elcombe, “u Parameters for the Wurtzite Structure of ZnS and ZnO Using Powder Neu- tron Diffraction,” Acta Crystallographica Section C— Crystal Structure Communications Vol. 45, No. 12, De- cember 1989, pp. 1867-1870. [17] J. L. Lyons, A. Janotti and C. G. Van de Walle, “Role of Si and Ge as Impurities in ZnO,” Physical Review B, Vol. 80, No. 20, November 2009, pp. 205113-2051117. doi:10.1103/PhysRevB.80.205113 [18] C. S. Barret and T. B. Massalski, “Structure of Metals,” Pergamon Press, Oxford, 1980. [19] S. Ilican, M. Caglar and Y. Caglar, “Determination of the Thickness and Optical Constants of Transparent Indium- Doped ZnO Thin Films by the Envelope Method,” Mate- rials Science—Poland, Vol. 25, No. 3, April 2007, pp. 709-718. [20] O. Altuntasoglu, Y. Matsuda, S. Ida and Y. Matsumoto, “Syntheses of Zinc Oxide and Zinc Hydroxide Single Nanosheets,” Chemistry of Materials, Vol. 22, No.10, April 2010, pp. 3158-3164. doi:10.1021/cm100152q [21] X. Qu, W. Wang, S. Lv and D. Jia, “Thermoelectric Properties and Electronic Structure of Al-Doped ZnO,” Solid State Communications, Vol. 151, No. 4, February 2011, pp. 332-336. doi:10.1016/j.ssc.2010.11.020
|