 American Journal of Computational Mathematics, 2011, 1, 189-201 doi:10.4236/ajcm.2011.13022 Published Online September 2011 (http://www.SciRP.org/journal/ajcm) Copyright © 2011 SciRes. AJCM Simulation of Human Phonation with Vocal Nodules Shinji Deguchi1,2,*, Yuki Kawahara3 1Department of Biomedical Engineering, Tohoku University, Sendai, Japan 2Department of Bioengineering and Robotics, Tohoku University, Sendai, Japan 3Graduate School of Natural Science and Technology, Okayama University, Sendai, Japan E-mail: *deguchi@bml.mech.tohoku.ac.jp Received June 16, 2011; revised July 20, 2011; accepted August 2, 2011 Abstract The geometric and biomechanical properties of the larynx strongly influence voice quality and efficiency. A physical understanding of phonation natures in pathological conditions is important for predictions of how voice disorders can be treated using therapy and rehabilitation. Here, we present a continuum-based numeri- cal model of phonation that considers complex fluid-structure interactions occurring in the airway. This model considers a three-dimensional geometry of vocal folds, muscle contractions, and viscoelastic proper- ties to provide a realistic framework of phonation. The vocal fold motion is coupled to an unsteady com- pressible respiratory flow, allowing numerical simulations of normal and diseased phonations to derive clear relationships between actual laryngeal structures and model parameters such as muscle activity. As a pilot analysis of diseased phonation, we model vocal nodules, the mass lesions that can appear bilaterally on both sides of the vocal folds. Comparison of simulations with and without the nodules demonstrates how the le- sions affect vocal fold motion, consequently restricting voice quality. Furthermore, we found that the mini- mum lung pressure required for voice production increases as nodules move closer to the center of the vocal fold. Thus, simulations using the developed model may provide essential insight into complex phonation phenomena and further elucidate the etiologic mechanisms of voice disorders. Keywords: Aerodynamics, Flow-Structure Interaction, Self-Excited Oscillation, Phonation, Vocal Fold, Larynx, Vocal Tract, Speech Production, Voice Production, Vocal Nodules, Vocal Cord Polyp, Voice Disorder 1. Introduction Human phonation consists of the following mechanical processes: 1) induction of self-excited vocal fold oscilla- tions by respiratory airflow through flow-structure inter- action, 2) acoustic resonance of sounds generated by the oscillations in the airway, i.e., the passage from the lungs to the mouth and nose, and 3) emission of the sounds to the surrounding atmosphere as voice. Mathematical modeling and computer simulation of phonation, thus a complicated mechanical phenomenon, may be useful for future clinical diagnosis and therapy of diseased or in- jured vocal folds. Various numerical models have been reported for phonation simulation. One of the earliest was provided by Ishizaka and Flanagan [1], in which the vocal folds were approximated by two connected masses supported by nonlinear springs and dampers. In addition to flow- induced self-excitation of the vocal folds as a source of voice sound, their model considered virtually all me- chanical phenomena occurring during phonation, includ- ing sound resonance in the vocal tract (i.e., the pharynx and the oral and nasal cavities) and sound emission into the atmosphere. However, structural and histological details for the vocal folds were not incorporated in their lumped two-mass model. To identify the etiology of voice disorders based on such simulations, vocal fold models are required to capture relevant anatomical and func- tional characteristics [2]. Story and Titze [3] proposed an alternative vocal fold model consisting of three masses, i.e., a deep mass representing the body of the vocal fold (modeling the thyroarytenoid (TA) muscle and the deep layer of the lamina propria) and the other two masses representing the cover of the vocal fold (modeling the epithelium as well as the superficial and intermediate layers of the lamina propria). Two-dimensional vocal fold  190 S. DEGUCHI ET AL. shapes were considered in the model, and vocal fold movement in the anterior-posterior plane was ignored. Many other two-dimensional models have been reported for use in phonation analysis [4-8]; however, these may be inadequate to deal with voice disorders caused by mass lesions localized in the anterior-posterior plane such as vocal nodules and polyps [9,10]. Some vocal fold models considering a three-dimensional structure have also been developed with analysis of fluid-induced self- excited oscillation [11-14]. However, previous studies typically used a quasi-steady Bernoulli flow model, whose application is limited at high voice fundamental frequencies [15,16]. To our knowledge, Wong et al. [11] is the only nu- merical analysis that investigated the effect of an addi- tional diseased mass localized in the anterior-posterior plane of the vocal folds. They investigated some patho- logical cases using a lumped-element model while chang- ing the value of a local mass placed on the edge of the vocal fold. However, they did not examine possible changes in phonation threshold conditions and the fun- damental frequency due to the additional mass. Thus, despite extensive research on phonation simulation, the dynamics of pathological vocal fold oscillation with mass lesions are still poorly understood. In the present study, we build a phonation model that treats the vocal folds as three-dimensional shapes. The model is an extension of a previously reported approach [4,6], in which the airway from the lungs to the mouth was considered together with vocal folds and approxi- mated as a flexible channel coupled to an unsteady, compressible, and viscous flow allowing flow-structure interaction. Here, we expand upon the previous work by incorporating the mechanical properties reported of each of the three main layers that constitute the vocal folds, i.e., the mucosa, ligament, and muscle [2,3,17-21] for deriving motion equations. Additionally, phonation simu- lation is performed with or without bilateral masses added to the edge of the vocal folds, mimicking the vocal nodules. These results show that the additional mass- induced reductions in the voice fundamental frequency and phonation threshold pressure are largest when the masses are at the center of the vocal folds in the ante- rior-posterior plane. The present pilot study may provide a basis for future simulation-based diagnosis of voice disorders. 2. Methods 2.1. Lungs, Trachea, and Vocal Tract Numerical analyses were performed based on a model that includes the airway from the lungs to the mouth (Figure 1). All modeled parts except for the vocal folds are the same as those used in our former studies [4,6]. Extensive modifications were made to the vocal folds as described in Section 2.2. The flow in the airway, de- scribed in detail in Section 2.3, was approximated to be one-dimensional. The X-axis corresponds to the main- stream direction. The lungs were represented by a pres- surized tank. The bronchi and trachea were approximated by a rigid pipe of a longitudinal length of 0.23 m with a uniform cross-sectional area of 2.45 × 10⁻⁴ m2, a typical size for human adults. The vocal tract composed of the pharynx and oral cavity were represented by a rigid tube with a longitudinal length of 0.16 m, the cross-sectional area of which varies along the flow direction to satisfy the resonance characteristics of the vowel /a:/ [22] (Fig- ure 2). 2.2. Vocal Fold Model The vocal folds were approximated as a viscoelastic me- mbrane (Figure 3). The X-, Y-, and Z-axes indicate the directions of the thickness (equal to the flow direction; 0 ≤ X ≤ 10.4 mm for the vocal folds), length (0 ≤ Y ≤ lg where lg is the vocal fold length and is as 14 mm), and depth of the vocal folds (Z), respectively. Elements in the vocal folds were assumed to displace in the Z-axis per- pendicular to the flow direction. Each individual fold was assumed to deform symmetrical to the medial axis (Z = 0). The three-dimensional prephonatory shape B0 is described by Figure 1. Schematic of the airway model. A frontal section is shown for the larynx, while sagittal sections are shown for other flow paths. Copyright © 2011 SciRes. AJCM  S. DEGUCHI ET AL. 191 Figure 2. Cross-sectional area distribution of the vocal tract for the vowel /a:/. The horizontal axis is the distance from the upstream end of the vocal tract to the end of the larynx or false vocal folds (see Figure 3). o 3 03 o 2 2 o 210.4tan 49 10.4 3210.4tan49 10.4 tan49mm, en ex en ex en BB BX BB XB (1) 1 ex vpg BB Yl , (2) where Ben (fixed to be 8.2 mm) and Bex are the half-glot- tal widths at the entrance (X = 0 mm) and exit (X = 10.4 mm), respectively, and Bvp is the half-glottal width at the tip of the vocal process of the arytenoid cartilages (X = 10.4 mm; Y = 0 mm) (Figure 3). Even when Bvp is 0 mm, it is assumed that the glottis has a small rear gap (poste- rior glottis) between the separate arytenoid cartilages that do not vibrate during phonation. The prephonatory shape within the X-Z plane is described in detail in previous studies [6]. Following the body-cover theory [17,19], the vocal folds are assumed to consist of three layers, the mucosa, ligament, and TA muscle. The mucosa, representing the epithelium and superficial layer of the lamina propria, covers the vocal folds. The vocal ligament, underlying the mucosa and overlying the muscle, consists of inter- mediate and deep layers of the lamina propria. It has an anterior-posterior orientation between the anterior com- missure (Y = lg) and vocal processes (Y = 0 cm). The TA muscle is juxtaposed to the ligament. It is assumed that no relative displacement occurs between the interfaces of each layer. The equation of motion is derived consider- ing the force balance for an infinitesimal element in the vocal fold (Figure 3) given as 2 2 sin sin , yy xx vcol T T B hFP XY T (3) 2 sin1 , x BB XX (4) (a) (b) Figure 3. Schematic of the larynx model. (a) Initial geome- try of vocal fold model in the coronal (X-Z) plane. (b) Upper view (Y-Z plane) of the vocal folds. Open triangles represent the tips of the vocal process of arytenoid muscle and ante- rior commissure where no displacement is permitted during oscillation. Asterisks represent the plane shown in (a). 2 sin1 , y BB YY (5) where v is the mass per unit volume, h is the vocal fold depth effective for vibration, B is the half-glottal width, T is the time, Fcol is the collision force per unit area, P is the static air pressure, Tx and Ty are tensions in the vocal folds in the X- and Y-directions, respectively, and and are deformed angles of infinitesimal Copyright © 2011 SciRes. AJCM  192 S. DEGUCHI ET AL. elements in the X- and Y- directions, respectively (Figure 3). Because limited data is available regarding the shear properties of each layer, for simplicity, tensional com- ponents of each layer are considered to calculate the re- storing forces. The first term of the left side of Equation (3) represents the inertial force. The collision force of the second term occurs only when one of the vocal fold pair collides with the facing vocal fold pair at Z = 0 (median line) and is described by , B0, col B FKBC T (6) where K and C are the spring constant and the damping coefficient, respectively [1,4,6]. The first term of the right side of Equation (3) represents air pressure as determined from the flow equations described in Section 2.3 at each time step to allow fluid-structure interactions. The sec- ond and third terms on the right side of Equation (3) rep- resent the viscoelastic restoring force contributed by the line tension in the X-direction Tx and the line tension in the Y-direction T y, respectively. The tension in the X-direction is described by ˆ ˆ xxxx TEh h T (7) 0 ˆ10 xx x (8) 2 2 0 11 x B B XX 1 (9) where Ex is the Young’s modulus of the vocal folds in the X-direction, ˆ is strain in the X-direction, is the damping coefficient in the X-direction, and 0 is the prestrain in the X-direction. Before we explain the contents of Ty, which is the ten- sion in the tissue fiber direction, we briefly review the structure-based function of the vocal folds. In vivo, the vocal folds change their length (in the anterior-posterior direction or Y-direction), thickness (X-direction), and effective depth (Z-direction) with the activation of la- ryngeal muscles [19,20]. The major muscles associated with voice pitch regulation are the cricothyroid (CT) and the TA muscles. The CT muscle runs between the thy- roid and cricoid cartilages, and its activation stretches the vocal folds, increasing tension. The TA muscle runs in juxtaposition of the vocal ligament and constitutes the vocal fold itself. Consequently, its contraction pulls the thyroid cartilage inward to reduce the length of the vocal folds. In prephonatory conditions, the TA muscle under- goes isometric contraction in which the vocal fold length is unchanged under a force balance in laryngeal muscles, while the TA muscle contraction contributes to a rise in the tension. To consider the structure and function, the contribution of stress in the TA muscle to Ty is described by the sum of active and passive stress components, given as ˆˆ , muscle ypassive yactive y ˆ (10) where the stresses are a function of strain in the Y direc- tion ˆ that is described by 2 022 1d ˆ1 yy gvp By Y lB 1 , (11) where 0 is the prestrain in the Y-direction associated with the activation of the CT muscle. We use a reported relationship between the stress and strain for the passive and active components defined as [23]: 1ˆ 1 ˆ 0, 0 ˆ, ˆ 1, 0 y y b passive y y ae (12) 2 2ˆ0.4 1 ˆ 0, 0.4 ˆ ˆˆ 0.4, 0.4, y y active yc TA yy ac e (13) where a1 = 1.5 × 10⁴ dyn/cm2, b1 = 8.0, c1 = 4 1000.6 10e dyn/cm2, and c2 = 2 120.6 . These coefficients are determined from the literature [23]. The parameter aTA represents the extent of TA muscle activity that ranges from 0 (inactive) to 1 (full isometric contraction), following previous studies [13,19-21,23]. The effect of aTA is shown in Figure 4 in which the stress-strain curves of the TA muscle used in the present analysis are plotted. The cover and the ligament are as- sumed to bear passive stresses of the following forms: Figure 4. Stress-strain relationship of the thyroarytenoid muscle as a function of muscle activity aTA. Inset represents the sum of passive (Equation (12)) and active (Equation (13)) stress components described in Equation (10). Copyright © 2011 SciRes. AJCM 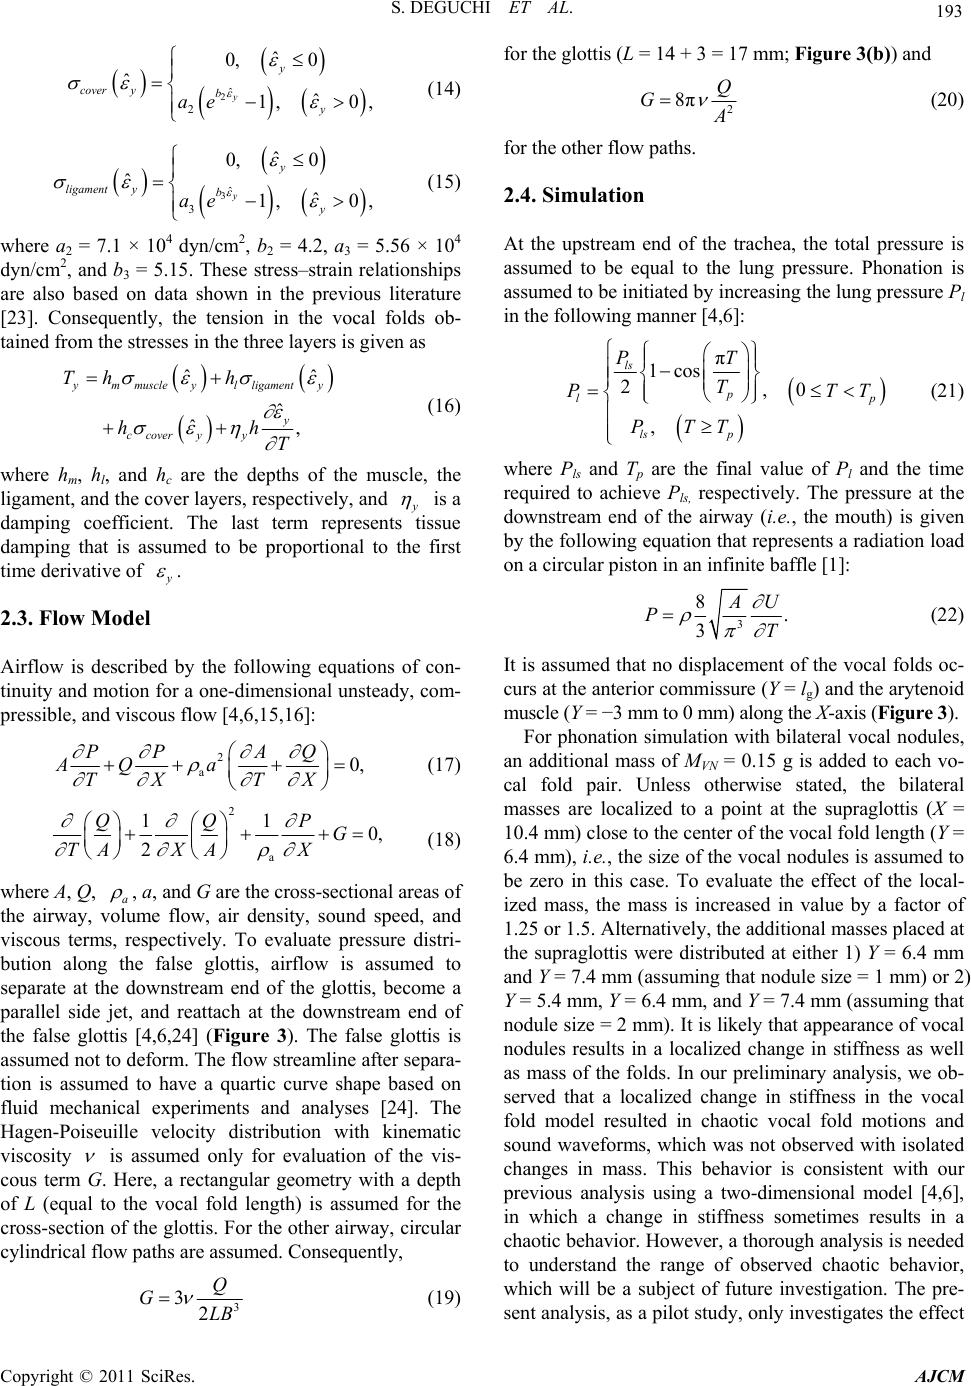 S. DEGUCHI ET AL. 193 2ˆ 2 ˆ 0, 0 ˆ ˆ 1, 0, y y cover yb y ae (14) 3ˆ 3 ˆ 0, 0 ˆ ˆ 1, 0, y y ligament yb y ae (15) where a2 = 7.1 × 10⁴ dyn/cm2, b2 = 4.2, a3 = 5.56 × 10⁴ dyn/cm2, and b3 = 5.15. These stress–strain relationships are also based on data shown in the previous literature [23]. Consequently, the tension in the vocal folds ob- tained from the stresses in the three layers is given as ˆˆ ˆ ˆ , m muscleylligamenty y c coveryy Th h hh T (16) where hm, hl, and hc are the depths of the muscle, the ligament, and the cover layers, respectively, and is a damping coefficient. The last term represents tissue damping that is assumed to be proportional to the first time derivative of . 2.3. Flow Model Airflow is described by the following equations of con- tinuity and motion for a one-dimensional unsteady, com- pressible, and viscous flow [4,6,15,16]: 2 a0, PP AQ AQ a TX TX (17) 2 a 11 0, 2 QQP G TA XAX (18) where A, Q, a , a, and G are the cross-sectional areas of the airway, volume flow, air density, sound speed, and viscous terms, respectively. To evaluate pressure distri- bution along the false glottis, airflow is assumed to separate at the downstream end of the glottis, become a parallel side jet, and reattach at the downstream end of the false glottis [4,6,24] (Figure 3). The false glottis is assumed not to deform. The flow streamline after separa- tion is assumed to have a quartic curve shape based on fluid mechanical experiments and analyses [24]. The Hagen-Poiseuille velocity distribution with kinematic viscosity is assumed only for evaluation of the vis- cous term G. Here, a rectangular geometry with a depth of L (equal to the vocal fold length) is assumed for the cross-section of the glottis. For the other airway, circular cylindrical flow paths are assumed. Consequently, 3 32 Q GLB (19) for the glottis (L = 14 + 3 = 17 mm; Figure 3(b)) and 2 8πQ G (20) for the other flow paths. 2.4. Simulation At the upstream end of the trachea, the total pressure is assumed to be equal to the lung pressure. Phonation is assumed to be initiated by increasing the lung pressure Pl in the following manner [4,6]: π 1cos 2, 0 , ls p lp ls p PT T PT PTT T (21) where Pls and Tp are the final value of Pl and the time required to achieve Pls, respectively. The pressure at the downstream end of the airway (i.e., the mouth) is given by the following equation that represents a radiation load on a circular piston in an infinite baffle [1]: 3 8. 3 U PT (22) It is assumed that no displacement of the vocal folds oc- curs at the anterior commissure (Y = lg) and the arytenoid muscle (Y = −3 mm to 0 mm) along the X-axis (Figure 3). For phonation simulation with bilateral vocal nodules, an additional mass of MVN = 0.15 g is added to each vo- cal fold pair. Unless otherwise stated, the bilateral masses are localized to a point at the supraglottis (X = 10.4 mm) close to the center of the vocal fold length (Y = 6.4 mm), i.e., the size of the vocal nodules is assumed to be zero in this case. To evaluate the effect of the local- ized mass, the mass is increased in value by a factor of 1.25 or 1.5. Alternatively, the additional masses placed at the supraglottis were distributed at either 1) Y = 6.4 mm and Y = 7.4 mm (assuming that nodule size = 1 mm) or 2) Y = 5.4 mm, Y = 6.4 mm, and Y = 7.4 mm (assuming that nodule size = 2 mm). It is likely that appearance of vocal nodules results in a localized change in stiffness as well as mass of the folds. In our preliminary analysis, we ob- served that a localized change in stiffness in the vocal fold model resulted in chaotic vocal fold motions and sound waveforms, which was not observed with isolated changes in mass. This behavior is consistent with our previous analysis using a two-dimensional model [4,6], in which a change in stiffness sometimes results in a chaotic behavior. However, a thorough analysis is needed to understand the range of observed chaotic behavior, which will be a subject of future investigation. The pre- sent analysis, as a pilot study, only investigates the effect Copyright © 2011 SciRes. AJCM 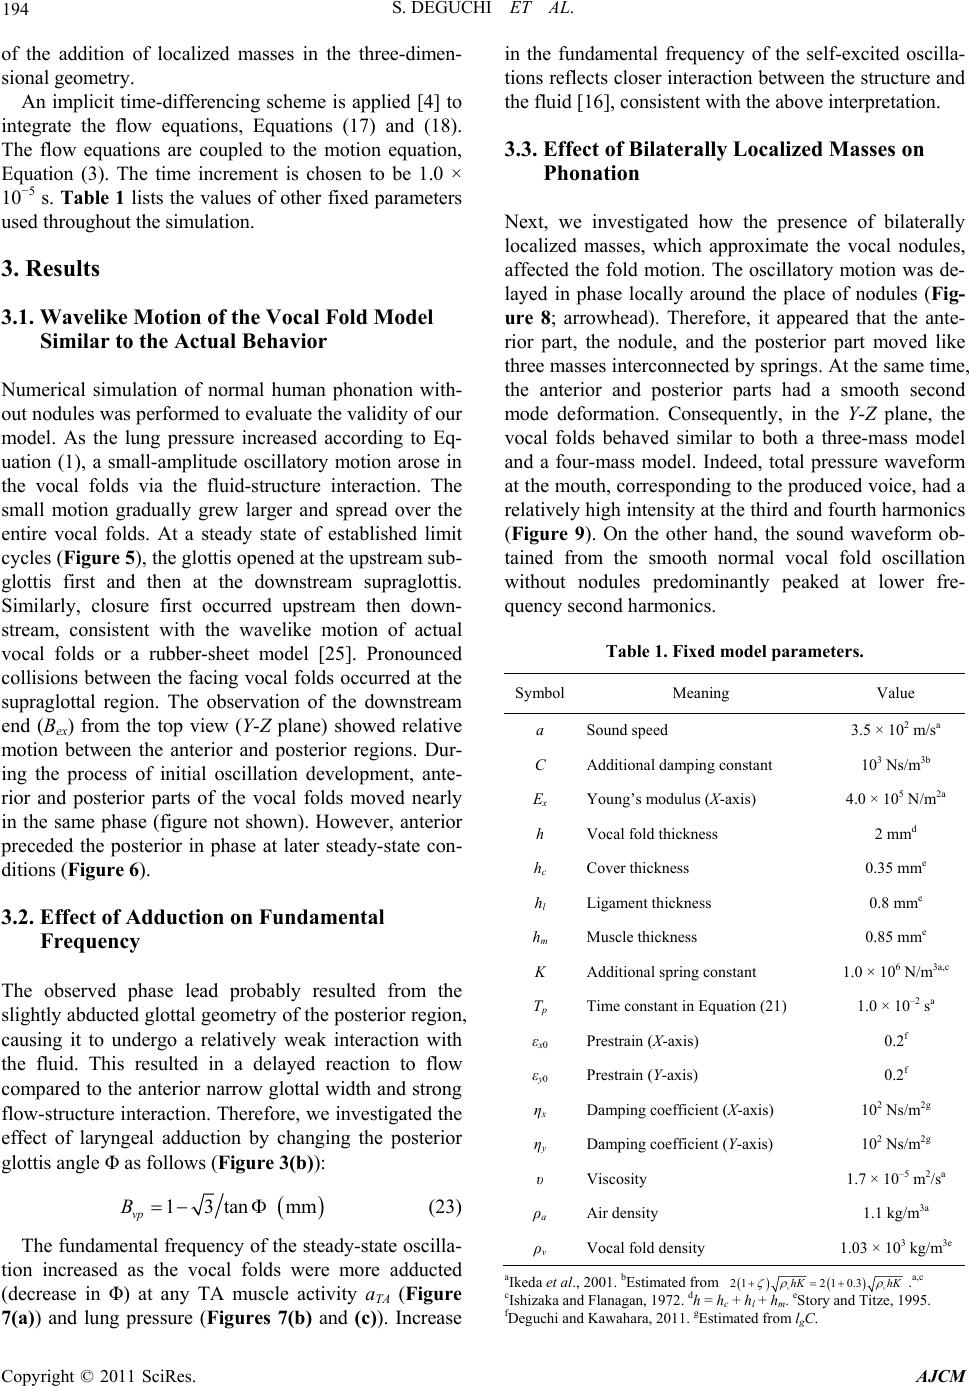 194 S. DEGUCHI ET AL. of the addition of localized masses in the three-dimen- sional geometry. An implicit time-differencing scheme is applied [4] to integrate the flow equations, Equations (17) and (18). The flow equations are coupled to the motion equation, Equation (3). The time increment is chosen to be 1.0 × 10⁻⁵ s. Table 1 lists the values of other fixed parameters used throughout the simulation. 3. Results 3.1. Wavelike Motion of the Vocal Fold Model Similar to the Actual Behavior Numerical simulation of normal human phonation with- out nodules was performed to evaluate the validity of our model. As the lung pressure increased according to Eq- uation (1), a small-amplitude oscillatory motion arose in the vocal folds via the fluid-structure interaction. The small motion gradually grew larger and spread over the entire vocal folds. At a steady state of established limit cycles (Figure 5), the glottis opened at the upstream sub- glottis first and then at the downstream supraglottis. Similarly, closure first occurred upstream then down- stream, consistent with the wavelike motion of actual vocal folds or a rubber-sheet model [25]. Pronounced collisions between the facing vocal folds occurred at the supraglottal region. The observation of the downstream end (Bex) from the top view (Y-Z plane) showed relative motion between the anterior and posterior regions. Dur- ing the process of initial oscillation development, ante- rior and posterior parts of the vocal folds moved nearly in the same phase (figure not shown). However, anterior preceded the posterior in phase at later steady-state con- ditions (Figure 6). 3.2. Effect of Adduction on Fundamental Frequency The observed phase lead probably resulted from the slightly abducted glottal geometry of the posterior region, causing it to undergo a relatively weak interaction with the fluid. This resulted in a delayed reaction to flow compared to the anterior narrow glottal width and strong flow-structure interaction. Therefore, we investigated the effect of laryngeal adduction by changing the posterior glottis angle Φ as follows (Figure 3(b)): 13tan mm vp B (23) The fundamental frequency of the steady-state oscilla- tion increased as the vocal folds were more adducted (decrease in Φ) at any TA muscle activity aTA (Figure 7(a)) and lung pressure (Figures 7(b) and (c)). Increase in the fundamental frequency of the self-excited oscilla- tions reflects closer interaction between the structure and the fluid [16], consistent with the above interpretation. 3.3. Effect of Bilaterally Localized Masses on Phonation Next, we investigated how the presence of bilaterally localized masses, which approximate the vocal nodules, affected the fold motion. The oscillatory motion was de- layed in phase locally around the place of nodules (Fig- ure 8; arrowhead). Therefore, it appeared that the ante- rior part, the nodule, and the posterior part moved like three masses interconnected by springs. At the same time, the anterior and posterior parts had a smooth second mode deformation. Consequently, in the Y-Z plane, the vocal folds behaved similar to both a three-mass model and a four-mass model. Indeed, total pressure waveform at the mouth, corresponding to the produced voice, had a relatively high intensity at the third and fourth harmonics (Figure 9). On the other hand, the sound waveform ob- tained from the smooth normal vocal fold oscillation without nodules predominantly peaked at lower fre- quency second harmonics. Table 1. Fixed model parameters. SymbolMeaning Value a Sound speed 3.5 × 10² m/sa C Additional damping constant 103 Ns/m3b Ex Young’s modulus (X-axis) 4.0 × 10⁵ N/m2a h Vocal fold thickness 2 mmd hc Cover thickness 0.35 mme hl Ligament thickness 0.8 mme hm Muscle thickness 0.85 mme K Additional spring constant 1.0 × 10⁶ N/m3a,c Tp Time constant in Equation (21) 1.0 × 10⁻² sa εx0 Prestrain (X-axis) 0.2f εy0 Prestrain (Y-axis) 0.2f ηx Damping coefficient (X-axis) 102 Ns/m2g ηy Damping coefficient (Y-axis) 102 Ns/m2g υ Viscosity 1.7 × 10⁻⁵ m2/sa ρa Air density 1.1 kg/m3a ρv Vocal fold density 1.03 × 10³ kg/m3e aIkeda et al., 2001. bEstimated from 2121 0.3hK hK vv cIshizaka and Flanagan, 1972. dh = hc + hl + hm. eStory and Titze, 1995. .a,c fDeguchi and Kawahara, 2011. gEstimated from lgC. Copyright © 2011 SciRes. AJCM 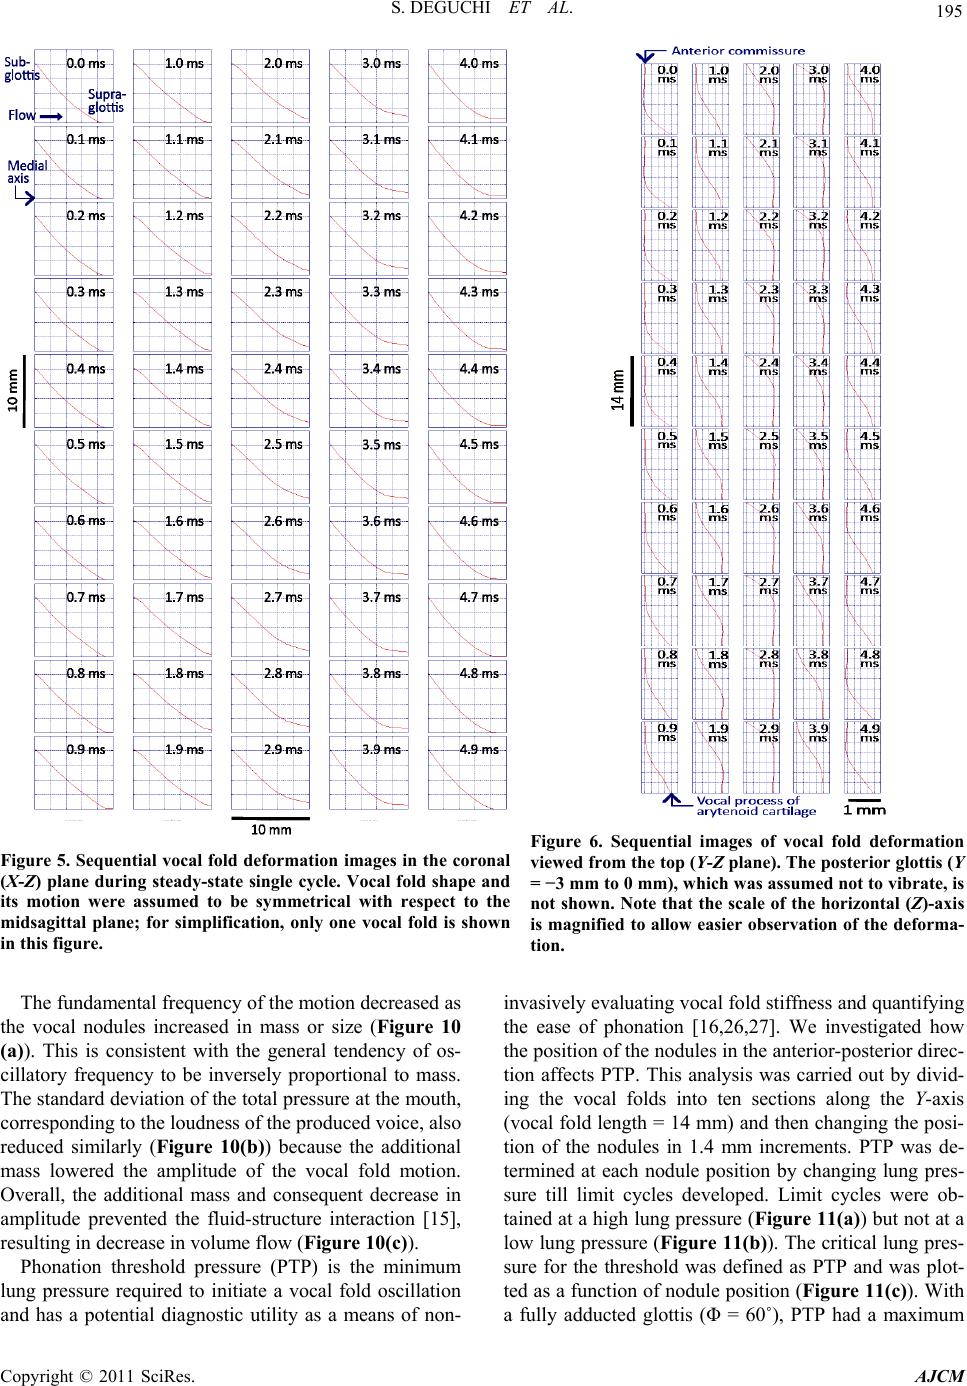 S. DEGUCHI ET AL. Copyright © 2011 SciRes. AJCM 195 Figure 6. Sequential images of vocal fold deformation viewed from the top (Y-Z plane). The posterior glottis (Y = −3 mm to 0 mm), which was assumed not to vibrate, is not shown. Note that the scale of the horizontal (Z)-axis is magnified to allow easier observation of the deforma- tion. Figure 5. Sequential vocal fold deformation images in the coronal (X-Z) plane during steady-state single cycle. Vocal fold shape and its motion were assumed to be symmetrical with respect to the midsagittal plane; for simplification, only one vocal fold is shown in this figure. The fundamental frequency of the motion decreased as the vocal nodules increased in mass or size (Figure 10 (a)). This is consistent with the general tendency of os- cillatory frequency to be inversely proportional to mass. The standard deviation of the total pressure at the mouth, corresponding to the loudness of the produced voice, also reduced similarly (Figure 10(b)) because the additional mass lowered the amplitude of the vocal fold motion. Overall, the additional mass and consequent decrease in amplitude prevented the fluid-structure interaction [15], resulting in decrease in volume flow (Figure 10(c)). Phonation threshold pressure (PTP) is the minimum lung pressure required to initiate a vocal fold oscillation and has a potential diagnostic utility as a means of non- invasively evaluating vocal fold stiffness and quantifying the ease of phonation [16,26,27]. We investigated how the position of the nodules in the anterior-posterior direc- tion affects PTP. This analysis was carried out by divid- ing the vocal folds into ten sections along the Y-axis (vocal fold length = 14 mm) and then changing the posi- tion of the nodules in 1.4 mm increments. PTP was de- termined at each nodule position by changing lung pres- sure till limit cycles developed. Limit cycles were ob- tained at a high lung pressure (Figure 11(a)) but not at a low lung pressure (Figure 11(b)). The critical lung pres- sure for the threshold was defined as PTP and was plot- ted as a function of nodule position (Figure 11(c)). With a fully adducted glottis (Φ = 60˚), PTP had a maximum 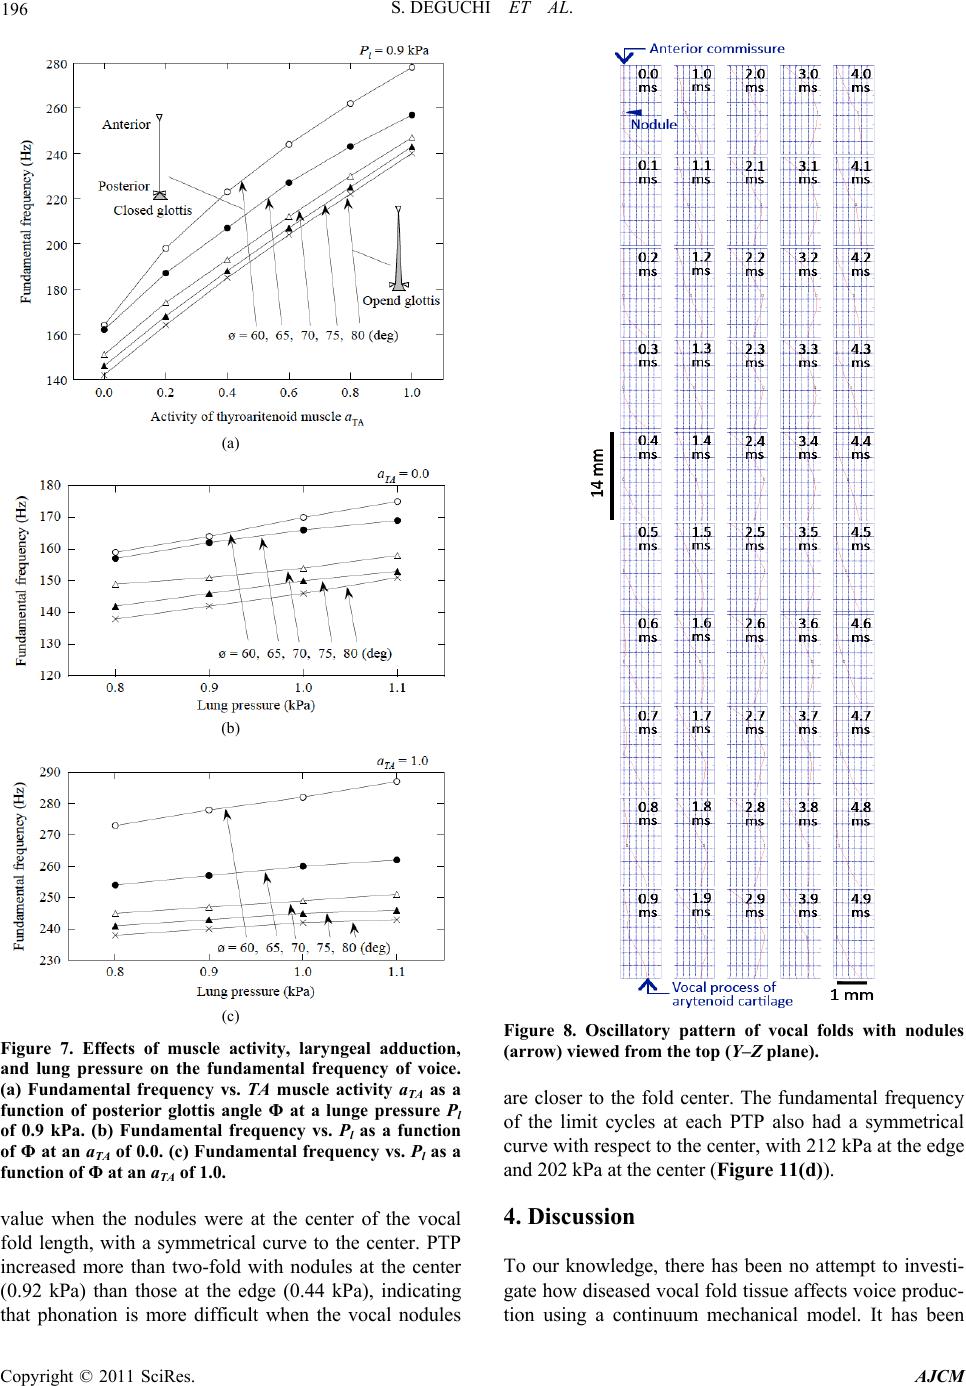 196 S. DEGUCHI ET AL. (a) (b) (c) Figure 7. Effects of muscle activity, laryngeal adduction, and lung pressure on the fundamental frequency of voice. (a) Fundamental frequency vs. TA muscle activity aTA as a function of posterior glottis angle Φ at a lunge pressure Pl of 0.9 kPa. (b) Fundamental frequency vs. Pl as a function of Φ at an aTA of 0.0. (c) Fundamental frequency vs. Pl as a function of Φ at an aTA of 1.0. value when the nodules were at the center of the vocal fold length, with a symmetrical curve to the center. PTP increased more than two-fold with nodules at the center (0.92 kPa) than those at the edge (0.44 kPa), indicating that phonation is more difficult when the vocal nodules Figure 8. Oscillatory pattern of vocal folds with nodules (arrow) viewed from the top (Y–Z plane). are closer to the fold center. The fundamental frequency of the limit cycles at each PTP also had a symmetrical curve with respect to the center, with 212 kPa at the edge and 202 kPa at the center (Figure 11(d)). 4. Discussion To our knowledge, there has been no attempt to investi- gate how diseased vocal fold tissue affects voice produc- tion using a continuum mechanical model. It has been Copyright © 2011 SciRes. AJCM 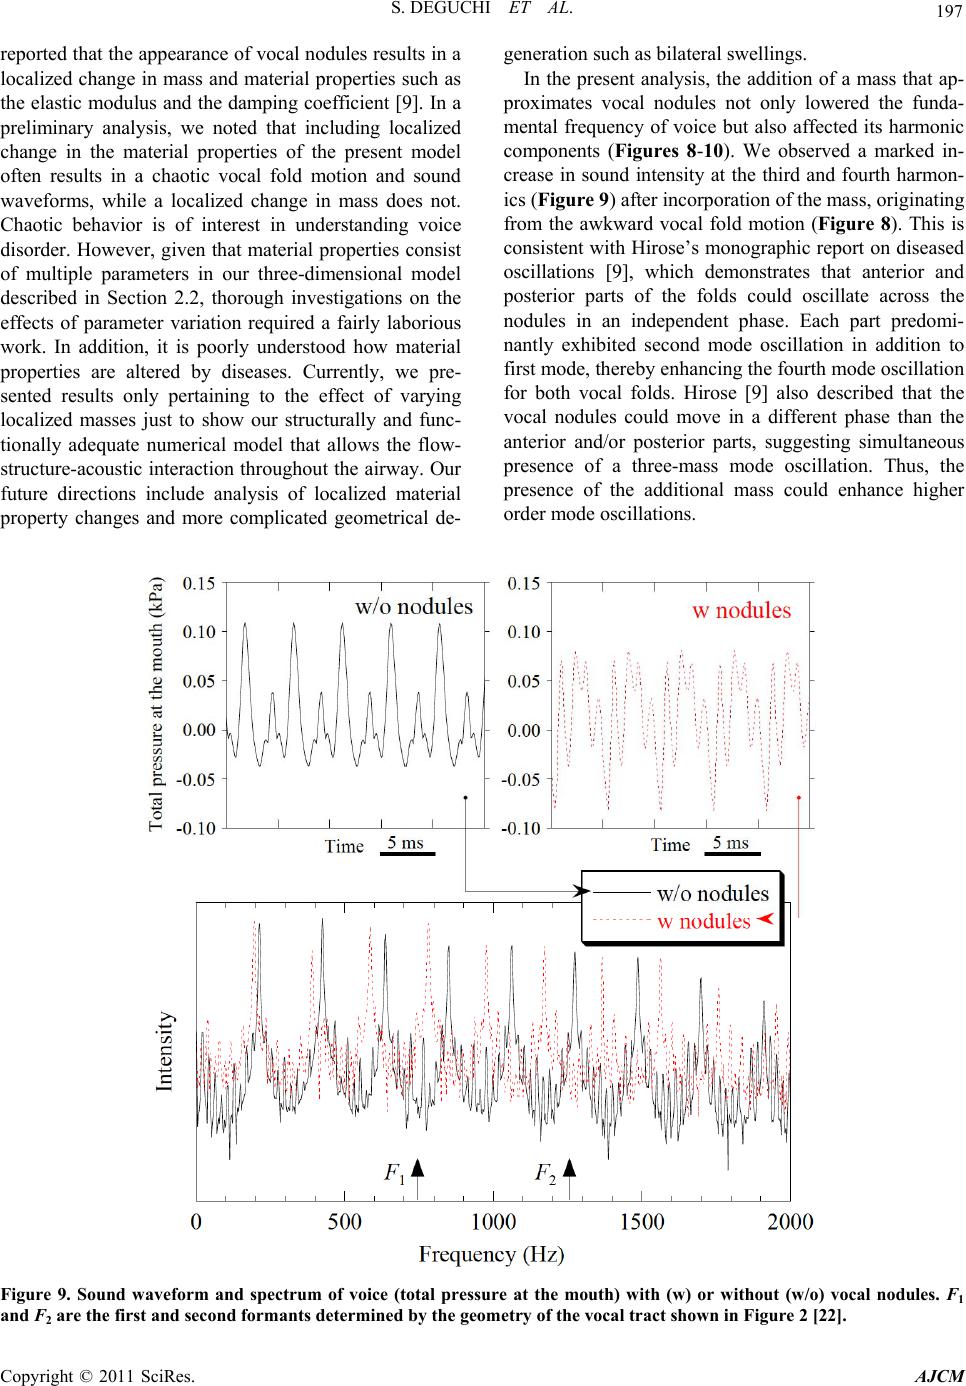 S. DEGUCHI ET AL. Copyright © 2011 SciRes. AJCM 197 reported that the appearance of vocal nodules results in a localized change in mass and material properties such as the elastic modulus and the damping coefficient [9]. In a preliminary analysis, we noted that including localized change in the material properties of the present model often results in a chaotic vocal fold motion and sound waveforms, while a localized change in mass does not. Chaotic behavior is of interest in understanding voice disorder. However, given that material properties consist of multiple parameters in our three-dimensional model described in Section 2.2, thorough investigations on the effects of parameter variation required a fairly laborious work. In addition, it is poorly understood how material properties are altered by diseases. Currently, we pre- sented results only pertaining to the effect of varying localized masses just to show our structurally and func- tionally adequate numerical model that allows the flow- structure-acoustic interaction throughout the airway. Our future directions include analysis of localized material property changes and more complicated geometrical de- generation such as bilateral swellings. In the present analysis, the addition of a mass that ap- proximates vocal nodules not only lowered the funda- mental frequency of voice but also affected its harmonic components (Figures 8-10). We observed a marked in- crease in sound intensity at the third and fourth harmon- ics (Figure 9) after incorporation of the mass, originating from the awkward vocal fold motion (Figure 8). This is consistent with Hirose’s monographic report on diseased oscillations [9], which demonstrates that anterior and posterior parts of the folds could oscillate across the nodules in an independent phase. Each part predomi- nantly exhibited second mode oscillation in addition to first mode, thereby enhancing the fourth mode oscillation for both vocal folds. Hirose [9] also described that the vocal nodules could move in a different phase than the anterior and/or posterior parts, suggesting simultaneous presence of a three-mass mode oscillation. Thus, the presence of the additional mass could enhance higher order mode oscillations. Figure 9. Sound waveform and spectrum of voice (total pressure at the mouth) with (w) or without (w/o) vocal nodules. F1 and F2 are the first and second formants determined by the geometry of the vocal tract shown in Figure 2 [22]. 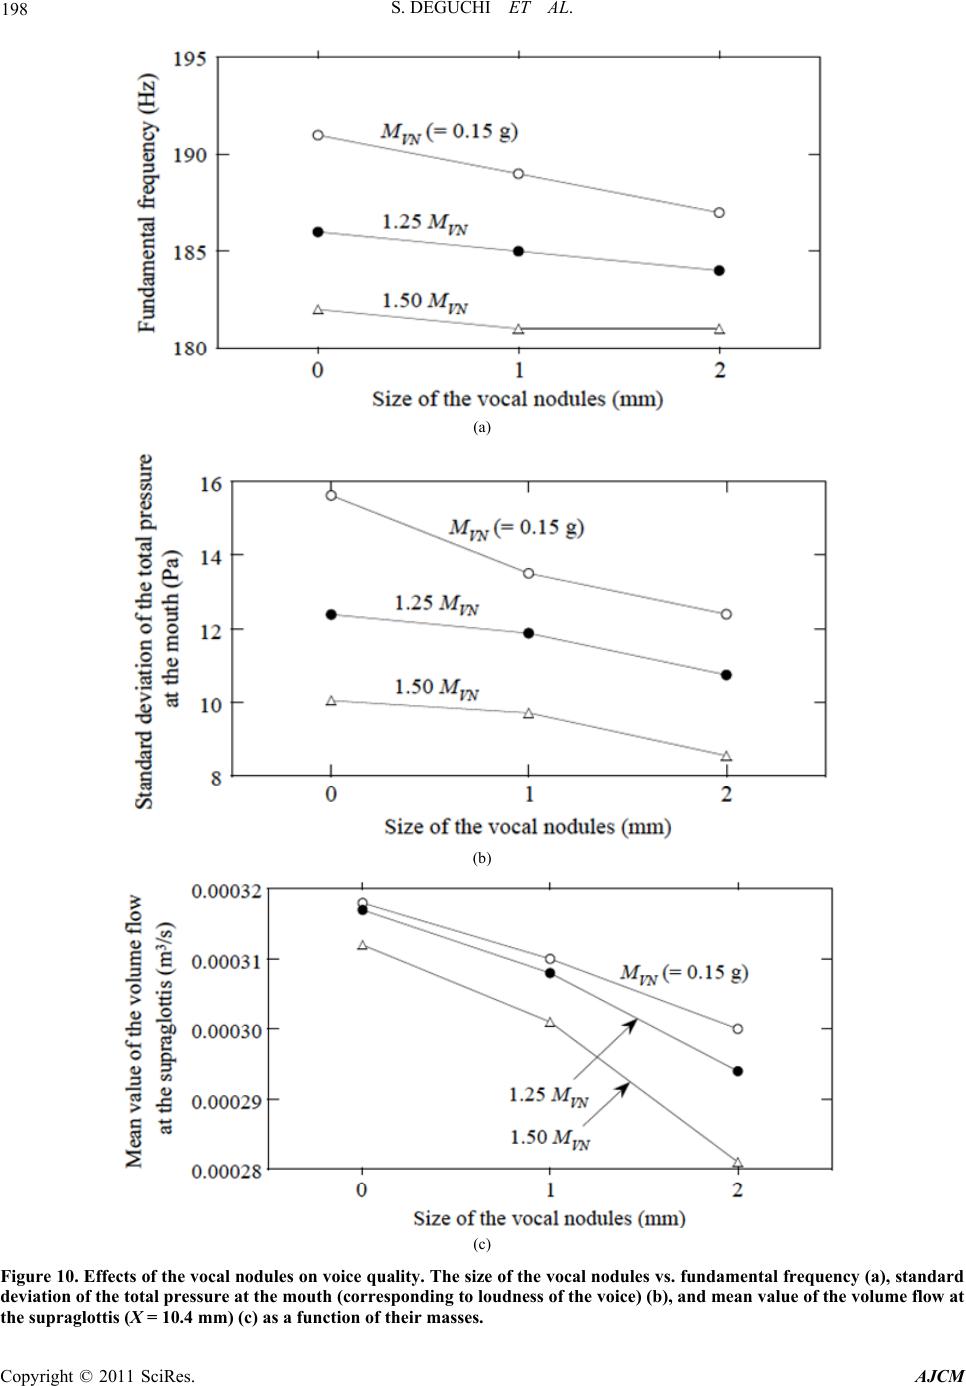 198 S. DEGUCHI ET AL. (a) (b) (c) Figure 10. Effects of the vocal nodules on voice quality. The size of the vocal nodules vs. fundamental frequency (a), standard deviation of the total pressure at the mouth (corresponding to loudness of the voice) (b), and mean value of the volume flow at the supraglottis (X = 10.4 mm) (c) as a function of their masses. Copyright © 2011 SciRes. AJCM 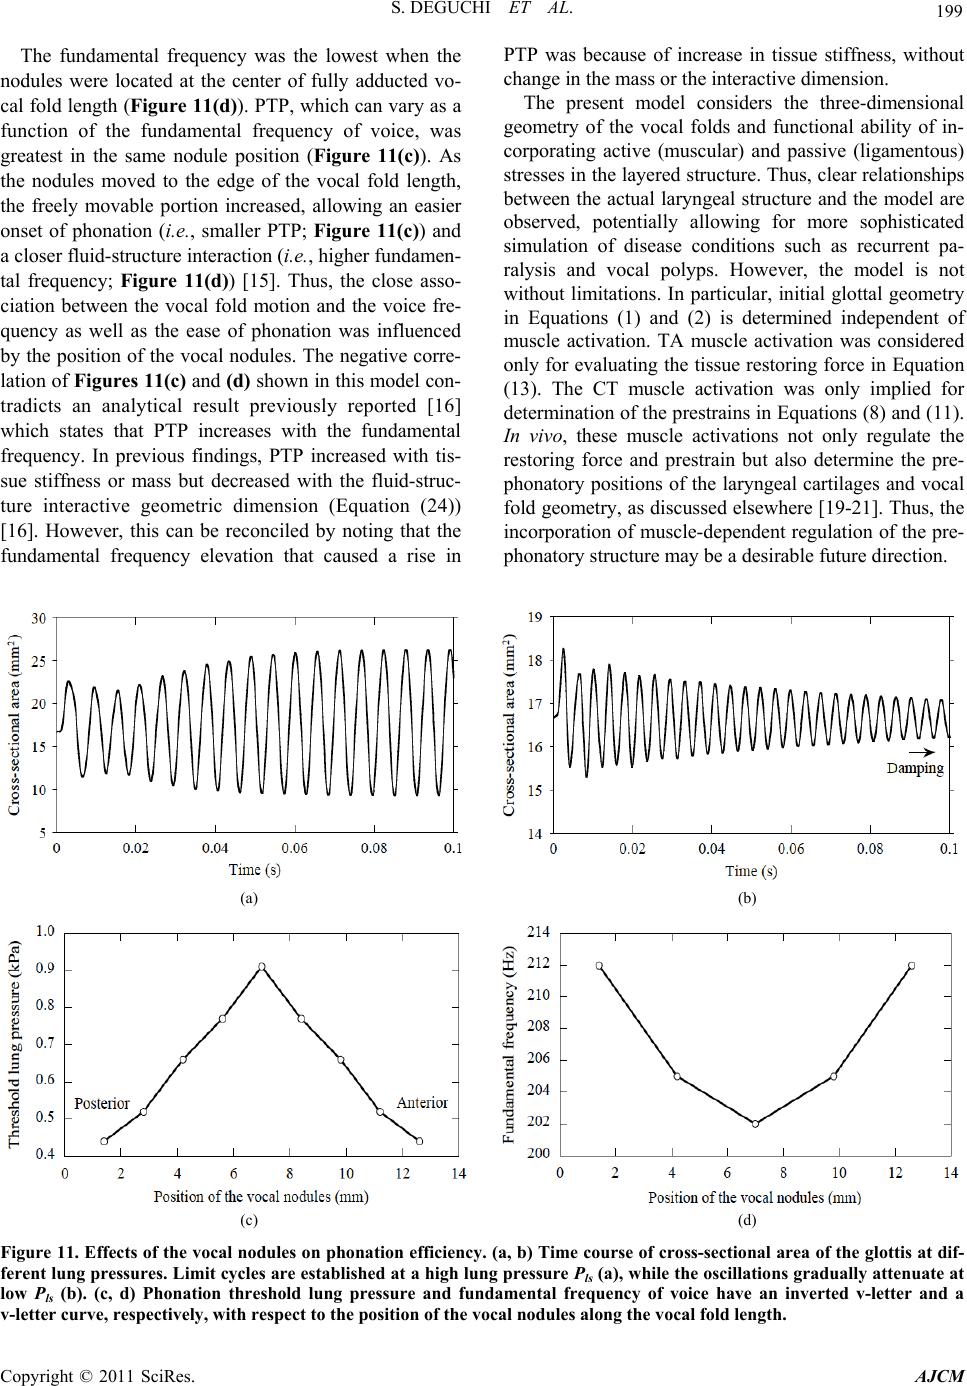 S. DEGUCHI ET AL. Copyright © 2011 SciRes. AJCM 199 PTP was because of increase in tissue stiffness, without change in the mass or the interactive dimension. The fundamental frequency was the lowest when the nodules were located at the center of fully adducted vo- cal fold length (Figure 11(d)). PTP, which can vary as a function of the fundamental frequency of voice, was greatest in the same nodule position (Figure 11(c)). As the nodules moved to the edge of the vocal fold length, the freely movable portion increased, allowing an easier onset of phonation (i.e. , smaller PTP; Figure 11(c)) and a closer fluid-structure interaction (i.e., higher fundamen- tal frequency; Figure 11(d)) [15]. Thus, the close asso- ciation between the vocal fold motion and the voice fre- quency as well as the ease of phonation was influenced by the position of the vocal nodules. The negative corre- lation of Figures 11(c) and (d) shown in this model con- tradicts an analytical result previously reported [16] which states that PTP increases with the fundamental frequency. In previous findings, PTP increased with tis- sue stiffness or mass but decreased with the fluid-struc- ture interactive geometric dimension (Equation (24)) [16]. However, this can be reconciled by noting that the fundamental frequency elevation that caused a rise in The present model considers the three-dimensional geometry of the vocal folds and functional ability of in- corporating active (muscular) and passive (ligamentous) stresses in the layered structure. Thus, clear relationships between the actual laryngeal structure and the model are observed, potentially allowing for more sophisticated simulation of disease conditions such as recurrent pa- ralysis and vocal polyps. However, the model is not without limitations. In particular, initial glottal geometry in Equations (1) and (2) is determined independent of muscle activation. TA muscle activation was considered only for evaluating the tissue restoring force in Equation (13). The CT muscle activation was only implied for determination of the prestrains in Equations (8) and (11). In vivo, these muscle activations not only regulate the restoring force and prestrain but also determine the pre- phonatory positions of the laryngeal cartilages and vocal fold geometry, as discussed elsewhere [19-21]. Thus, the incorporation of muscle-dependent regulation of the pre- phonatory structure may be a desirable future direction. (a) (b) (c) (d) Figure 11. Effects of the vocal nodules on phonation efficiency. (a, b) Time course of cross-sectional area of the glottis at dif- ferent lung pressures. Limit cycles are established at a high lung pressure Pls (a), while the oscillations gradually attenuate at low Pls (b). (c, d) Phonation threshold lung pressure and fundamental frequency of voice have an inverted v-letter and a v-letter curve, respectively, with respect to the position of the vocal nodules along the vocal fold length.  S. DEGUCHI ET AL. Copyright © 2011 SciRes. AJCM 200 In summary, we have developed a continuum-based numerical model for the simulation of human phonation with diseased vocal fold tissue. Here, we focused on the effect of varying localized bilateral masses to approxi- mate the vocal nodules. The result shows that the presence of the nodules lowers the voice fundamental frequency and intensity. Phonation efficiency is most strongly de- creased when the nodules are close to the center of the vocal fold length, where they prevent the fluid-structure interactions responsible for source sound production. These results suggest that phonation simulation using the newly developed model may be useful for indentifying the etiology of voice disorders. 5. Acknowledgements The authors thank Yuji Matsuzaki and Tadashige Ikeda for providing advice on study design and Seiichi Washio and Satoshi Takahashi for discussion. SD gratefully ac- knowledges the support from the Japan Science and Technology Agency. This work was supported in part by Grant-in-Aid from the Ministry of Education, Culture, Sports, Science, and Technology of Japan (#19700382 to SD). 6. References [1] K. Ishizaka and J. L. Flanagan, “Synthesis of Voiced Sounds from a Two-Mass Model of the Vocal Cords,” Bell System Technical Journal, Vol. 51, No. 6, 1972, pp. 1233-1268. [2] M. Hirano, “Morphological Structure of the Vocal Cord as a Vibrator and Its Variations,” Folia Phoniatrica et Logopaedica, Vol. 26, No. 2, 1974, pp. 89-94. doi:10.1159/000263771 [3] B. H. Story and I. R. Titze, “Voice Simulation with a Body-Cover Model of the Vocal Folds,” Journal of the Acoustical Society of America, Vol. 97, No. 2, 1995, pp. 1249-1260. doi:10.1121/1.412234 [4] T. Ikeda, Y. Matsuzaki and T. Aomatsu, “A Numerical Analysis of Phonation Using a Two-Dimensional Flexi- ble Channel Model of the Vocal Folds,” Journal of Bio- mechanical Engineering, Vol. 123, No. 6, 2001, pp. 571- 579. doi:10.1115/1.1408939 [5] C. Tao, J. J. Jiang and Y. Zhang, “Simulation of Vocal Fold Impact Pressures with a Self-Oscillating Finite-Ele- ment Model,” Journal of the Acoustical Society of Amer- ica, Vol. 119, No. 6, 2006, pp. 3987-3994. doi:10.1121/1.2197798 [6] S. Deguchi, Y. Matsuzaki and T. Ikeda, “Numerical Analy- sis of Effects of Transglottal Pressure Change on Funda- mental Frequency of Phonation,” Annals of Otology, Rhi- nology and Laryngology, Vol. 116, No. 2, 2007, pp. 128-134. [7] I. T. Tokuda, J. Horácek, J. G. Svec and H. Herzel, “Comparison of Biomechanical Modeling of Register Transitions and Voice Instabilities with Excised Larynx Experiments,” Journal of the Acoustical Society of Amer- ica, Vol. 122, No. 1, 2007, pp. 519-531. doi:10.1121/1.2741210 [8] X. Zheng, S. Bielamowicz, H. Luo and R. Mittal, “A Computational Study of the Effect of False Vocal Folds on Glottal Flow and Vocal Fold Vibration during Phona- tion,” Annals of Biomedical Engineering, Vol. 37, No. 3, 2009, pp. 625-642. doi:10.1007/s10439-008-9630-9 [9] H. Hirose, “Clinical Aspects of Voice Disorders,” In- teruna Publishers, Tokyo, 1998, p. 173. [10] L. Li, H. Saigusa, Y. Nakazawa, T. Nakamura, T. Ko- machi, S. Yamaguchi, A. Liu, Y. Sugisaki, E. Shinya and H. Shen, “A Pathological Study of Bamboo Nodule of the Vocal Fold,” Journal of Voice, Vol. 24, No. 6, 2010, pp. 738-741. doi:10.1016/j.jvoice.2009.06.003 [11] D. Wong, M. R. Ito and N. B. Cox, “Observation of Per- turbations in a Lumped-Element Model of the Vocal Folds with Application to Some Pathological Cases,” Journal of the Acoustical Society of America, Vol. 89, No. 1, 1991, pp. 383-394. doi:10.1121/1.400472 [12] F. Alipour, D. A. Berry and I. R. Titze, “A Finite Element Model of Vocal-Fold Vibration,” Journal of the Acousti- cal Society of America, Vol. 108, No. 6, 2000, pp. 3003-3012. doi:10.1121/1.1324678 [13] I. R. Titze and T. Riede, “A Cervid Vocal Fold Model Suggests Greater Glottal Efficiency in Calling at High Frequencies,” PLoS Computational Biology, Vol. 6, No. 3, 2010, e1000897. doi:10.1371/journal.pcbi.1000897 [14] A. Yang, J. Lohscheller, D. A. Berry, S. Becker, U. Ey- sholdt, D. Voigt and M. Döllinger, “Biomechanical Mod- eling of the Three-Dimensional Aspects of Human Vocal Fold Dynamics,” Journal of the Acoustical Society of America, Vol. 127, No. 2, 2010, pp. 1014-1031. doi:10.1121/1.3277165 [15] S. Deguchi and T. Hyakutake, “Theoretical Consideration of the Flow Behavior in Oscillating Vocal Fold,” Journal of Biomechanics, Vol. 42, No. 7, 2009, pp. 824-829. doi:10.1016/j.jbiomech.2009.01.027 [16] S. Deguchi, “Mechanism of and Threshold Biomechani- cal Conditions for Falsetto Voice Onset,” PLoS One, Vol. 6, No. 3, 2011, e17503. doi:10.1371/journal.pone.0017503 [17] O. Fujimura, “Body-Cover Theory of the Vocal Fold and Its Phonetic Implications,” In: K. Stevens and M. Hirano, Eds., Vocal Fold Physiology, University of Tokyo Press, Tokyo, 1981, pp. 271-288. [18] M. Hirano, K. Kiyokawa and S. Kurita, “Laryngeal Mus- cles and Glottic Shaping,” In: O. Fujimura, Ed., Vocal Physiology, Mechanisms and Functions, Raven Press, New York, 1988, pp. 49-65. [19] I. R. Titze, J. J. Jiang and D. G. Druker, “Preliminaries to the Body-Cover Theory of Pitch Control,” Journal of Voice, Vol. 1, No. 4, 1988, pp. 314-319. doi:10.1016/S0892-1997(88)80004-3 [20] I. R. Titze, E. S. Luschei and M. Hirano, “The Role of the  S. DEGUCHI ET AL. 201 Thyroarytenoid Muscle in Regulation of Fundamental Frequency,” Journal of Voice, Vol. 3, No. 3, 1989, pp. 213-224. doi:10.1016/S0892-1997(89)80003-7 [21] S. Deguchi, Y. Kawahara and S. Takahashi, “Cooperative Regulation of Vocal Fold Morphology and Stress by the Cricothyroid and Thyroarytenoid Muscles,” Journal of Voice, in press. [22] T. Baer, J. C. Gore, L. C. Gracco and P. W. Nye, “Analy- sis of Vocal Tract Shape and Dimensions Using Magnetic Resonance Imaging: Vowels,” Journal of the Acoustical Society of America, Vol. 90, No. 2, 1991, pp. 799-828. doi:10.1121/1.401949 [23] G. R. Farley, “A Quantitative Model of Voice F0 Con- trol,” Journal of the Acoustical Society of America, Vol. 95, No. 2, 1994, pp. 1017-1029. doi:10.1121/1.408465 [24] T. Ikeda and Y. Matsuzaki, “A One-Dimensional Un- steady Separable and Reattachable Flow Model for Col- lapsible Tube-Flow Analysis,” Journal of Biomechanical Engineering, Vol. 121, No. 2, 1999, pp. 153-159. doi:10.1115/1.2835097 [25] S. Deguchi, Y. Miyake, Y. Tamura and S. Washio, “Wavelike Motion of a Mechanical Vocal Fold Model at the Onset of Self-Excited Oscillation,” Journal of Bio- mechanical Science and Engineering, Vol. 1, No. 1, 2006, pp. 246-255. doi:10.1299/jbse.1.246 [26] I. R. Titze, “The Physics of Small-Amplitude Oscillation of the Vocal Folds,” Journal of the Acoustical Society of America, Vol. 83, No. 4, 1988, pp. 1536-1552. doi:10.1121/1.395910 [27] J. C. Lucero and L. L. Koenig, “On the Relation between the Phonation Threshold Lung Pressure and the Oscilla- tion Frequency of the Vocal Folds,” Journal of the Acoustical Society of America, Vol. 121, No. 6, 2007, pp. 3280-3283. doi:10.1121/1.2722210 Copyright © 2011 SciRes. AJCM
|