Open Access Library Journal
Vol.03 No.10(2016), Article ID:71416,13 pages
10.4236/oalib.1103050
Soft Vibrational Force on Stock Market Networks
Mehmet Ali Balcı, Ömer Akgüller
Department of Mathematics, Muğla Sıtkı Koçman University, Muğla, Turkey

Copyright © 2016 by authors and Open Access Library Inc.
This work is licensed under the Creative Commons Attribution International License (CC BY 4.0).
http://creativecommons.org/licenses/by/4.0/


Received: September 13, 2016; Accepted: October 13, 2016; Published: October 17, 2016
ABSTRACT
Stock market networks commonly involve uncertainty, and the theory of soft sets emerges as a powerful tool to handle it. In this study, we present a soft analogue of the differential of a vibrational potential function acting on a stock market network as vibrational force. For this purpose, we first study the vibrational potential function operating on each vertex by using the Laplacian of the neighborhood graph, then applied the soft approximator for the soft sets where the data points are embedded to Euclidean n space. We used the data of the globally operating leading stock markets of 17 countries and presented the results respect to them.
Subject Areas:
Applied Statistical Mathematics, Combinatorial Mathematics, Discrete Mathematics, Mathematical Economics
Keywords:
Network Modelling, Multivariate Analysis, Soft Analysis, Stock Exchange Network, Soft Set Theory

1. Introduction
Mathematical analysis of complex networks has become accepted since the more methodologies started to be used. The pioneering study is proposed by Mantegna in [1] , and long has been attracted several researchers. Analyzing networks with statistically and mathematically methods lets us get the topological properties of a market and its core information. Given stock market model uncertainty; soft, fuzzy, and rough com- puting techniques are viable candidates to capture stock market nonlinear relations. Recently, artificial neural networks and support vector machines have been applied to solve the problems of predicting financial stock market prediction [2] - [4] . Besides, studies in combination of neural networks with rough sets are used to predict the behavior of such stock markets [5] [6] .
One of the strong mathematical tool to deal with uncertainty is Soft Set Theory which is introduced in [7] . By the arise of the theory its algebraic [8] [9] and topological [10] [11] properties, its relation with other theories [12] - [14] , and also implicational feature of the theory [15] - [18] have been studied intensively. We refer [19] to the interested readers for soft set theoretical analogues of the basic set operations.
In this study we first consider a financial network which is constructed from the correlation of daily logarithmic return of the closure price of globally leading 17 stock markets. As a common approach, this network is modelled as the tuple  where the V is the set of vertices, that is the stock markets, and E is the set of edges or links in the network. G is considered as an undirected simple graph throughout the study. For basic operations and well-known concepts about the graph theory, we refer interested readers to [20] . It can also be seen that a soft set is not a set but set systems, hence there is a strong correspondence between the theories of Soft Sets and Hypergraphs. Henceforth, to apply soft set theoretical concepts to networks, we first obtain a hypergraph representation of the network by using k-neighborhood of a graph vertex. In Section 3, we explain this correspondence in details. Also, since each stock market is represented with time series we present a soft approximator in Section 3. This approximator can also be seen as the soft analogue of the subgradient. In Section 4, we present a new function called “vibrational potential energy” that operating on each vertex of the network. Any kind of local or global economic stress or crisis in a stock market directly affects its neighboring stock markets. Therefore, we defined our function respect to neighborhood graph Laplacian rather than the one that is introduced in [21] . Finally, in Section 5, we present the data and the algorithm to construct networks with respect to graph spectrum that is used to obtain results. In this section, the results can also be found in details.
2. Preliminaries
The tuple  is called an undirected graph for the the vertices or nodes set V and the edge or links set E. Each elements of E is an unordered pair of vertices that is
 . For any vertices
  the graph G is called connected if there is a path , i.e. a sequence of edges, whose end points are
  and
and . The complete graph is an undirected graph with every pair of apart vertices is connected by an edge. In the case of real world data representation, each edge in E may be assigned by a non-- negative numerical value. This value is called as a weigh and for the mapping
 , the triple
  is called as a weighted graph.
A common way to represent a graph is using a binary matrix whose elements are

This matrix is called adjacency matrix and symmetric by the definition. This symmetry property concludes that the adjacency matrix has orthonormal basis of eigenvectors and the number of vertices many eigenvalues.
For a vertex v in an undirected graph G, the number of edges incident to that vertex is called degree and let us denote it by . For the graph
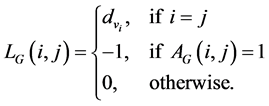
 , the Laplacian Matrix of G is the matrix whose entries are
The graph Laplacian does not depend on an ordering of the vertices of G. Let us now denote the spectrum of  by
by  for the graph with
 . The Laplacian is positive-semidefinite, i.e. all of its eigenvalues have
  with the least one 0. For an undirected graph with nonnegative weights, the multiplicity k of the eigenvalue 0 of
  equals the number of connected components
  in the graph [22] .
Consider a graph . Now if
  and there are
  edges such that some one point, v, is directly connected or adjacent to all of the others, G is a n-star. A neighborhood graph, then, is any graph of n points that contains a n-star. The neighborhood graph of a given graph from a vertex v can also be seen as the subgraph induced by the neighborhood of a graph from vertex v [23] .
3. Soft Analysis
Classical analysis concepts may not be as powerful as the soft computing concepts to deal with real world data since the uncertainty. One of the powerful tool to deal with uncertainty is Soft Set Theory that is first introduced by Molodtsov in [7] . This theory differs from the theories of same kind like rough sets, vague sets, and fuzzy sets theories by the qualifying the parameters.
Definition 3.1. Let A be a subset of E. A pair  is called a soft set over U where
  is a set-valued function.
It is possible to conclude that a soft set over U is a parameterized family of subsets of the universe U. It is also common to consider a soft set as the approximate descriptions of an object [7] [19] . For a real valued function, the concept of soft approximation of a function is defined and studied deeply in [7] . However, we need an extended definition for the soft sets whose points are embedded in Euclidean n-dimensional space:
Definition 3.2. Let E be  and
and  with an intrinsic metric. For every point
 ,
,  is defined as an open ball centered to the point x with the radius
 . Let
. Let  and
and  be positive numbers.
  the set

is called  -approximator of function
  at the point x, where “
 ” is an inner product.
The approximator given in Definition 3.2 can be seen as the three parameter approximator that is dealt in Non-differentiable Optimization. For more see [24] . It is also straightforward to show the basic properties such as linearity and convexity of the soft approximator.
From the mathematical point of view, a soft set is a set-valued function that maps parameters to the subset a universe. Frankly, similar mathematical settings such as Formal Concept Analysis [25] , Spatial Analysis [26] , and Hypergraphs [27] [28] have been studied extensively. A striking example is the concept of Hypergraphs. Hypergra- phs are the generalization of simple graphs in such way that an edge may include more than two vertices. When a hypergraph occurs as a set system one may correspond it as a soft set.
For an illustrative example let us consider the hypergraph model given in Figure 1. The hypergraph that is given as a tuple  with the vertex set

and the hyperedge set

naturally revokes the soft set 

4. Vibrational Potential
Whenever a complex network is under consideration, some of the physical concepts can be helpful to analyze it. One of these concepts is called Vibrational Potential and can be interpreted by immersing the network into a thermal bath, then analyzing the displacement of a node from its equilibrium under the small perturbations in the network. The vibrational potential energy of the network can be given as

where k is the spring constant,  is the graph Laplacian, and
  is the vector whose i-th entry is the displacement
 . The vibrational potential of a network is studied deeply in [21] .

Figure 1. A hypergraph example.
In this study we aim to investigate the change of the vibrational potentials under the soft approximators. Henceforth, the definition of a real valued function defined on the nodes of a network is needed. Let  be the simple undirected graph repre- sentation of a network under consideration with the node set V and the link set E. For a complex network such as stock market network, a thermal bath can be seen as the global economic crisis or local economic stress that effects the network. Henceforth, the assumption of the node in a financial network is mostly effected by its neighborhood markets do not contradict to the neoclassical theory of economics. By this assumption, we may express the vibrational potential energy of the node in the network as

where k is the spring constant,  is the Laplacian of the neighborhood graph
  of the node v in the network G, and
  is the vector whose i-th entry is the displacement
  in the neighborhood graph
 .
.
The mean displacement of a node  in
in  can be expressed by

where  is the probability distribution

with

and  is the inverse temperature. The mean square of the displacement of the i-th node can be given as

Using the unification methods that presented in [21] [29] the mean square of the displacement can also be computed as

where  is the Moore-Penrose generalised inverse of the neighborhood graph Laplacian
 .
.
5. Experimental Verification
As pointed out in Section 3, a hypergraph naturally yields a soft set. In this section we present a method to construct a soft set from a financial network and then consider the soft derivatives of the vibrational potentials acting on the nodes of the network that are globally operating stock markets and name after “soft vibrational force”. For a stock market network represented by a simple graph, k-neighborhood of vertices yields a cluster of vertex set. Henceforth, a hypergraph representation for stock market network can be obtained by k-neighborhoods. Since a crisis or stress mostly effect stock markets that are mostly correlated, we use 1-neighborhood to obtain a soft set representation of the stock market. After we introduced the real valued vibrational potential function that operates on vertices separately in Section 4, the soft vibrational force on stock markets can be computed as

where  is the set of vertices in the 1-neighborhood of each stock market.
5.1. Data
The data we used in this study are obtained from the stock markets that operating in America, Europe, and Asia in the time scale from 02.01.2006 to 29.02.2016. Those stock markets are Holland (AEX), Austria (ATX), Turkey (BIST), France (CAC), Germany (DAX), USA (DOW, NASDAQ, SP500), European Union (EUSTOX), UK (FTSE), Mexica (IPC), South Korea (KOSPI), Argentina (MERVAL), Japan (NIKKEI), Switzerland (SMI), Israel (TELAVIV), and Taiwan (TSEC).
For the daily closure price  of the i-th stock market, the daily logarithmic return is calculated as

To catch optimized many links between the stocks, we use the Pearson correlation of each stock as

where  is a temporal average performed on all the trading days of the investigated time period,
  are the numerical labels of stocks, and
 . By the introduction of the distance function respect to correlation coefficients as
  . Since
 ,
,  for all
 . The matrix D whose
  -th entry is
  is also called as correlation distance matrix of the network. The correlation distance matrix respect to aforementioned data set is given in Figure 2. As
  varies 0 to 1, the colour in the figure varies white to black, respectively.

Figure 2. The monochromatic representation of the correlation distance matrix D.
5.2. Network Construction
Respect to the correlation distance matrix, it is possible to construct the network as threshold distance sense. Since our analysis depends on connectedness of the network, we may use the spectrum of the simple graph representation to determine boundary to the threshold. The well-known theorem from spectral graph theory states that the multiplicity k of the eigenvalue 0 of the graph Laplacian equals the number of connected components in the graph. Our method to construct network first starts with n-complete graph; i.e., a graph with all vertices are adjacent. Then by subdividing  interval with h step, we determine the boundary as the greatest value where the correlation distance between each vertex is less and equal to and the graph remains with one component. The algorithm is given in Table 1 in pseudo-codes.
5.3. Results
Let us label vertices as the rule given in Table 2 throughout the study.

Table 1. An Algorithm to determine the boundary for threshold distance.
Table 2. Vertex labelling rule for the stock market network.
For the  the boundary of the network to be connected is 0.86. The respected network is given in Figure 3. This network structure preserves really strong connections between the nodes. However, these kind of links do not accurately model the real world situation. For instance, in this network NASDAQ is only connected to TELAVIV. However, it is well known that USA stock markets are effective in stock market networks [30] - [32] . Hence, for our study we choose a more accurate network for the threshold distance 0.8 as in Figure 4.
The 1-neighborhood of each node yields the following soft set for this network:

The neighborhood graphs of each elements of the soft set can be obtained by considering the network. In Figure 5 two of the examples of neighborhood graphs are presented. The left on is for BIST and the right one is for NASDAQ.

Figure 3. The network with .
.

Figure 4. The network with .
.

Figure 5. The neighborhood graphs of BIST and NASDAQ.
Since our soft approximation definition relies on the intrinsic metric of the network and the nodes are the time series of the each stock markets daily logarithmic return, we compute the soft differential analogue of the vibrational potential function operating on each node as

where the inner product arise from the standard correlation distance.
For ,
,  , resulting soft vibrational force is:


and for ,
,  , resulting soft vibrational force is:


6. Conclusions
Certain kinds of real world problems are hard to model by using only classical ideas. Hence, theories involving uncertainty, vagueness, or parameters such as soft set theory may be helpful to analyze these kinds of models. In this paper, we give a new soft approximation idea where each elements are described as a time series; i.e., embedded in . Networks are usually modelled by simple graphs and involve an instinct metric. Therefore by introducing the soft set representation which arise from the hypergraph of a simple network respect to k-neighborhood, it is possible to use this soft approxima- tion on networks. Especially, we consider stock market networks in this study but it is also possible to extend this approach to other complex networks such as social networks, computer networks, biological networks etc. [33] [34] . To analyze soft analo- gue of the differential of a function acting on a network, we introduced vibrational potential function that is defined by the neighborhood graph of 1-neighborhood the vertices of the network under consideration. This function differs from the one that is given in [21] by using the Moore-Penrose inverse of the neighborhood graph.
The network we use in this study is constructed from the stock market’s daily logarithmic return of the closure price by a predetermined threshold distance and the correlation distance between each data. The upper boundary for the distance is 0.86, hence we used 0.8 to obtain more accurate results. By introducing the vibrational potential function operating on vertices, we analyzed the soft approximation of the function and softly-computed the vibrational force acting on the network. For the parameters  and
and , and
, and  and
and  it can be concluded that a global economic crisis is mostly affect the small European economies such as Holland (AEX), Austria (ATX), and Turkey (BIST). The European Union Stock Market (EUSTOX) and DOW of USA are affected mostly from the leading global economies.
Cite this paper
Balcı, M.A. and Akgüller, Ö. (2016) Soft Vibrational Force on Stock Market Networks. Open Access Library Journal, 3: e3050. http://dx.doi.org/10.4236/oalib.1103050
References
- 1. Mantegna, R.N. (1999) Hierarchical Structure in Financial Markets. The European Physical Journal B-Condensed Matter and Complex Systems, 11, 193-197.
http://dx.doi.org/10.1007/s100510050929 - 2. Avc, E. (2007) Forecasting Daily and Sessional Returns of the ISE-100 Index with Neural Network Models. Journal of Dogus University, 8, 128-142.
- 3. Boyacioglu, M.A. and Avci, D. (2010) An Adaptive Network-Based Fuzzy Inference System (ANFIS) for the Prediction of Stock Market Return: The Case of the Istanbul Stock Exchange. Expert Systems with Applications, 37, 7908-7912.
http://dx.doi.org/10.1016/j.eswa.2010.04.045 - 4. Zhang, Y.D. and Wu, L.N. (2009) Stock Market Prediction of S&P 500 via Combination of Improved BCO Approach and BP Neural Network. Expert Systems with Applications, 36, 8849-8854.
- 5. Shamsuddin, S.M., Jaaman, S.H. and Darus, M. (2009) Neuro-Rough Trading Rules for Mining Kuala Lumpur Composite Index. European Journal of Scientific Research, 28, 278-286.
- 6. Wang, X.Y. and Wang, Z.O. (2002) Stock Market Time Series Data Mining Based on Regularized Neural Network and Rough Set. Proceedings of International Conference on Machine Learning and Cybernetics, 1, 315-318.
- 7. Molodtsov, D. (1999) Soft Set Theory—First Results. Computers and Mathematics with Applications, 37, 19-31.
http://dx.doi.org/10.1016/S0898-1221(99)00056-5 - 8. Aktas, H. and Cagman, N. (2007) Soft Sets and Soft Groups. Information Sciences, 177, 2726-2735.
http://dx.doi.org/10.1016/j.ins.2006.12.008 - 9. Jun, Y.B. (2008) Soft BCK/BCI-Algebras. Computers and Mathematics with Applications, 56, 1408-1413.
http://dx.doi.org/10.1016/j.camwa.2008.02.035 - 10. Ge, X., Li, Z. and Ge, Y. (2011) Topological Spaces and Soft Sets. Journal of Computational Analysis and Applications, 13, 881-885.
- 11. Tanay, B. and Kandemir, M.B. (2015) Results on Fuzzy Soft Functions. New Trends in Mathematical Sciences, 3, 1-17.
- 12. Feng, F., Li, C., Davvaz, B. and Ali, M.I. (2010) Soft Sets Combined with Fuzzy Sets and Rough Sets: A Tentative Approach. Soft Computing, 14, 899-911.
http://dx.doi.org/10.1007/s00500-009-0465-6 - 13. Xu, W., Ma, J., Wang, S. and Hao, G. (2010) Vague Soft Sets and Their Peoperties. Computers and Mathematics with Applications, 59, 787-794.
http://dx.doi.org/10.1016/j.camwa.2009.10.015 - 14. Zhang, W., Zhong, W. and Guo, X. (2014) An Explicit Length Scale Control Approach in SIMP-Based Topology Optimization. Computer Methods in Applied Mechanics and Engineering, 282, 71-86.
http://dx.doi.org/10.1016/j.cma.2014.08.027 - 15. Feng, F., Jun, Y.B., Liu, X. and Li, L. (2010) An Adjustable Approach to Fuzzy Soft Set Based Decision Making. Journal of Computational and Applied Mathematics, 234, 10-20.
http://dx.doi.org/10.1016/j.cam.2009.11.055 - 16. Ali Balci, M. and Akguller, O. (2015) Mathematical Morphology on Soft Sets for Application to Metabolic Networks. In: An Le Thi, H., Nguyen, N.T. and Van Do, T., Eds., Advanced Computational Methods for Knowledge Engineering, Springer International Publishing, Berlin, 209-218.
- 17. Kalayatkankal, S.J. and Suresh Singh, G. (2010) A Fuzzy Soft Flood Alarm Model. Mathematics and Computers in Simulation, 80, 887-893.
http://dx.doi.org/10.1016/j.matcom.2009.10.003 - 18. Herewan, T. and Deris, M.M. (2011) A Soft Set Approach for Association Rules Mining. Knowledge Based Systems, 24, 186-195.
http://dx.doi.org/10.1016/j.knosys.2010.08.005 - 19. Maji, P.K., Biswas, R. and Roy, A.R. (2003) Soft Set Theory. Computers and Mathematics with Applications, 45, 555-562.
http://dx.doi.org/10.1016/S0898-1221(03)00016-6 - 20. West, D.B. (2001) Introduction to Graph Theory. Vol. 2, Prentice Hall, Upper Saddle River.
- 21. Ernesto, E. and Hatano, N. (2010) A Vibrational Approach to Node Centrality and Vulnerability in Complex Networks. Physica A: Statistical Mechanics and Its Applications, 389, 3648-3660.
http://dx.doi.org/10.1016/j.physa.2010.03.030 - 22. Ulrike, V.L. (2007) A Tutorial on Spectral Clustering. Statistics and Computing, 17, 395- 416.
http://dx.doi.org/10.1007/s11222-007-9033-z - 23. Newman, M. (2010) Networks: An Introduction. Oxford University Press, Oxford.
http://dx.doi.org/10.1093/acprof:oso/9780199206650.001.0001 - 24. Pallaschke, D. and Rolewicz, S. (2013) Foundations of Mathematical Optimization: Convex Analysis without Linearity. Vol. 388, Springer, Berlin.
- 25. Stumme, G. (2009) Formal Concept Analysis. In: Staab, S. and Studer, R., Eds., Handbook on Ontologies, Springer, Berlin, 177-199.
http://dx.doi.org/10.1007/978-3-540-92673-3_8 - 26. Bailey, T.C. and Gatrell, A.C. (1995) Interactive Spatial Data Analysis. Vol. 413, Longman Scientific & Technical, Essex.
- 27. Claude, B. (1973) Graphs and Hypergraphs. Vol. 7, North-Holland Publishing Company, Amsterdam.
- 28. Claude, B. (1984) Hypergraphs: Combinatorics of Finite Sets. Vol. 45, Elsevier, Amsterdam.
- 29. Estrada, E. and Hatano, N. (2010) Topological Atomic Displacements, Kirchhoff and Wiener Indices of Molecules. Chemical Physics Letters, 486, 166-170.
http://dx.doi.org/10.1016/j.cplett.2009.12.090 - 30. Abraham, A., Nath, B. and Mahanti, P.K. (2001) Hybrid Intelligent Systems for Stock Market Analysis. International Conference on Computational Science, San Francisco, 28-30 May 2001, 337-345.
- 31. Qian, M.C., Jiang, Z.Q. and Zhou, W.X. (2010) Universal and Nonuniversal Allometric Scaling Behaviors in the Visibility Graphs of World Stock Market Indices. Journal of Physics A: Mathematical and Theoretical, 43, Article ID: 335002.
http://dx.doi.org/10.1088/1751-8113/43/33/335002 - 32. Naylor, M.J., Rose, L.C. and Moyle, B.J. (2007) Topology of Foreign Exchange Markets Using Hierarchical Structure Methods. Physica A: Statistical Mechanics and Its Applications, 382, 199-208.
http://dx.doi.org/10.1016/j.physa.2007.02.019 - 33. Newman, M.E. and Girvan, M. (2004) Finding and Evaluating Community Structure in Networks. Physical Review E, 69, Article ID: 026113.
http://dx.doi.org/10.1103/physreve.69.026113 - 34. Boccaletti, S., Latora, V., Moreno, Y., Chavez, M. and Hwang, D.U. (2006) Complex Networks: Structure and Dynamics. Physics Reports, 424, 175-308.
http://dx.doi.org/10.1016/j.physrep.2005.10.009