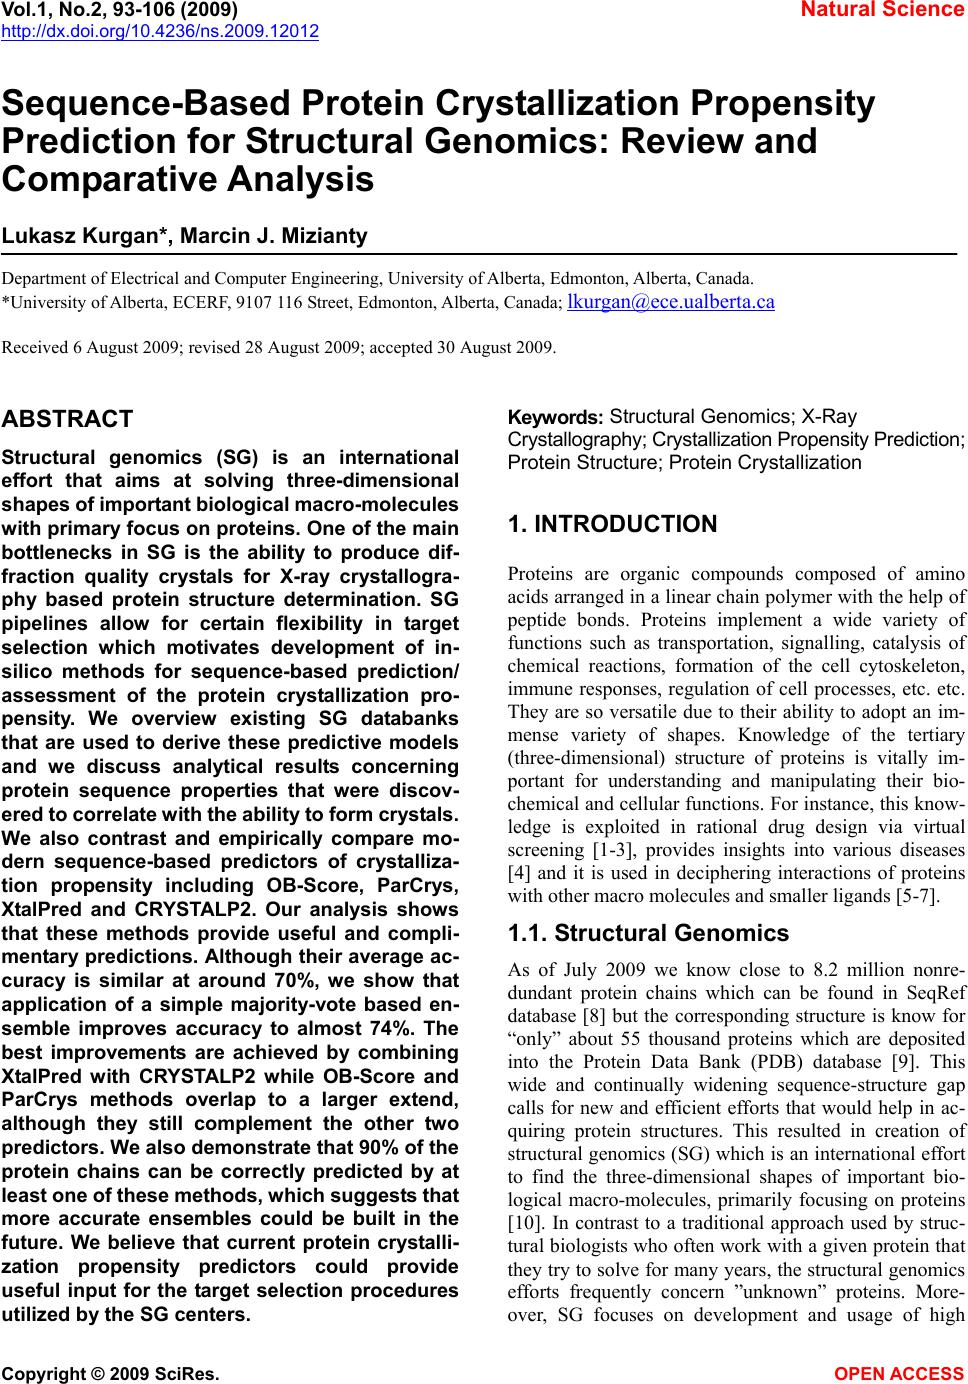
 Vol.1, No.2, 93-106 (2009) Natural Science http://dx.doi.org/10.4236/ns.2009.12012 Copyright © 2009 SciRes. OPEN ACCESS Sequence-Based Protein Crystallization Propensity Prediction for Structural Genomics: Review and Comparative Analysis Lukasz Kurgan*, Marcin J. Mizianty Department of Electrical and Computer Engineering, University of Alberta, Edmonton, Alberta, Canada. *University of Alberta, ECERF, 9107 116 Street, Edmonton, Alberta, Canada; lkurgan@ece.ualberta.ca Received 6 August 2009; revised 28 August 2009; accepted 30 August 2009. ABSTRACT Structural genomics (SG) is an international effort that aims at solving three-dimensional shapes of important biological macro-molecules with primary focus on proteins. One of the main bottlenecks in SG is the ability to produce dif- fraction quality crystals for X-ray crystallogra- phy based protein structure determination. SG pipelines allow for certain flexibility in target selection which motivates development of in- silico methods for sequence-based prediction/ assessment of the protein crystallization pro- pensity. We overview existing SG databanks that are used to derive these predictive models and we discuss analytical results concerning protein sequence properties that were discov- ered to correlate with the ability to form crystals. We also contrast and empirically compare mo- dern sequence-based predictors of crystalliza- tion propensity including OB-Score, ParCrys, XtalPred and CRYSTALP2. Our analysis shows that these methods provide useful and compli- mentary predictions. Although their average ac- curacy is similar at around 70%, we show that application of a simple majority-vote based en- semble improves accuracy to almost 74%. The best improvements are achieved by combining XtalPred with CRYSTALP2 while OB-Score and ParCrys methods overlap to a larger extend, although they still complement the other two predictors. We also demonstrate that 90% of the protein chains can be correctly predicted by at least one of these methods, which suggests that more accurate ensembles could be built in the future. We believe that current protein crystalli- zation propensity predictors could provide useful input for the target selection procedures utilized by the SG centers. Keywords: Structural Genomics; X-Ray Crystallography; Crystallization Propensity Prediction; Protein Structure; Protein Crystallization 1. INTRODUCTION Proteins are organic compounds composed of amino acids arranged in a linear chain polymer with the help of peptide bonds. Proteins implement a wide variety of functions such as transportation, signalling, catalysis of chemical reactions, formation of the cell cytoskeleton, immune responses, regulation of cell processes, etc. etc. They are so versatile due to their ability to adopt an im- mense variety of shapes. Knowledge of the tertiary (three-dimensional) structure of proteins is vitally im- portant for understanding and manipulating their bio- chemical and cellular functions. For instance, this know- ledge is exploited in rational drug design via virtual screening [1-3], provides insights into various diseases [4] and it is used in deciphering interactions of proteins with other macro molecules and smaller ligands [5-7]. 1.1. Structural Genomics As of July 2009 we know close to 8.2 million nonre- dundant protein chains which can be found in SeqRef database [8] but the corresponding structure is know for “only” about 55 thousand proteins which are deposited into the Protein Data Bank (PDB) database [9]. This wide and continually widening sequence-structure gap calls for new and efficient efforts that would help in ac- quiring protein structures. This resulted in creation of structural genomics (SG) which is an international effort to find the three-dimensional shapes of important bio- logical macro-molecules, primarily focusing on proteins [10]. In contrast to a traditional approach used by struc- tural biologists who often work with a given protein that they try to solve for many years, the structural genomics efforts frequently concern ”unknown” proteins. More- over, SG focuses on development and usage of high  L. Kurgan et al. / Natural Science 1 (2009) 93-106 Copyright © 2009 SciRes. OPEN ACCESS 94 throughput and cost-effective methods for protein pro- duction and determination of the corresponding structure which are implemented with the help of dedicated SG centers. In the United States one of the first SG efforts, which was undertaken around year 2000, was the crea- tion of a multi-center, including four large-scale centers and six specialized centers, Protein Structure Initiative. Similar SG projects were also carried out in Canada, Israel, Japan, and Europe. For example, Structural Ge- nomics Consortium which was formed in 2004 spans centers at the Oxford University, University of Toronto and Karolinska Institute. Analysis shows that in 2004/ 2005 about half of protein structures were solved at a SG centers rather than in the traditional laboratory [11]. Also, at that time the cost of solving a structure at the most efficient SG center in the United States was equal to about 25% of the estimated cost when using the tradi- tional methods [11]. Another more recent study shows that the production-line approach taken at the Protein Structure Initiative centers reduced the cost of solving structures from ~$250,000 apiece in 2000 to ~$66,000 in 2008 [12]. Most importantly, from our point of view, these SG initiatives shifted the focus from one-by-one determination of individual protein structures, which is being pursued by structural biologists, to protein fam- ily-directed structure analyses in which a group of pro- teins is targeted and structure(s) of representative mem- bers are determined and used to represent the entire group [13]. The corresponding process of choosing rep- resentative proteins is known as target selection and it encompasses a computational process of restricting can- didate proteins to those that are tractable and of un- known structure and prioritizing them according to ex- pected interest and accessibility [14]. In the case of the Protein Structure Initiative, the target selection concen- trates on representatives from large, structurally unchar- acterized protein domain families, and from structurally uncharacterized subfamilies in very large and diverse families with incomplete structural coverage [15]. We note that this approach allows for some flexibility in the selection of the targets. 1.2. X-ray Crystallography and Protein Crystallization The protein structures are being determined with the help of experimental methods including X-ray crystal- lography [16], NMR spectroscopy [17], electron mi- croscopy [18], and (more recently) by application of computational approaches such as homology modelling [19, 20]. The most popular method, which accounts for approximately 86% of the solved and deposited protein structures, is the X-ray crystallography; see Figure 1. At the same time, the other approaches play a strong com- plementary role for some protein types, such as mem- brane proteins [21, 22]. One of the main challenges the SG initiative faces it that only about 2-10% of protein targets pursued in the context of the second step of the Protein Structure Initia- tive yield high-resolution protein structures [23]. We further investigated these estimates based on data pub- lished in the TargetDB database [24] in July 2009. Tar- getDB is a world-wide database that provides informa- tion on the experimental progress and status of targets 0 5000 10 0 0 0 15 0 0 0 20000 25000 30000 35000 40000 45000 50000 55000 1990199119921993199419951996199719981999 2000200120022003 2004 2005 20062007 2008 2009 yea cumulative number of solved structures X-ray crystallography NMR spectroscopy Electron microscopy Figure 1. The growth in the number of protein structures deposited into PDB by that were solved by X-ray crystallography, NMR spectroscopy and electron microscopy (source http://www.rcsb.org/).  L. Kurgan et al. / Natural Science 1 (2009) 93-106 Copyright © 2009 SciRes. OPEN ACCESS 95 95 selected for structure determination. Among 150,727 cloned targets that were deposited into TargetDB, only 37,398 (24.8%) were reported to be successfully purified, 12,923 (8.6%) to be successfully crystallized, and 6,942 (4.6%) gave diffraction quality crystals. Moreover, some estimates show that more than 60% of the cost of struc- ture determination is consumed by the failed attempts [25] while crystallization is characterized by a signifi- cant rate of attrition and is among the most complex and least understood problems in structural biology [26]. The above provides a strong motivation for further research and development in this area. Several strategies have been proposed to improve the success rate including obtaining one representative structure per protein family and working with multiple orthologues [14, 26, 27, 28]. In spite of advances made in the context of protein crys- tallization [29], the above numbers and insights from some researchers [30-32] demonstrate that the produc- tion of high-quality crystals is one of the major bottle- necks in the protein structure determination. The crystals should be sufficiently large (> 50 micrometres), pure in composition, regular in structure and with no significant internal imperfections. The problem of production of diffraction-quality crystals is usually tackled using an empirical approach based mainly on trial and error (also called the “art” of crystallisation), in which a large number of experiments is brute-forced to find a suitable setup, and through understanding of the fundamental principles that govern crystallisation [30]. The latter is used to design new (and improved) experimental meth- odologies that would produce high-quality crystals. 1.3. Databases One of the early steps taken to alleviate the abovemen- tioned difficulties in resolving the structures via X-ray crystallography was to create databanks that record in- formation concerning both successful and failed attempts to produce the structures. The importance of these efforts was advocated in 2000 by Raymond Stevens who said that “industrial-scale efforts will lead to the generation of knowledge bases that will be mined to expand our understanding of the techniques used in protein crystal- lography. These efforts will act as ‘learning factories’, in which successes and failures will be used to continually improve the technology for high-throughput protein cry- stallography“ [33]. These words were echoed in 2003 by Rodrigues and Hubbard who said “as structural genomics projects evolve, valuable experimental data will be accumulated, thus presenting researchers with a unique opportunity to establish improved predictive methods for a protein’s chemical and physical behaviour based on its amino acid sequence. It is essential for laboratories producing such data to keep track of both ‘successful’ and ‘unsuccessful’ results, so that these can be fed back into the structural determination pipeline through the improvement of the target selection procedures” [34]. The development of the databases was fuelled by generation of large and well an- notated experiments by SG centers, such as one for the Thermotoga maritime proteome [35]. To the best of our knowledge, the first such initiative was the PRESAGE database which included annotations indicating current experimental status, structural predictions and suggestions [36]. Some of the SG consortia have established on-line progress reports which contain details and current ex- perimental status of their targets. Examples include Inte- grated Consortium Experimental Database [37], ZebaView (http://www-nmr.cabm.rutgers.edu/bioinformatics/ZebaView/), ReportDB (http://www.secsg.org/cgi-bin/report.pl) and SPINE (Structural Proteomics in the NorthEast) [38, 39]. SPINE, which was developed in early 2000 and reengi- neered in 2003, integrates a tracking database and a data mining method for identifying feasible targets. Each protein deposited in this database is described with in- formation related to the experimental progress (e.g., ex- pression level, solubility, ability to crystallize) and 42 descriptors of the underlying protein sequence (amino acid composition, secondary structure, etc.). The largest and most comprehensive TargetDB [24] was launched July 2001 and it builds upon the work on the PRESAGE database. TargetDB serves as a primary target registra- tion database for structural SG project worldwide. It consolidates data from 28 SG centers in USA, Canada, Germany, Isreal, Japan, France and UK, including 9 Protein Structure Initiative centers. PepcDB (Protein Expression Purification and Crystallization DataBase), which was created around 2004, was established as an extension to TargetDB to collect more detailed status information and the experimental details of each step in the protein structure production pipeline [40]. This da- tabase stores a complete history of the experimental steps in each production trial besides describing the cur- rent target production status. PepcDB records status his- tory, stop conditions, reusable text protocols and contact information collected from 15 SG centers in USA. The interested readers are directed to two recent articles by Helen Berman that introduce a wealth of resources con- cerning the SG initiative [41] and a knowledgebase de- veloped by the Protein Structure Initiative [42]. 1.4. Computational Models in Protein Crystallization The problems with the protein crystallization and the availability of the suitable databases motivated the de- velopment of analytical and predictive models that can be used to either support or directly predict protein crys- tallization [43]. These models were often developed by researchers at certain SG centers who used their own data to draw conclusions. In one of the first attempts, a  L. Kurgan et al. / Natural Science 1 (2009) 93-106 Copyright © 2009 SciRes. OPEN ACCESS 96 decision tree that predicts solubility from protein se- quence was developed [44]. The SPINE system, which was developed at the Northeast Structural Genomics Consortium, incorporates decision tree-based classifiers for solubility and crystallization propensity. This system was used to extract a few interesting rules such that soluble proteins tend to have more acidic residues and fewer hydrophobic segments [38]. The SG project on Plasmodium falciparum has lead to an analysis of pro- tein characteristics, such as the presence of transmem- brane helices, low-complexity regions, and coiled-coil regions, in the context of the crystallization propensity [34]. Another decision tree-based predictive model de- veloped by Goh and colleagues in 2004 using data from TargetDB has revealed several protein features that in- fluence the feasibility of using a given target protein chain for a high-throughput structure determination [45]. They include conservation of the sequence across organ- isms, composition of charged residues, occurrence of hydrophobic patches in the sequence, number of binding partners, and chain length. Based on the data from the Thermotoga maritime proteome [35], the researchers at the Joint Center for Structural Genomics discovered a few features, which include isoelectric point, sequence length, average hydropathy, existence of low complexity regions, presence of signal peptides and trans-membrane helices, that correlate with crystallization [46]. The isoelectric point calculated from the protein sequence was also used to develop a method that suggests optimal pH ranges for crystallization screening [47, 48]. Ex- perimental work by Derewenda’s group shows that crys- tallization can be improved by application of surface entropy reduction approach in which clusters of two or three exposed amino acids with high conformational entropy side chains (such as Lys, Glu and Gln) are re- placed with lower-entropy residues (like Ala) [49-54]. One drawback of this method is that it may decrease protein solubility which hinders crystallization screening [50, 52]. The surface entropy reduction approach was recently implemented as a web server [55]. This server utilizes information concerning conformational entropy and solvent exposure indices, predicted secondary struc- ture, residues conservation scores, and close homologues to propose crystallization enhancing mutations for a given protein sequence. Another study, which was con- ducted at the Center for Eukaryotic Structural Genomics, used disorder prediction algorithms to analyze the im- pact of intrinsic protein disorder on crystallization effi- ciency [56]. The Berkeley Structural Genomics Center has utilized several protein features including length of the sequence and predicted transmembrane helices, coiled coils, and low-complexity regions to eliminate targets predicted to be intractable for the high-through- put structure determination [57]. The most recent study that was performed at the Northeast Structural Genomics Consortium shows that crystallization propensity de- pends primarily on the prevalence of well-ordered sur- face epitopes [58]. More specifically, the authors show that crystallization propensity can be computed from the knowledge of predicted disordered regions, side-chain entropy of predicted exposed residues, the amount of predicted buried Gly and the fraction of Phe in the input sequence. 2. SEQUENCE-BASED METHODS FOR PREDICTION OF PROTIEN CRYSTALLIZATIONPROPENSITY The SG efforts allow for certain flexibility in selection of the chains for the crystallization and the subsequent structure determination and this motivates development of methods that aim at the prediction/assessment of the crystallization propensity for a given input sequence. Such methods could be incorporated into target selection pipelines that are utilized by SG centers. Their develop- ment is often supported and motivated by the described above computational analyses/models. We also note that numerous studies have already demonstrated that se- quence-based prediction approaches, which may address a variety of structural and functional properties of pro- teins, provide useful information and insights for both basic research and drug design and hence are widely welcome by the scientific community [59-63]. Crystallization propensity prediction methods incor- porate predictive models that are extracted from larger datasets that span data coming from multiple SG centers and they take the protein sequence as their only input. The underlying principle is that the predictive models summarize/describe patterns (similarities) hidden in the data from databases such as TargetDB. This is done by generating a set of patterns that describe sequences that can be crystallized (crystallizable proteins) and another set of patterns for sequences that were shown to be im- possible to crystallize (noncrystallizable proteins). The two sets of patterns should describe the two correspond- ing sets of protein chain and, at the same time, each of them should exclude sequences from the other set. The existing crystallization propensity predictors include SECRET [64] that was developed by Frishman’s group, OB-Score [65] and ParCrys [66] that were produced by the Barton’s group, XtalPred [67, 68] that came from Godzik’s group, and CRYSTALP [69] and most recent CRYSTALP2 [70] that were developed by Kurgan’s group. These methods perform the prediction in two steps: (1) the input sequence is converted into a set of numerical features that describe certain characteristics of the sequence; and (2) the feature values are fed into a predictive model that outputs the outcome that quantifies propensity for crystallization. The predictive model en- capsulates the patterns that are computed from the in- formation encoded by the features. Table 1 shows a  L. Kurgan et al. / Natural Science 1 (2009) 93-106 Copyright © 2009 SciRes. OPEN ACCESS 97 97 Table 1. A side-by-side comparison of existing methods for sequence-based protein crystallization propensity prediction. Input features Methods [reference] Source of data description # Predictive model Web server/page Notes SECRET [64] Deposition from PDB assuming that NMR only solved protein are diffi- cult/impossibl e to crystal- lize; Deposi- tions in Tar- getDB Content of mono-, di-, and tripeptides represented by 20-letter amino acid alphabet and by several reduced alphabets grouped by physicochemical and structural prop- erties of amino acids 103 Two-layered structure where output of sev- eral support vector machine classifiers are combined by a second-level Naive Bayes classifier http://mips.helmholtz-muenchen.de/secret/ Limited to se- quences between 46 and 200 amino acids OB-Score [65] Depositions in TargetDB Isoelectric point and average hydro- phobicity 2 Z-score (two-dimen- sional lookup-table) http://www.compbio.dundee.ac.uk/xtal/ CRYS- TALP [69] Deposition from PDB assuming that NMR only solved protein are diffi- cult/impossibl e to crystal- lize; Content of selected mono-, di- and collocated dipep- tides 46 Naive Bayes N/A Limited to se- quences between 46 and 200 amino acids XtalPred [67, 68] Depositions in TargetDB Protein length, molecular mass, gravy and instabil- ity indices, extinc- tion coefficient, isoelectric point, content of Cys, Met, Trp, Tyr, and Phe residues, inser- tions in the align- ment compared to homologs in non-redundant protein sequences database, predicted secondary structure, predicted disor- dered, low-complexity and coiled-coil regions, predicted trans- membrane helices and signal peptides. 9 Normalized product http://ffas.burnham.org/XtalPred/ Outputs 1 of 5 crystal- lization classes: optimal, subopti- mal, average, difficult, and very difficult ParCrys [66] Depositions in TargetDB and PepcDB Isoelectric point and average hydro- phobicity, content of Ser, Cys, Gly, Phe, Tyr, and Met residues 8 Kernel-based classifier using Parzen window http://www.compbio.dundee.ac.uk/xtal/ CRYS- TALP2 [70] Depositions in TargetDB and PepcDB Isoelectric point, average hydropho- bicity, content of selected mono-, di- and collocated di- and tripeptides 88 Normalized Gaussian radial basis function network http://biomine.ece.ualberta.ca/CRYSTALP2/CRYSTALP2.html  L. Kurgan et al. / Natural Science 1 (2009) 93-106 Copyright © 2009 SciRes. OPEN ACCESS 98 side-by-side comparison of the six existing methods based on the data source that was used to generate pre- dictive model and the applied input features and predic- tive models. It also provides URLs of the corresponding web servers or web pages. Two early methods, namely SECRET and CRYSTALP, accept only sequences between 46 and 200 amino acids in length. This limitation is due to the composition of datasets used to generate these prediction models. Al- though OB-Score predictor does not impose a limit on sequence size, it considers only two predictive features, i.e., isoelectric point and hydrophobicity. This method was developed for the Scottish Structural Proteomics Facility [65]. The ParCrys method extends OB-score by using an advanced kernel-based classification algorithm and by adding information concerning content of several amino acids including Ser, Cys, Gly, Phe, Tyr, and Met to the set of predictive features. Similarly, CRYSTALP2 improves upon CRYSTALP by applying a more ad- vanced kernel-based classifier and by introducing new predictive features that are based on the collocation of amino acids in the sequence, isoelectric point and hy- drophobicity. The motivation for the application of the collocation based features comes from their applications in related fields [71-74] and the fact that they consider local neighbourhood information in the protein chain, which was also utilized in a recent method for surface entropy reduction based design of crystallizable protein variants [55]. A significant majority of the collocations used by CRYSTALP2 incorporate residues with high conformational entropy, or with low entropy and high potential to mediate crystal contacts, and these residues are utilized by the surface entropy reduction methods [51, 52]. The above five methods are built using black-box (not readable by a human) classification models, which are inductively learned from a set of protein chains which are annotated as crystallizable and noncrystallizable. By contrast, the XtalPred is a white-box (human readable) approach that combines probabilities of successful crys- tallization calculated from several protein features. This method, which was developed based on experiences at the Joint Center for Structural Genomics, which is one of the large centers in the Protein Structure Initiative, mim- ics the work performed by structural biologists. XtalPred utilizes nine biochemical and biophysical features of an input protein with probability distributions estimated from data from TargetDB. The individual probabilities concerning each input feature are combined into a single crystallization score which is used to assign one of five crystallization classes: optimal, suboptimal, average, difficult, and very difficult. The design of XtalPred shows that medium sequence length and hydrophobicity combined with acidic character improve the success in protein production. It also demonstrates that very short, very long, or very hydrophobic proteins are more diffi- cult to crystallize under standard experimental setups. This method also confirms the utility of predicted struc- tural disorder, presence of transmembrane helices, insta- bility, and high content of predicted loops, insertions, and coiled-coil structures for the prediction of the crys- tallization propensity [67]. Several methods, including XtalPred, OB-Score, ParCrys and CRYSTALP2, utilize information concerning isoelectric point which is esti- mated from protein sequence. This agrees with prior finding that indicate important role of this feature [46-48]. We note that all investigated crystallization propensity predictors take into account only intra-molecular factors that are encoded in the protein chain. This means that they may not provide reliable predictions when in- ter-molecular factors such as protein-protein and/or pro- tein-precipitant interactions, buffer composition, pre- cipitant diffusion method, etc. must be considered. Also, they are limited to predictions for non-redundant chains and should not be used when assessing crystallization of homologues. In the latter case we recommend the use of the surface entropy reduction server [55]. 3. COMPARATIVE ANALYSIS Following we perform empirical comparison of the qual- ity of predictions offered by the sequence-based protein crystallization propensity predictors. Our analysis ex- cludes CRYSTALP and SECRET methods since they are limited to only relatively small chains and since their quality was show to be inferior when compared with other methods [66,70]. Our comparative analysis is per- formed based on predictions performed for a dataset of relatively recent depositions to TargetDB and PepcDB. We analyze predictive power of individual methods and we also investigate their complementarity. 3.1. Dataset We use a dataset composed of 2000 protein chains (hereafter TEST-NEW), which was originally introduced in [70] and which was developed using procedure pro- posed in [66]. The crystallizable proteins were extracted from sequences deposited in TargetDB and they include the last 1000 depositions as of December 2008. The non- crystallizable sequences, which correspond to the actual construct sequences used, were extracted from the trial sequences stored in PepcDB. As in the case of crystal- lizable chains, they include the last 1000 depositions as of December, 2008. The selected sequences were also processed to remove the N-terminal hexaHis tag and LEHHHHHH tag at the C-terminus, which are intro- duced to ease the purification. Duplicate sequences were removed and thus the resulting dataset consists of non- redundant chains. It can be freely downloaded from  L. Kurgan et al. / Natural Science 1 (2009) 93-106 Copyright © 2009 SciRes. OPEN ACCESS 99 99 Table 2. Summary of results for predictions performed with OB-Score, ParCrys, XtalPred and CRYSTALP2 methods on the TEST-NEW dataset. Accuracy MCC TPR TNR AROC OB-Score1 69.8 0.42 0.86 0.54 0.74 ParCrys1 70.6 0.43 0.83 0.58 0.75 XtalPred2 70.0 0.40 0.76 0.64 0.76 CRYSTALP23 69.3 0.39 0.76 0.63 0.74 1Results computed using the ParCrys/OB-Score server at http://www.compbio.dundee.ac.uk/xtal/ 2Results computed using the XtalPred server at http://ffas.burnham.org/XtalPred/ 3Results based on [70] http://biomine.ece.ualberta.ca/CRYSTALP2/CRYSTALP2.html. 3.2. Quality Measures The annotations from TargetDB were stripped from the input sequences, which in turn were inputted into the corresponding predictors. The prediction outputs were compared with the original annotations to assess the prediction quality. Four potential prediction outcomes are possible: TP (true positive) which corresponds to crystallizable chains that were correctly predicted as crystallizable, FN (false negative) which corresponds to crystallizable chains that were incorrectly predicted as noncrystallizable, FP (false positive) which indicates that noncrystallizable chains were incorrectly predicted as crystallizable, and TN (true negative) which denotes cases where noncrystallizable chains were correctly pre- dicted as noncrystallizable. The predictions were as- sessed based on the following quality indices: 100 T T TNTP accuracy )()()()( FNTNFPTNFNTPFPTP FNFPTNTP MCC T TP TPR T TN TNR The accuracy measures the fraction of correct predic- tions among all predictions. The Matthews Correlation Coefficient (MCC) is confined to <-1,1> interval. If the MCC value is close to 0 then the prediction method is not better than a random classification. Higher MCC value corresponds to better performance of the predic- tion method. These two measures provide an evaluation of the prediction quality over the entire dataset. In con- trast, TPR (true positive rate) and TNR (true negative rate) evaluate the quality separately for crystallizable (positive) and noncrystallizable (negative) proteins. TPR/TNR quantifies the fraction of correctly predicted crystallizable/noncrystallizable proteins. We also report receiver-operator characteristics (ROC) curves that pre- sent a graphical plot of the TP rate = TP / (TP + FN) against FP rate = FP / (FP + TN). This is performed by thresholding the confidence values (probabilities) that are generated together with the predicted classes (crys- tallizable vs. noncrystallizable). These plots are also used to compute the area under the ROC curve (AROC). The higher the AROC value is the better the predictive power of the corresponding method. 3.3. Comparison of Existing Prediction Methods Results of application of the four crystallization propen- sity predictors on the TEST-NEW dataset are summa- rized in Table 2. In the case of XtalPred we assume a prediction assignment in which optimal, suboptimal, and average outcomes are categorized as crystallizable pro- teins and difficult and very difficult as noncrystallizable. The same assignment was used in [70] since it leads to optimal results. The comparison shows that the four methods are char- acterized by relatively similar prediction quality with MCC and accuracy values ranging between 0.39 and 0.43 and between 69.3 and 70.6%, respectively. We note that since the dataset is balanced a random assignment of the prediction outcomes would give accuracy of 50%. This means that the accuracy of the existing methods is better by about 20% than the random coin-toss approach. At the same time we observe a considerable space for improvement although we caution the reader that the upper limit of the prediction accuracy should not be as- sumed at 100%. This is since the input data likely in- cludes mislabeled proteins. In particular, since data comes from multiple SG centers, some proteins that could not be crystallized in one center could be poten- tially crystallized by another center that uses different protocols and equipment. This means that some of the proteins could be mislabeled as noncrystallizable, i.e., some of the FPs are in fact TPs. At this time we are not able to estimate their number. We observe that OB-Score and ParCrys are both strongly biased towards prediction of crystallizable proteins, i.e., their TPR values are much higher than TNR values and the TNR values are rela- tively low. The XtalPred and CRYSTALP2 provide a  L. Kurgan et al. / Natural Science 1 (2009) 93-106 Copyright © 2009 SciRes. OPEN ACCESS 100 more balanced prediction for the two classes of proteins and their TNR values are above 0.63. All four methods provide better predictions for crystallizable proteins, i.e., they correctly predict a bigger fraction of crystallizable proteins, when compared with the noncrystallizable pro- teins. In other words, they are more likely to succeed in confirming that a crystallizable chain can be crystallized rather than in showing that a chain difficult to crystallize cannot be crystallized; although in both cases all of the considered methods work better than the coin-toss. Fig- ure 2 shows the ROC curves for the four predictors. We again observe that all considered methods behave simi- larly, i.e., they provide comparable TP rates for the same FP rates. 0 0.1 0.2 0.3 0.4 0.5 0.6 0.7 0.8 0.9 1 00.10.2 0.30.4 0.5 0.60.7 0.80.91 FP rate TP rate CRYSTALP2 on TEST-NEW ParCrys on TEST-NEW XtalPred on TEST-NEW OB-Score on TEST-NEW Figure 2. ROC curves for the tests performed with OB-Score, ParCrys, XtalPred and CRYS- TALP2 methods on the TEST-NEW dataset. 0% 10% 20% 30% 40% 50% 60% 70% 80% 90% 100% all proteinsnoncrystallizable pr oteins crystallizable proteins dataset percentage of predictions no correct predictions 1 method with correct prediction 2 methods with correct predictions 3 methods with correct predictions All 4 methods with correct predictions Figure 3. Analysis of the number of correct predictions produced by OB-Score, ParCrys, XtalPred and CRYSTALP2 methods on the all proteins, only crystallizable and only noncrystallizable proteins from the TEST-NEW dataset. 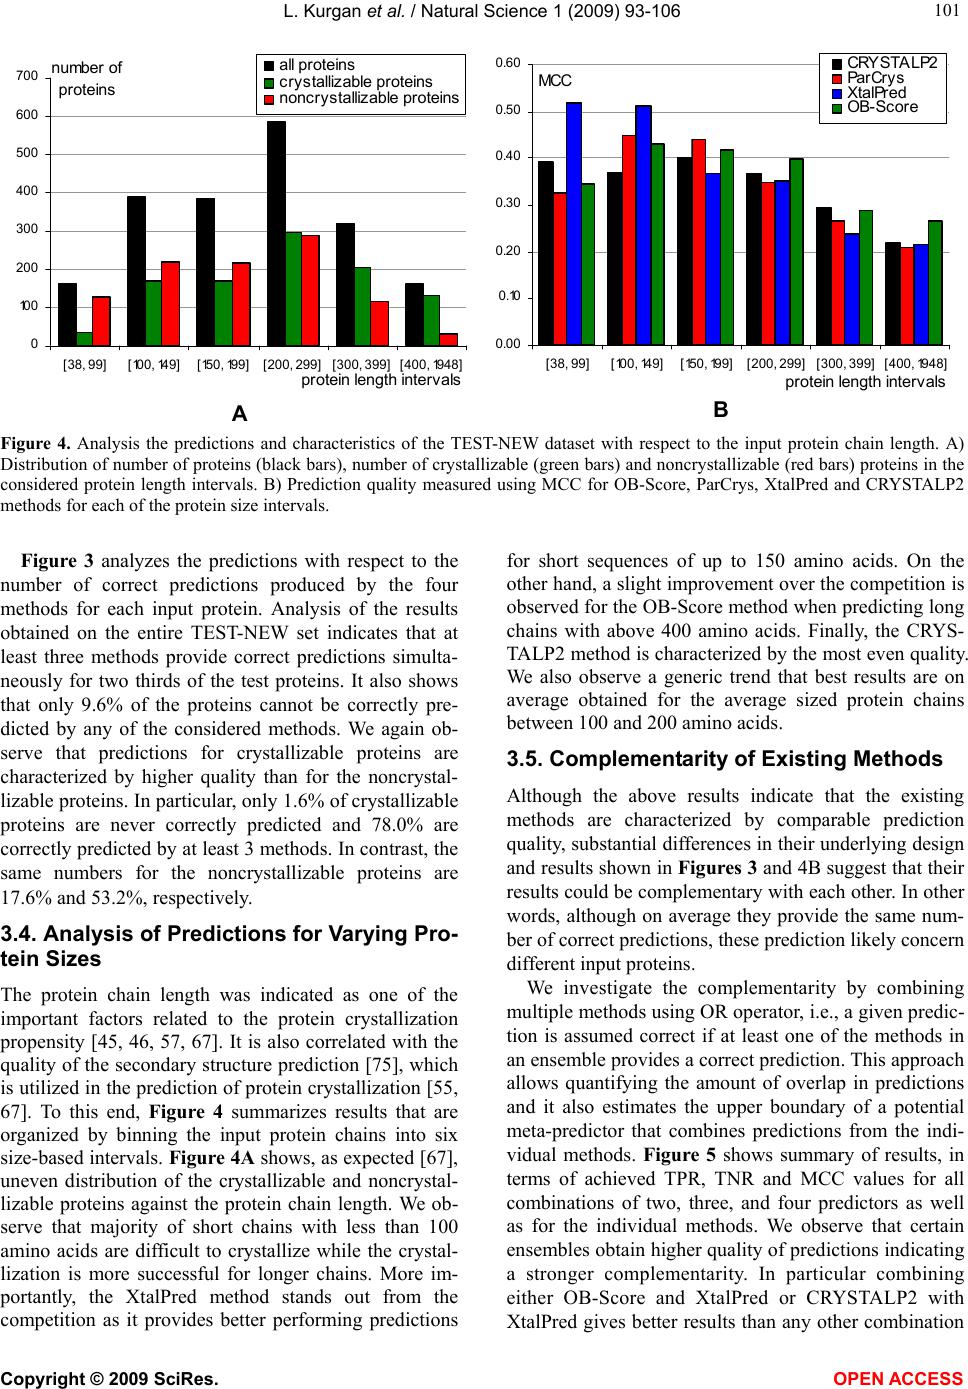 L. Kurgan et al. / Natural Science 1 (2009) 93-106 Copyright © 2009 SciRes. OPEN ACCESS 101 101 0 10 0 200 300 400 500 600 700 [38, 99][100, 149][150, 199][200, 299][300, 399][400, 1948] protein length intervals number of pr oteins all proteins crystallizable proteins noncrystallizable proteins A 0.00 0.10 0.20 0.30 0.40 0.50 0.60 [38, 99][100, 149][150, 199][200, 299][300, 399][400, 1948] protein length intervals MCC CRY STA LP2 ParCrys XtalPred OB-Score B Figure 4. Analysis the predictions and characteristics of the TEST-NEW dataset with respect to the input protein chain length. A) Distribution of number of proteins (black bars), number of crystallizable (green bars) and noncrystallizable (red bars) proteins in the considered protein length intervals. B) Prediction quality measured using MCC for OB-Score, ParCrys, XtalPred and CRYSTALP2 methods for each of the protein size intervals. Figure 3 analyzes the predictions with respect to the number of correct predictions produced by the four methods for each input protein. Analysis of the results obtained on the entire TEST-NEW set indicates that at least three methods provide correct predictions simulta- neously for two thirds of the test proteins. It also shows that only 9.6% of the proteins cannot be correctly pre- dicted by any of the considered methods. We again ob- serve that predictions for crystallizable proteins are characterized by higher quality than for the noncrystal- lizable proteins. In particular, only 1.6% of crystallizable proteins are never correctly predicted and 78.0% are correctly predicted by at least 3 methods. In contrast, the same numbers for the noncrystallizable proteins are 17.6% and 53.2%, respectively. 3.4. Analysis of Predictions for Varying Pro- tein Sizes The protein chain length was indicated as one of the important factors related to the protein crystallization propensity [45, 46, 57, 67]. It is also correlated with the quality of the secondary structure prediction [75], which is utilized in the prediction of protein crystallization [55, 67]. To this end, Figure 4 summarizes results that are organized by binning the input protein chains into six size-based intervals. Figure 4A shows, as expected [67], uneven distribution of the crystallizable and noncrystal- lizable proteins against the protein chain length. We ob- serve that majority of short chains with less than 100 amino acids are difficult to crystallize while the crystal- lization is more successful for longer chains. More im- portantly, the XtalPred method stands out from the competition as it provides better performing predictions for short sequences of up to 150 amino acids. On the other hand, a slight improvement over the competition is observed for the OB-Score method when predicting long chains with above 400 amino acids. Finally, the CRYS- TALP2 method is characterized by the most even quality. We also observe a generic trend that best results are on average obtained for the average sized protein chains between 100 and 200 amino acids. 3.5. Complementarity of Existing Methods Although the above results indicate that the existing methods are characterized by comparable prediction quality, substantial differences in their underlying design and results shown in Figures 3 and 4B suggest that their results could be complementary with each other. In other words, although on average they provide the same num- ber of correct predictions, these prediction likely concern different input proteins. We investigate the complementarity by combining multiple methods using OR operator, i.e., a given predic- tion is assumed correct if at least one of the methods in an ensemble provides a correct prediction. This approach allows quantifying the amount of overlap in predictions and it also estimates the upper boundary of a potential meta-predictor that combines predictions from the indi- vidual methods. Figure 5 shows summary of results, in terms of achieved TPR, TNR and MCC values for all combinations of two, three, and four predictors as well as for the individual methods. We observe that certain ensembles obtain higher quality of predictions indicating a stronger complementarity. In particular combining either OB-Score and XtalPred or CRYSTALP2 with XtalPred gives better results than any other combination 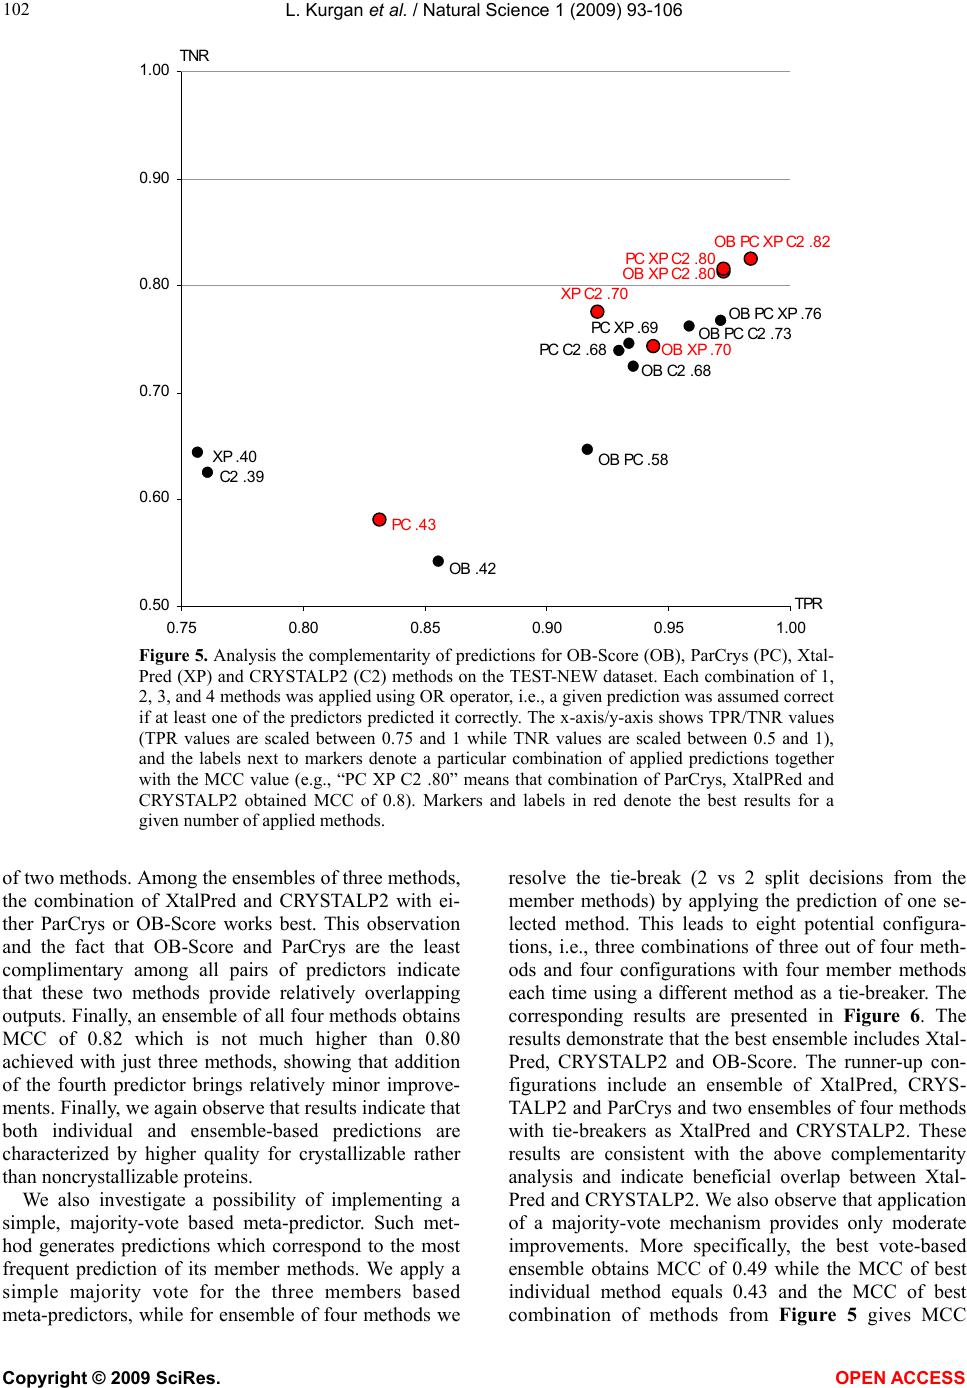 L. Kurgan et al. / Natural Science 1 (2009) 93-106 Copyright © 2009 SciRes. OPEN ACCESS 102 OB PC XP C2 .82 OB PC XP .76 OB XP C2 .80 PC XP C2 .80 OB PC C2 .73 PC C2 .68 OB C2 .68 XP C2 .70 OB PC .58 PC XP .69 OB XP .70 OB .42 PC .43 XP .40 C2 .39 0.50 0.60 0.70 0.80 0.90 1.00 0.75 0.80 0.85 0.90 0.95 1.00 TPR TNR Figure 5. Analysis the complementarity of predictions for OB-Score (OB), ParCrys (PC), Xtal- Pred (XP) and CRYSTALP2 (C2) methods on the TEST-NEW dataset. Each combination of 1, 2, 3, and 4 methods was applied using OR operator, i.e., a given prediction was assumed correct if at least one of the predictors predicted it correctly. The x-axis/y-axis shows TPR/TNR values (TPR values are scaled between 0.75 and 1 while TNR values are scaled between 0.5 and 1), and the labels next to markers denote a particular combination of applied predictions together with the MCC value (e.g., “PC XP C2 .80” means that combination of ParCrys, XtalPRed and CRYSTALP2 obtained MCC of 0.8). Markers and labels in red denote the best results for a given number of applied methods. of two methods. Among the ensembles of three methods, the combination of XtalPred and CRYSTALP2 with ei- ther ParCrys or OB-Score works best. This observation and the fact that OB-Score and ParCrys are the least complimentary among all pairs of predictors indicate that these two methods provide relatively overlapping outputs. Finally, an ensemble of all four methods obtains MCC of 0.82 which is not much higher than 0.80 achieved with just three methods, showing that addition of the fourth predictor brings relatively minor improve- ments. Finally, we again observe that results indicate that both individual and ensemble-based predictions are characterized by higher quality for crystallizable rather than noncrystallizable proteins. We also investigate a possibility of implementing a simple, majority-vote based meta-predictor. Such met- hod generates predictions which correspond to the most frequent prediction of its member methods. We apply a simple majority vote for the three members based meta-predictors, while for ensemble of four methods we resolve the tie-break (2 vs 2 split decisions from the member methods) by applying the prediction of one se- lected method. This leads to eight potential configura- tions, i.e., three combinations of three out of four meth- ods and four configurations with four member methods each time using a different method as a tie-breaker. The corresponding results are presented in Figure 6. The results demonstrate that the best ensemble includes Xtal- Pred, CRYSTALP2 and OB-Score. The runner-up con- figurations include an ensemble of XtalPred, CRYS- TALP2 and ParCrys and two ensembles of four methods with tie-breakers as XtalPred and CRYSTALP2. These results are consistent with the above complementarity analysis and indicate beneficial overlap between Xtal- Pred and CRYSTALP2. We also observe that application of a majority-vote mechanism provides only moderate improvements. More specifically, the best vote-based ensemble obtains MCC of 0.49 while the MCC of best individual method equals 0.43 and the MCC of best combination of methods from Figure 5 gives MCC 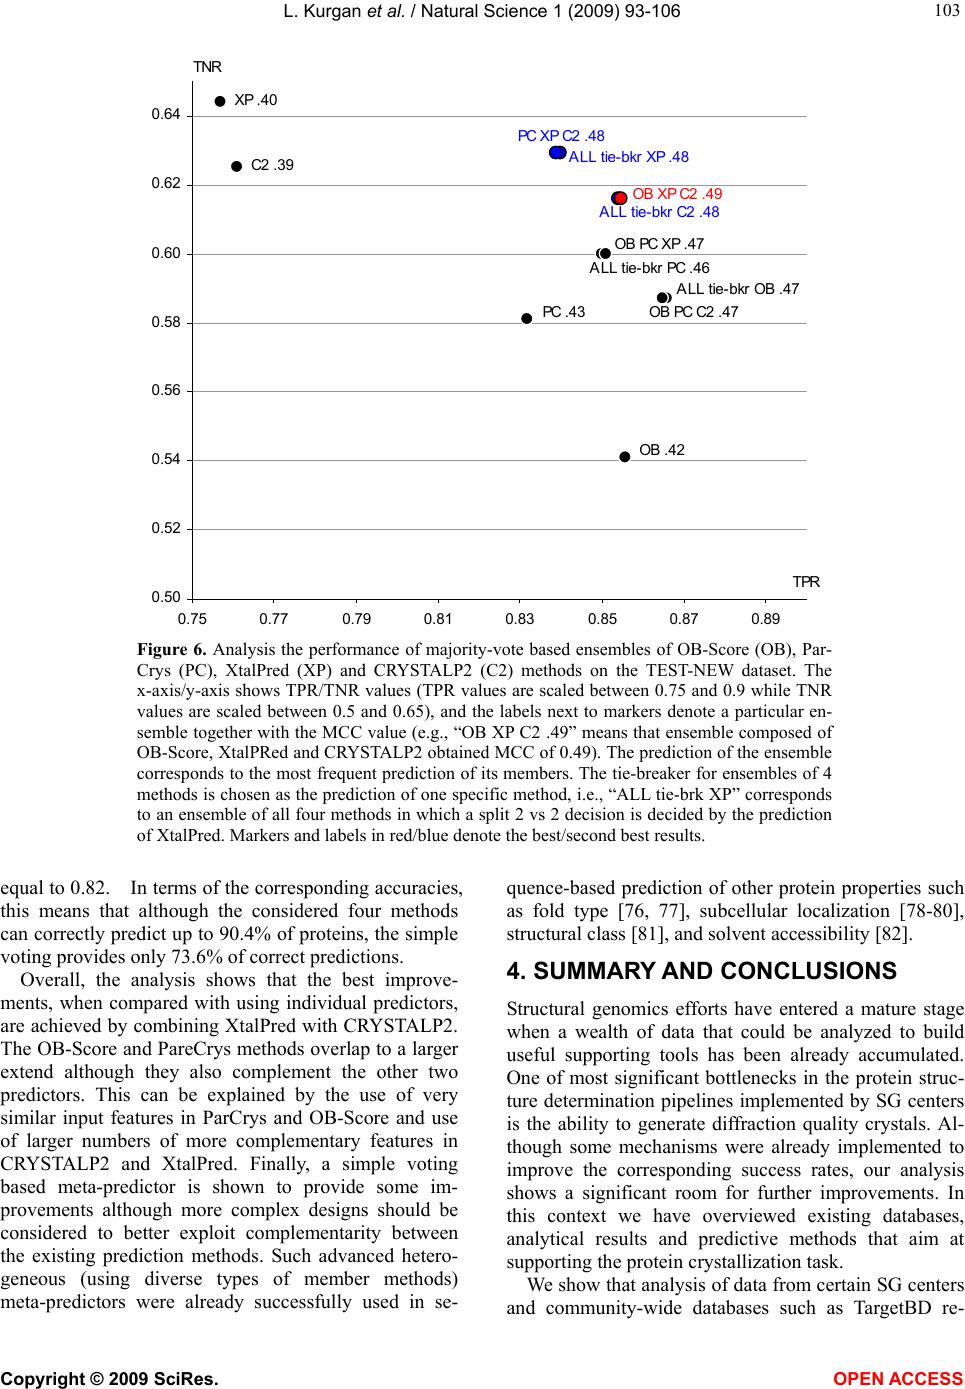 L. Kurgan et al. / Natural Science 1 (2009) 93-106 Copyright © 2009 SciRes. OPEN ACCESS 103 103 XP .40 C2 .39 ALL tie-bkr OB .47 ALL tie-bkr PC .46 ALL tie-bkr XP .48 ALL tie-bkr C2 .48 PC XP C2 .48 OB PC XP .47 OB PC C2 .47 OB XP C2 .49 OB .42 PC .43 0.50 0.52 0.54 0.56 0.58 0.60 0.62 0.64 0.75 0.770.79 0.81 0.830.85 0.87 0.89 TPR TNR Figure 6. Analysis the performance of majority-vote based ensembles of OB-Score (OB), Par- Crys (PC), XtalPred (XP) and CRYSTALP2 (C2) methods on the TEST-NEW dataset. The x-axis/y-axis shows TPR/TNR values (TPR values are scaled between 0.75 and 0.9 while TNR values are scaled between 0.5 and 0.65), and the labels next to markers denote a particular en- semble together with the MCC value (e.g., “OB XP C2 .49” means that ensemble composed of OB-Score, XtalPRed and CRYSTALP2 obtained MCC of 0.49). The prediction of the ensemble corresponds to the most frequent prediction of its members. The tie-breaker for ensembles of 4 methods is chosen as the prediction of one specific method, i.e., “ALL tie-brk XP” corresponds to an ensemble of all four methods in which a split 2 vs 2 decision is decided by the prediction of XtalPred. Markers and labels in red/blue denote the best/second best results. equal to 0.82. In terms of the corresponding accuracies, this means that although the considered four methods can correctly predict up to 90.4% of proteins, the simple voting provides only 73.6% of correct predictions. Overall, the analysis shows that the best improve- ments, when compared with using individual predictors, are achieved by combining XtalPred with CRYSTALP2. The OB-Score and PareCrys methods overlap to a larger extend although they also complement the other two predictors. This can be explained by the use of very similar input features in ParCrys and OB-Score and use of larger numbers of more complementary features in CRYSTALP2 and XtalPred. Finally, a simple voting based meta-predictor is shown to provide some im- provements although more complex designs should be considered to better exploit complementarity between the existing prediction methods. Such advanced hetero- geneous (using diverse types of member methods) meta-predictors were already successfully used in se- quence-based prediction of other protein properties such as fold type [76, 77], subcellular localization [78-80], structural class [81], and solvent accessibility [82]. 4. SUMMARY AND CONCLUSIONS Structural genomics efforts have entered a mature stage when a wealth of data that could be analyzed to build useful supporting tools has been already accumulated. One of most significant bottlenecks in the protein struc- ture determination pipelines implemented by SG centers is the ability to generate diffraction quality crystals. Al- though some mechanisms were already implemented to improve the corresponding success rates, our analysis shows a significant room for further improvements. In this context we have overviewed existing databases, analytical results and predictive methods that aim at supporting the protein crystallization task. We show that analysis of data from certain SG centers and community-wide databases such as TargetBD re-  L. Kurgan et al. / Natural Science 1 (2009) 93-106 Copyright © 2009 SciRes. OPEN ACCESS 104 vealed that certain factors, such as protein size, isoelec- tric point, disorder regions, presence of transmembrane helices, etc. were found to correlate with the ability to produce quality protein crystals. We also contrasted and compared several modern sequence-based predictors of crystallization propensity including OB-Score, ParCrys, XtalPred and CRYSTALP2. We demonstrate that these methods provide useful predictions which are comple- mentary to each other. Although their average success rate is similar and at about 70%, we show that usage of a simple majority-vote based combination of these meth- ods can improve the success rate to almost 74%. Our work also reveals that close to 90% of the protein chains can be correctly predicted by at least one of these meth- ods, which motivates development of more advanced meta-predictors. The best predictions for short, under 100 amino acids, chains are produced by XtalPred and the most accurate predictions, on average, are generated for medium-sized chains of 100 to 200 amino acids. We believe that these crystallization propensity predictors could provide useful input for current SG efforts that could be incorporated into the target selection procedure. REFERENCES [1] Guido, R.V., Oliva, G. and Andricopulo, A.D. (2008) Virtual screening and its integration with modern drug design technologies. Current Medicinal Chemistry, 15(1), 37-46. [2] Norin, M. and Sundström, M. (2001) Protein models in drug discovery. Current Opinion in Drug Discovery & Development, 4, 284-290. [3] Klebe, G. (2000) Recent developments in structure-based drug design. Journal of Molecular Medicine, 78(5), 269-281. [4] Fernàndez-Busquets, X., de Groot, N.S., Fernandez, D. and Ventura, S. (2008) Recent structural and computa- tional insights into conformational diseases. Current Me- dicinal Chemistry, 15, 1336-1349. [5] Luscombe, N.M., Laskowski, R.A. and Thornton, J.M. (2001) Amino acid-base interactions: a three-dimensional analysis of protein-DNA interactions at an atomic level. Nucleic Acids Research, 29, 2860-2874. [6] Ellis, J.J., Broom, M. and Jones, S. (2007) Protein-RNA interactions: structural analysis and functional classes. Proteins, 66, 903-911. [7] Chen, K. and Kurgan, L. (2009) Investigation of atomic level patterns in protein - small ligand interactions. PLoS ONE, 4(2), e4473. [8] Pruitt, K.D., Tatusova, T. and Maglott, D.R. (2007) NCBI Reference Sequence (RefSeq): a curated non-redundant sequence database of genomes, transcripts and proteins. Nucleic Acids Research, 35(Database issue), D61-65. [9] Berman, H.M., Westbrook, J., Feng, Z., Gilliland, G., Bhat, T.N., Weissig, H., Shindyalov, I.N., Bourne, P.E. (2000) The Protein Data Bank. Nucleic Acids Research, 28, 235-242. [10] Brenner, S.E. (2001) A tour of structural genomics. Na- ture Reviews Genetics, 2(10), 801-809. [11] Chandonia, J.M. and Brenner, S.E. (2006) The impact of structural genomics: expectations and outcomes. Science, 311, 347-351. [12] Service, R.F. (2008) Protein Structure Initiative: Phase 3 or Phase Out. Science, 319(5870), 1610-1613. [13] Terwilliger, T.C., Waldo, G., Peat, T.S., Newman, J.M., Chu, K. and Berendzen, J. (1998) Class-directed struc- ture determination: Foundation for a protein structure initiative. Protein Science, 7(9), 1851-1856. [14] Brenner, S.E. (2000) Target selection for structural ge- nomics. Nature Structural Biology, 7, 967-969. [15] Dessailly, B.H., Nair, R., Jaroszewski, L., Fajardo, J.E., Kouranov, A., Lee, D., Fiser, A., Godzik, A., Rost, B. and Orengo, C. (2009) PSI-2: structural genomics to cover protein domain family space. Structure, 17(6), 869-881. [16] Ilari, A. and Savino, C. (2008) Protein structure determi- nation by x-ray crystallography. Methods in Molecular Biology, 452, 63-87. [17] Wishart, D. (2005) NMR spectroscopy and protein structure determination: applications to drug discovery and development. Current Pharmaceutical Biotechnol- ogy, 6(2), 105-120. [18] Hite, R.K., Raunser, S. and Walz, T. (2007) Revival of electron crystallography. Current Opinion in Structural Biology, 17(4), 389-395. [19] Fischer, D. (2006) Servers for protein structure prediction. Current Opinion in Structural Biology, 16(2), 178-182. [20] Xiang, Z. (2006) Advances in homology protein structure modeling. Current Protein & Peptide Science, 7(3), 217-227. [21] Lacapère, J.J., Pebay-Peyroula, E., Neumann, J.M. and Etchebest, C. (2007) Determining membrane protein structures: still a challenge! Trends in Biochemical Sci- ences, 32(6), 259-270. [22] Schnell, J.R. and Chou, J.J. (2008) Structure and mecha- nism of the M2 proton channel of influenza A virus. Na- ture, 451, 591-595. [23] Service, R. (2005) Structural genomics, round 2. Science, 307, 1554-1558. [24] Chen, L., Oughtred, R., Berman, H.M. and Westbrook, J. (2004) TargetDB: a target registration database for struc- tural genomics projects. Bioinformatics, 20(16), 2860-2862. [25] Slabinski, L., Jaroszewski, L., Rychlewski, L., Wilson, I.A., Lesley, S.A. and Godzik, A. (2007) XtalPred: a web server for prediction of protein crystallizability. Bioin- formatics, 23(24), 3403-3405. [26] Hui, R. and Edwards, A. (2003) High-throughput protein crystallization. Journal of Structural Biology, 142, 154-161. [27] Savchenko, A., Yee, A., Khachatryan, A., Skarina, T., Evdokimova, E., Pavlova, M., Semesi, A., Northey, J., Beasley, S., Lan, N., Das, R., Gerstein, M., Arrowmith, C.H. and Edwards, A.M. (2003) Strategies for structural proteomics of prokaryotes: quantifying the advantages of studying orthologous proteins and of using both NMR and x-ray crystallography approaches. Proteins, 50, 392-399. [28] Chandonia, J.M. and Brenner, S.E. (2005) Implications of structural genomics target selection strategies: 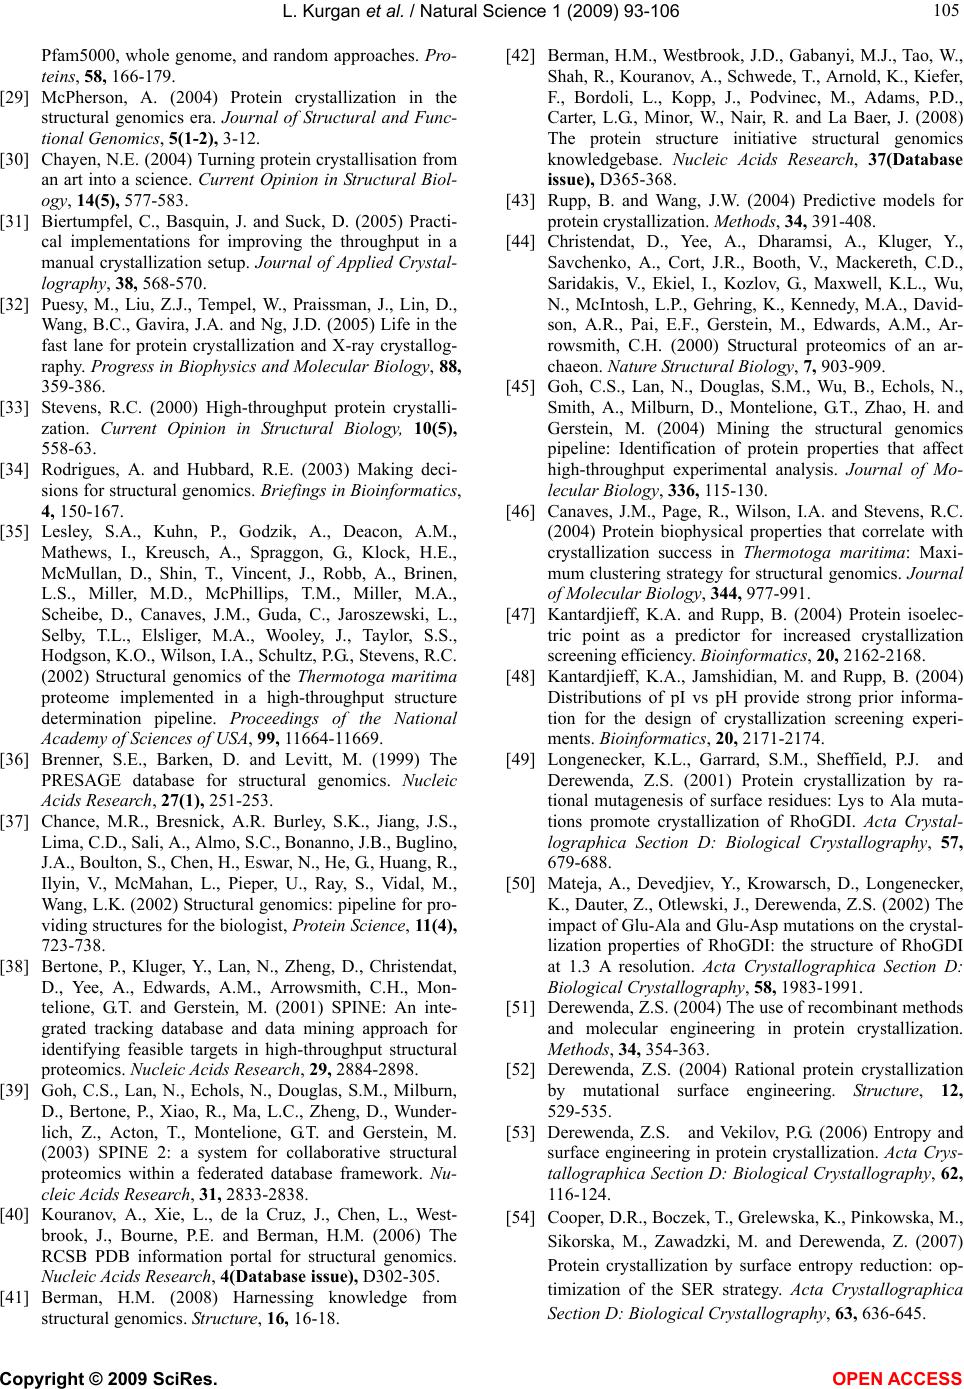 L. Kurgan et al. / Natural Science 1 (2009) 93-106 Copyright © 2009 SciRes. OPEN ACCESS 105 105 Pfam5000, whole genome, and random approaches. Pro- teins, 58, 166-179. [29] McPherson, A. (2004) Protein crystallization in the structural genomics era. Journal of Structural and Func- tional Genomics, 5(1-2), 3-12. [30] Chayen, N.E. (2004) Turning protein crystallisation from an art into a science. Current Opinion in Structural Biol- ogy, 14(5), 577-583. [31] Biertumpfel, C., Basquin, J. and Suck, D. (2005) Practi- cal implementations for improving the throughput in a manual crystallization setup. Journal of Applied Crystal- lography, 38, 568-570. [32] Puesy, M., Liu, Z.J., Tempel, W., Praissman, J., Lin, D., Wang, B.C., Gavira, J.A. and Ng, J.D. (2005) Life in the fast lane for protein crystallization and X-ray crystallog- raphy. Progress in Biophysics and Molecular Biology, 88, 359-386. [33] Stevens, R.C. (2000) High-throughput protein crystalli- zation. Current Opinion in Structural Biology, 10(5), 558-63. [34] Rodrigues, A. and Hubbard, R.E. (2003) Making deci- sions for structural genomics. Briefings in Bioinformatics, 4, 150-167. [35] Lesley, S.A., Kuhn, P., Godzik, A., Deacon, A.M., Mathews, I., Kreusch, A., Spraggon, G., Klock, H.E., McMullan, D., Shin, T., Vincent, J., Robb, A., Brinen, L.S., Miller, M.D., McPhillips, T.M., Miller, M.A., Scheibe, D., Canaves, J.M., Guda, C., Jaroszewski, L., Selby, T.L., Elsliger, M.A., Wooley, J., Taylor, S.S., Hodgson, K.O., Wilson, I.A., Schultz, P.G., Stevens, R.C. (2002) Structural genomics of the Thermotoga maritima proteome implemented in a high-throughput structure determination pipeline. Proceedings of the National Academy of Sciences of USA, 99, 11664-11669. [36] Brenner, S.E., Barken, D. and Levitt, M. (1999) The PRESAGE database for structural genomics. Nucleic Acids Research, 27(1), 251-253. [37] Chance, M.R., Bresnick, A.R. Burley, S.K., Jiang, J.S., Lima, C.D., Sali, A., Almo, S.C., Bonanno, J.B., Buglino, J.A., Boulton, S., Chen, H., Eswar, N., He, G., Huang, R., Ilyin, V., McMahan, L., Pieper, U., Ray, S., Vidal, M., Wang, L.K. (2002) Structural genomics: pipeline for pro- viding structures for the biologist, Protein Science, 11(4) , 723-738. [38] Bertone, P., Kluger, Y., Lan, N., Zheng, D., Christendat, D., Yee, A., Edwards, A.M., Arrowsmith, C.H., Mon- telione, G.T. and Gerstein, M. (2001) SPINE: An inte- grated tracking database and data mining approach for identifying feasible targets in high-throughput structural proteomics. Nucleic Acids Research, 29, 2884-2898. [39] Goh, C.S., Lan, N., Echols, N., Douglas, S.M., Milburn, D., Bertone, P., Xiao, R., Ma, L.C., Zheng, D., Wunder- lich, Z., Acton, T., Montelione, G.T. and Gerstein, M. (2003) SPINE 2: a system for collaborative structural proteomics within a federated database framework. Nu- cleic Acids Research, 31, 2833-2838. [40] Kouranov, A., Xie, L., de la Cruz, J., Chen, L., West- brook, J., Bourne, P.E. and Berman, H.M. (2006) The RCSB PDB information portal for structural genomics. Nucleic Acids Research, 4(Database issue), D302-305. [41] Berman, H.M. (2008) Harnessing knowledge from structural genomics. Structure, 16, 16-18. [42] Berman, H.M., Westbrook, J.D., Gabanyi, M.J., Tao, W., Shah, R., Kouranov, A., Schwede, T., Arnold, K., Kiefer, F., Bordoli, L., Kopp, J., Podvinec, M., Adams, P.D., Carter, L.G., Minor, W., Nair, R. and La Baer, J. (2008) The protein structure initiative structural genomics knowledgebase. Nucleic Acids Research, 37(Database issue), D365-368. [43] Rupp, B. and Wang, J.W. (2004) Predictive models for protein crystallization. Methods, 34, 391-408. [44] Christendat, D., Yee, A., Dharamsi, A., Kluger, Y., Savchenko, A., Cort, J.R., Booth, V., Mackereth, C.D., Saridakis, V., Ekiel, I., Kozlov, G., Maxwell, K.L., Wu, N., McIntosh, L.P., Gehring, K., Kennedy, M.A., David- son, A.R., Pai, E.F., Gerstein, M., Edwards, A.M., Ar- rowsmith, C.H. (2000) Structural proteomics of an ar- chaeon. Nature Structural Biology, 7, 903-909. [45] Goh, C.S., Lan, N., Douglas, S.M., Wu, B., Echols, N., Smith, A., Milburn, D., Montelione, G.T., Zhao, H. and Gerstein, M. (2004) Mining the structural genomics pipeline: Identification of protein properties that affect high-throughput experimental analysis. Journal of Mo- lecular Biology, 336, 115-130. [46] Canaves, J.M., Page, R., Wilson, I.A. and Stevens, R.C. (2004) Protein biophysical properties that correlate with crystallization success in Thermotoga maritima: Maxi- mum clustering strategy for structural genomics. Journal of Molecular Biology, 344, 977-991. [47] Kantardjieff, K.A. and Rupp, B. (2004) Protein isoelec- tric point as a predictor for increased crystallization screening efficiency. Bioinformatics, 20, 2162-2168. [48] Kantardjieff, K.A., Jamshidian, M. and Rupp, B. (2004) Distributions of pI vs pH provide strong prior informa- tion for the design of crystallization screening experi- ments. Bioinformatics, 20, 2171-2174. [49] Longenecker, K.L., Garrard, S.M., Sheffield, P.J. and Derewenda, Z.S. (2001) Protein crystallization by ra- tional mutagenesis of surface residues: Lys to Ala muta- tions promote crystallization of RhoGDI. Acta Crystal- lographica Section D: Biological Crystallography, 57, 679-688. [50] Mateja, A., Devedjiev, Y., Krowarsch, D., Longenecker, K., Dauter, Z., Otlewski, J., Derewenda, Z.S. (2002) The impact of Glu-Ala and Glu-Asp mutations on the crystal- lization properties of RhoGDI: the structure of RhoGDI at 1.3 A resolution. Acta Crystallographica Section D: Biological Crystallography, 58, 1983-1991. [51] Derewenda, Z.S. (2004) The use of recombinant methods and molecular engineering in protein crystallization. Methods, 34, 354-363. [52] Derewenda, Z.S. (2004) Rational protein crystallization by mutational surface engineering. Structure, 12, 529-535. [53] Derewenda, Z.S. and Vekilov, P.G. (2006) Entropy and surface engineering in protein crystallization. Acta Crys- tallographica Section D: Biological Crystallography, 62, 116-124. [54] Cooper, D.R., Boczek, T., Grelewska, K., Pinkowska, M., Sikorska, M., Zawadzki, M. and Derewenda, Z. (2007) Protein crystallization by surface entropy reduction: op- timization of the SER strategy. Acta Crystallographica Section D: Biological Crystallography, 63, 636-645.  L. Kurgan et al. / Natural Science 1 (2009) 93-106 Copyright © 2009 SciRes. OPEN ACCESS 106 [55] Goldschmidt, L., Cooper, D.R., Derewenda, Z. and Eisenberg, D. (2007) Toward rational protein crystalliza- tion: A Web server for the design of crystallizable protein variants. Protein Science, 16, 1569-1576. [56] Oldfield, C.J., Ulrich, E.L., Cheng, Y., Dunker, A.K. and Markley, J.L. (2005) Addressing the intrinsic disorder bottleneck in structural proteomics. Proteins, 59, 444-453. [57] Chandonia, J.M., Kim, S.H. and Brenner, S.E. (2006) Target selection and deselection at the Berkeley Struc- tural Genomics Center. Proteins, 62, 356-370. [58] Price, W.N. 2nd, Chen, Y., Handelman, S.K., Neely, H., Manor, P., Karlin, R., Nair, R., Liu, J., Baran, M., Everett, J., Tong, S.N., Forouhar, F., Swaminathan, S.S., Acton, T., Xiao, R., Luft, J.R., Lauricella, A., DeTitta, G.T., Rost, B., Montelione, G.T. and Hunt, J.F.. (2009) Understanding the physical properties that control protein crystallization by analysis of large-scale experimental data. Nature Bio- technology, 27(1), 51-57. [59] Chou, K.C. (2004) Structural bioinformatics and its im- pact to biomedical science. Current Medicinal Chemistry, 11, 2105-2134. [60] Chou, K.C. (2005) Progress in protein structural class prediction and its impact to bioinformatics and pro- teomics. Current Protein & Peptide Science, 6, 423-436. [61] Yang, Z. R., Wang, L., Young, N. and Chou, K.C. (2005) Pattern recognition methods for protein functional site prediction. Current Protein & Peptide Science, 6, 479-491. [62] Chou, K.C. and Shen, H.B. (2007) Recent progresses in protein subcellular location prediction. Analytical Bio- chemistry, 370, 1-16. [63] Kurgan, L., Cios, K.J., Zhang, H., Zhang, T., Chen, K., Shen, S. and Ruan, J. (2008) Sequence-based methods for real value predictions of protein structure. Current Bioinformatics, 3(3), 183-196. [64] Smialowski, P., Schmidt, T., Cox, J., Kirschner, A. and Frishman, D. (2006) Will my protein crystallize? A se- quence-based predictor. Proteins, 62, 343-355. [65] Overton, I.M. and Barton, G.J. (2006) A normalised scale for structural genomics target ranking: the OB-Score. FEBS Letters, 580, 4005-4009. [66] Overton, I.M., Padovani, G., Girolami, M.A. and Barton, G.J. (2008) ParCrys: a Parzen window density estimation approach to protein crystallization propensity prediction. Bioinformatics, 24, 901-907. [67] Slabinski, L., Jaroszewski, L., Rodrigues, A.P.C., Rychlewski, L., Wilson, I.A., Lesley, S.A. and Godzik, A. (2007) The challenge of protein structure determination - lessons from structural genomics. Protein Science, 16(11), 2472-2482. [68] Slabinski, L., Jaroszewski, L., Rychlewski, L., Wilson, I.A., Lesley, S.A. and Godzik, A. (2007) XtalPred: a web server for prediction of protein crystallizability. Bioin- formatics, 23(24), 3403-3405. [69] Chen, K., Kurgan, L. and Rahbari, M. (2007) Prediction of protein crystallization using collocation of amino acid pairs. Biochemical and Biophysical Research Communi- cations, 355, 764-769. [70] Kurgan, L., Razib, A.A., Aghakhani, S., Dick, S., Mizianty, M.J. and Jahandideh, S. (2009) CRYSTALP2: sequence-based protein crystallization propensity predic- tion. BMC Structural Biology, 9, 50. [71] Campbell, K. and Kurgan, L. (2008) Sequence-only based prediction of ß-turn location and type using collo- cation of amino acid pairs. Open Bioinformatics Journal, 2, 37-49. [72] Chen, K., Kurgan, L. and Ruan, J. (2007) Prediction of flexible/rigid regions in proteins from sequences using collocated amino acid pairs. BMC Structural Biology, 7, 25. [73] Chen, Y.Z., Tang, Y.R., Sheng, Z.Y. and Zhang, Z. (2008) Prediction of mucin-type O-glycosylation sites in mam- malian proteins using the composition of k-spaced amino acid pairs. BMC Bioinformatics, 9, 101. [74] Chen, K., Jiang, Y., Du, L. and Kurgan, L. (2009) Predic- tion of integral membrane protein type by collocated hy- drophobic amino acid pairs. Journal of Computational Chemistry, 30(1), 163-172. [75] Kurgan L. (2008) On the relation between the predicted secondary structure and the protein size. The Protein Journal, 24(4), 234-239. [76] Shen, H.B. and Chou, K.C. (2009) Predicting protein fold pattern with functional domain and sequential evo- lution information. Journal of Theoretical Biology, 256(3), 441-446. [77] Chen, K. and Kurgan, L. (2007) PFRES: protein fold classification by using evolutionary information and pre- dicted secondary structure. Bioinformatics, 23(21), 2843-2850. [78] Assfalg, J., Gong, J., Kriegel, H.P., Pryakhin, A., Wei, T. and Zimek, A. (2009) Supervised ensembles of predic- tion methods for subcellular localization. Journal of Bio- informatics and Computational Biology, 7(2), 269-285. [79] Shen, H.B. and Chou, K.C. (2007) Hum-mPLoc: an en- semble classifier for large-scale human protein subcellu- lar location prediction by incorporating samples with multiple sites. Biochemical and Biophysical Research Communications, 355(4), 1006-1011. [80] Chou, K.C. and Shen, H. B. (2006) Hum-PLoc: A novel ensemble classifier for predicting human protein subcel- lular localization. Biochemical and Biophysical Research Communications, 347, 150-157. [81] Kedarisetti, K.D., Kurgan, L. and Dick, S. (2006) Classi- fier ensembles for protein structural class prediction with varying homology. Biochemical and Biophysical Re- search Communications, 348(3), 981-988. [82] Chen, H. and Zhou, H.X. (2005) Prediction of solvent accessibility and sites of deleterious mutations from pro- tein sequence. Nucleic Acids Research, 33(10), 3193-3199.
|