World Journal of Engineering and Technology
Vol.04 No.03(2016), Article ID:71323,7 pages
10.4236/wjet.2016.43D006
An Approach to Calculate the Capacity of Pump-Hydro Combined Energy Storage with Wind Power Integration
Su Wang, Shuai Shi, Kwoklun Lo, Jianfeng Lu
Department of Electronic and Electrical Engineering, University of Strathclyde, Glasgow, UK


Received: July 20, 2016; Accepted: October 13, 2016; Published: October 20, 2016
ABSTRACT
In this paper, an approach is presented to calculate the reserve capacity of Pump- Hydro Combined Energy Storage (PHCES) integrated with wind generation. The proposed approach utilizes Monte Carlo methods to obtain all the reasonable capacity of PHCES based on the power system reliability requirement. The pumping and hydro period of PHCES will be taken into consideration to estimate the reliability of wind power generation with PHCES. Finally this approach is applied in a RBTS system to calculate the minimum capacity of PHCES.
Keywords:
Wind Power, PHCES Cooperation System, Reliability, Comprehensive Benefits

1. Introduction
The integration of wind power generation into grid networks is increasing around the world. Wind power generation is taken as an energy resource instead of a capacity resource because that wind source output is unpredictable and intermittent. Capacity resource is a kind of resource that could be useful for generating power to meet the load demand [1]. Since conventional designing methods are concentrated on capacity and reliability designing, the challenges of wind power is to balance the effective generation output and the gird demand. In order to reduce the incongruity between the time varying wind generation and the load demand, a method that PHCES integrated has been built [2].
Several wind speed prediction methods have been summarized in papers [3]-[5], which could be utilized to simulate the power output from a wind turbine generator. Papers [6] [7] define the wind capacity credit by comparing the system reliability between the conventional unit and wind power generator. Papers [8]-[10] proposed simulation methods to calculate the reliability of wind power system and are based on continuous and discontinuous Monte Carlo methods.
In this paper, the Monte Carlo method is used to evaluate the reliability of the power system and some reliability parameters are obtained. Then the change of the reliability before and after the wind power addition is analyzed and the effect of wind power on power system reliability is elaborated. After that, by comparing the reliability index of conventional power system and system with wind power, the minimum capacity of PHCES can be evaluated.
2. Wind Speed and Wind Farm Output Model
2.1. Study System
Figure 1 explains a sinle line schematic diagram of the study WP-PHCES unit, integrated to a distribution network. WP-PHCES is based on a wind farm which contains several double-fed induction generators (DFIG) which are controlled by the connection of a grid-side converter (GSC) and rotor-side converter (RSC); and a PHCES is connected to store the redundant wind power. In this figure,  and
and  stand for active power extracted by wind power unit and conventional generators respectively. The total power,
  is denoted hereafter by
 . In this study model,
  is automatically controlled through a voltage/frequency regulation scheme to compensate for the difference between
  and the total load power,
 .
.
2.2. Wind power Predict of Study System
Wind energy output is stochastic and is often predicted by several probabilistic techniques [8]. In power systems, two distinguishing methods have been used to evaluate the reliability indices [11]. There are analytical method and the simulation method respectively. This paper utilizes F & D method and Weibull probability density function to predict wind speed based on computer simulation. Weibull distribution when combined with Monte Carlo simulation method shows an excellent performance on wind speeds modeling. It could accommodate the wind speed fluctuation by modifying the
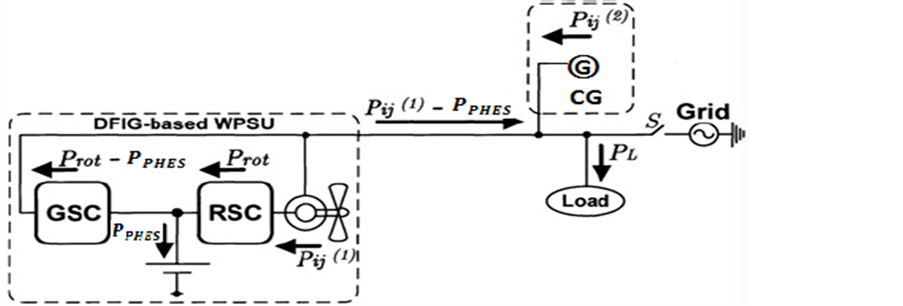
Figure 1. Simple line schematic diagram of the study system.
parameters. The expression of individual Weibull probability density function is as Equation (1).
 (1)
(1)
where: : probability of occurrence of wind speed v, c and k: Weibull scale and shape parameter respectively.
And Equation (2) below could model the wind speed.
 (2)
(2)
where: : wind speed at hour n (m/s)
 : a uniform distributed random number generated at hour n.
In this paper c and k has been set to standard values that are 7 and 2 respectively. So the wind speed could be generated as shown in Figure 2.
The power curve of wind turbine in this paper is obtained by using above wind speed which is substtued in Equation (3).
 (3)
(3)
where: : designed cut-in speed, rate speed and cut-out speed of wind turbine (m/s)
 : wind speed (m/s)
 : rated power output of wind turbine (MW)
The constants of A, B, C can be calculated busing the equation in [12].
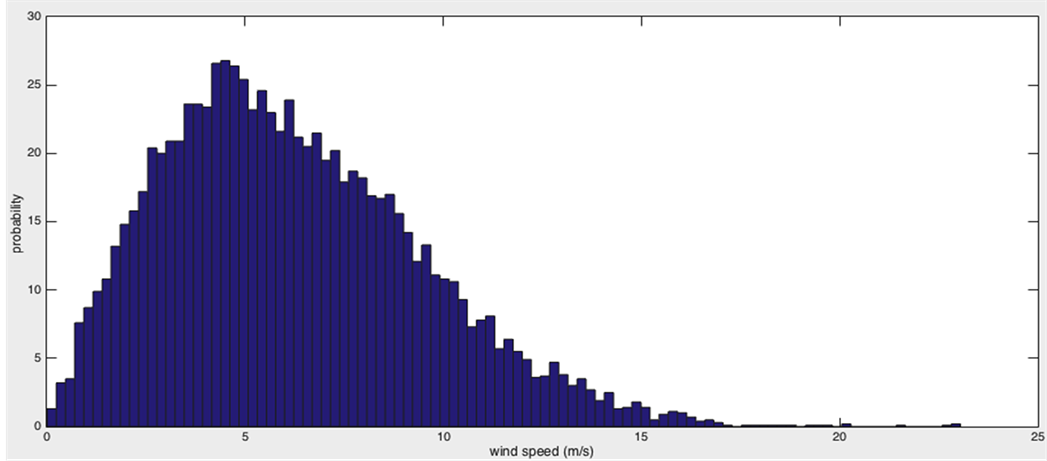
Figure 2. Wind speed generated by Weibull distribution random.
3. Reliability of Study System
Reliability Index
ELCC (effective load carrying capability) is a kind of reliability index. It is used to calculate the value of the capacity of added renewable and traditional power plant. Loss of load expectation (LOLE) is the most common used index utilized to evaluate ELCC, which means the risk standard of the additional power plant, and in this paper, LOLE is considered as the reliability index, also LOEE (loss of energy expectation) will be used. LOLE could been determined by Equation (4), and LOEE could be determined by Equations (5) and (6) respectively
 (4)
(4)
 (5)
(5)
 (6)
(6)
where, : the available generation capacity during period h (MW);
 : the load demand during period h (MW).
Then, the reliability indices calculations are based on Monte Carlo simulation. Load response of PHCES is very fast which needs just 5 minutes from full stop to full generating capacity and 1 minute from full stop to full pumping, so time of PHES to translate between charge and discharge is not considered. In the electrical power system, if the failure rate and the repair rate of a certain repairable component are  and
and
 and
and  are the basic parameters used for measurement of analogue element duration and state transition characteristics in Monte Carlo Algorithm, while the mean time to failure and the mean time to repair being MTTF and MTTR respectively, the following important relation comes into effect:
 (7)
(7)
 (8)
(8)
The forced outage rate (FOR) of the component reflects the unavailability of the system that is the basic parameter of non-sequential simulation algorithm measuring the system status by sampling, can be calculated with equation 9:
 (9)
(9)
The FOR and MTTR of conventional and wind generators will be considered, because wind turbine will meet an average of 170 hours per year per turbine downtime and an average 1.5 times failure per year per turbine. This failure will actually influence the system reliability, and PHCES can be recognized as a conventional generator.
There are five steps to evaluate the reliability index of test system:
1) Utilizing certain load variation pattern and adjustable annual peak load demand to determine load model  in one year.
2) Assume conventional generators used for computations are considered as a two state model .
.
3) Evaluating LOLE of conventional power system by comparing  and
and .
.
4) Adding a certain capacity of wind power and at the same time remove the same size of conventional power units. Generating the output of wind power by using Weibull distribution using Equation (3).
5) Evaluating LOLE of test system by comparing  and
and .
.
4. Results and Discussion
Assume wind penetration level is 10% and recognize wind power is must take power output which means that the output of conventional generators decreases 10%. Generating wind speed by using Weibull distribution, and then time series of wind speed generated by matlab input to the wind turbine characteristic functions (3). After that, total power generation  could be obtained by combining the outputs of conventional generators. Figure 3 shows the snap shot of simulated wind power output in 300 hours.
Figure 4 shows the superimposition of chronological available test system capacity and system load, an outage is counted when the load exceeds the available system capacity. From the figure and the simulation results in this figure, the system capacity is less than the load in twice. It means that LOLE is 2 in this simulation. In fact, Monte Carlo Method is a continuous varying convergence process and it cannot provide real value for the expected reliability index but can approach it. It is important to keep Monte Carlo Simulation sampling repeatedly for many times within a long test period to achieve certain accuracy level of the simulation results. In this paper, the setting of the number of samples is 10,000.
After 10,000 sampling, LOLE of general power system and system with wind power are 1.0717 and 5.4601 respectively. The PHCES combines the advantages of the combined flexibility of PHCES units and reliability assessment method to reduce the impacts of wind power fluctuation on power outputs and maintain the reliability level.
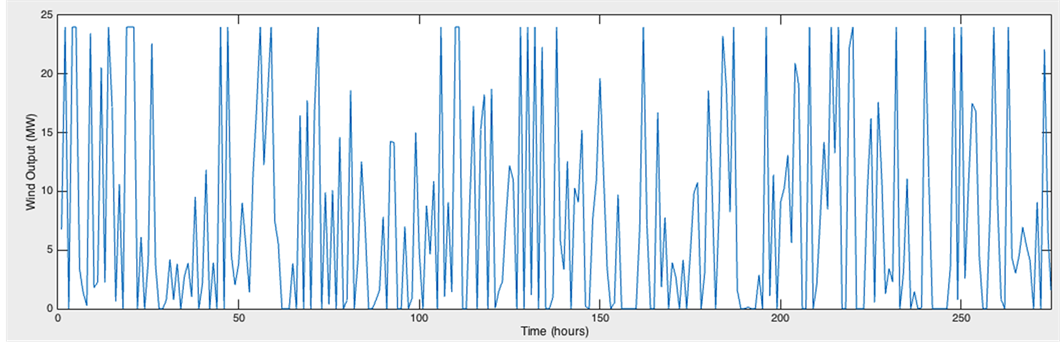
Figure 3. Snap shot of simulated wind power output.
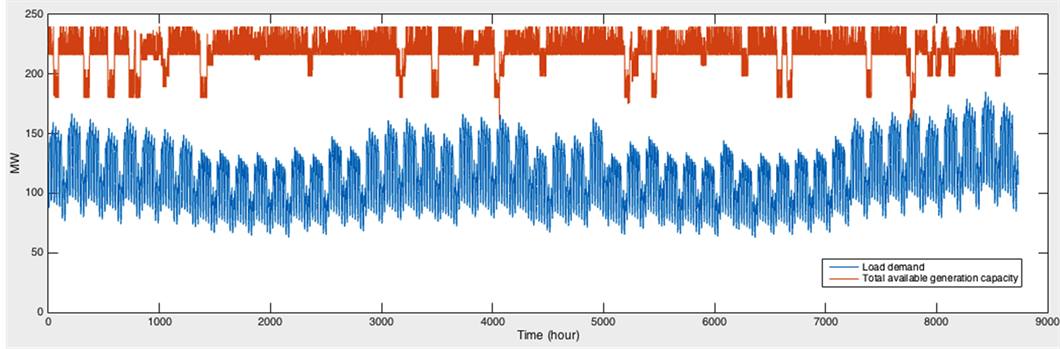
Figure 4. Superimposition of test system capacity and load.
The operation of PHCES will be considered when evaluate the reliability index of WP-PHCES system. First, the control logic of the WP-PHCES, the pumping stored energy,  is calculated for all hours, expressed by equation (10).
 (10)
(10)
where:  and
and  are, respectively, the lower and upper limits of the PHES.
T: the duration of state
Then based on , the PHES available for export, PPHES [h], and subsequently the “effective load power”
 (11)
(11)
where: : the maximum capacity of PHCES during hydro period. (MW)
 : the maximum capacity of PHCES during pumping period (MW)
The simulation results of reliability indices for WP-PHCES are summarized in Table 1.
As can be seen from Table 1, when the capacity of PHCES is larger than 12 MW, the test system could meet the reliability requirement.
4. Conclusions and Future Work
This paper proposed an approach to calculate the minimum capacity of PHCES when wind power is integrated to power grid. The methodology is based on Monte Carlo method that is used to analyze the power system reliability, aims to analyze the change of power system reliability involving wind farm power. The force outage rate of generating units and operation of PHCES has been considered. The test system example shows that the capacity of the wind farms power has a negative effect on the reliability

Table 1. LOLE result of test system at different values of PHCES.
of the power grid. As can be seen form the reliability index of wind power and test system, PHCES is effective to overcome the wind power fluctuation problem.
Future work will focus on PHCES capacity optimization, which can be described as using the optimal capacity of PHCES to achieve the required level of reliability and highest benefits. This paper has described the minimum capacity of PHCES to meet the required reliability, in the next paper; comprehensive benefits and cost should be taken into consideration to find out the optimal capacity of PHCES.
Cite this paper
Wang, S., Shi, S., Lo, K. and Lu, J.F. (2016) An Approach to Calculate the Capacity of Pump-Hydro Com- bined Energy Storage with Wind Power In- tegration. World Journal of Engineering and Technology, 4, 43-49. http://dx.doi.org/10.4236/wjet.2016.43D006
References
- 1. US Department of Energy (2008) 20% Wind Energy by 2030, Increasing Wind Energy’s Contribution to U. S. Electricity Supply. Oak Ridge.
- 2. Tuohy, A. and O’Malley, M. (2009) Impact of Pumped Storage on Power Systems with Increasing Wind Penetration. Power & Energy Society General Meeting, PES’09. IEEE.
- 3. Shuai, S. and Lo, K.L. (2012) Reliability Assessment of Power System Considering the Impact of Wind Energy. 47th International Universities Power Engineering Conference (UPEC).
- 4. Billinton, R. and Dange, H. (2011) Incorporating Wind Power in Generating Capacity Reliability Evaluation Using Different Models. IEEE Transactions on Power Systems, 26, 2509- 2517. http://dx.doi.org/10.1109/TPWRS.2011.2120633
- 5. Billinton, R., et al. (2012) Adequacy Assessment Considerations in Wind Integrated Power Systems. IEEE Transactions on Power Systems, 27, 2297-2305. http://dx.doi.org/10.1109/TPWRS.2012.2205022
- 6. Wang, H.C., Lu, Z.X. and Zhou, S.X. (2005) Resarch on the Capacity Credit of Wind Energy Resources. Proceedings of the CSEE, 25, 103-106.
- 7. Chen, S.Y., et al. (2000) Reliability Model of Wind Power Plants and Its Application. Proceedings of the Csee, 20, 26-29.
- 8. Bakirtzis, A.G. (1992) A Probabilistic Method for the Evaluation of the Reliability of Stand Alone Wind Energy Systems. IEEE Trans. Energy Convers, 7, 99-107. http://dx.doi.org/10.1109/60.124548
- 9. Roy Billinton, R.N.A. (1992) Reliability Evaluation of Engineering Systems: Concepts and Techniques. Second Edition, Plenum Press, New York and London. http://dx.doi.org/10.1007/978-1-4899-0685-4
- 10. Billinton, R. and Gan, L. (1991) Use of Monte Carlo Simulation in Teaching Generating Capacity Adequacy Assessment. IEEE Transactions on Power Systems, 6, 1571-1577. http://dx.doi.org/10.1109/59.117004
- 11. Billinton, R. and Allan, R.N. (1996) Reliability Evaluation of Powersystems. Plenum Press, New York.
- 12. Zhou, Y. (2009) Some Issues of Integrating Wind Power Generation into Electric Networks. Department of Electronic and Electrical Engineering, University of Strathclyde, UK, 252.