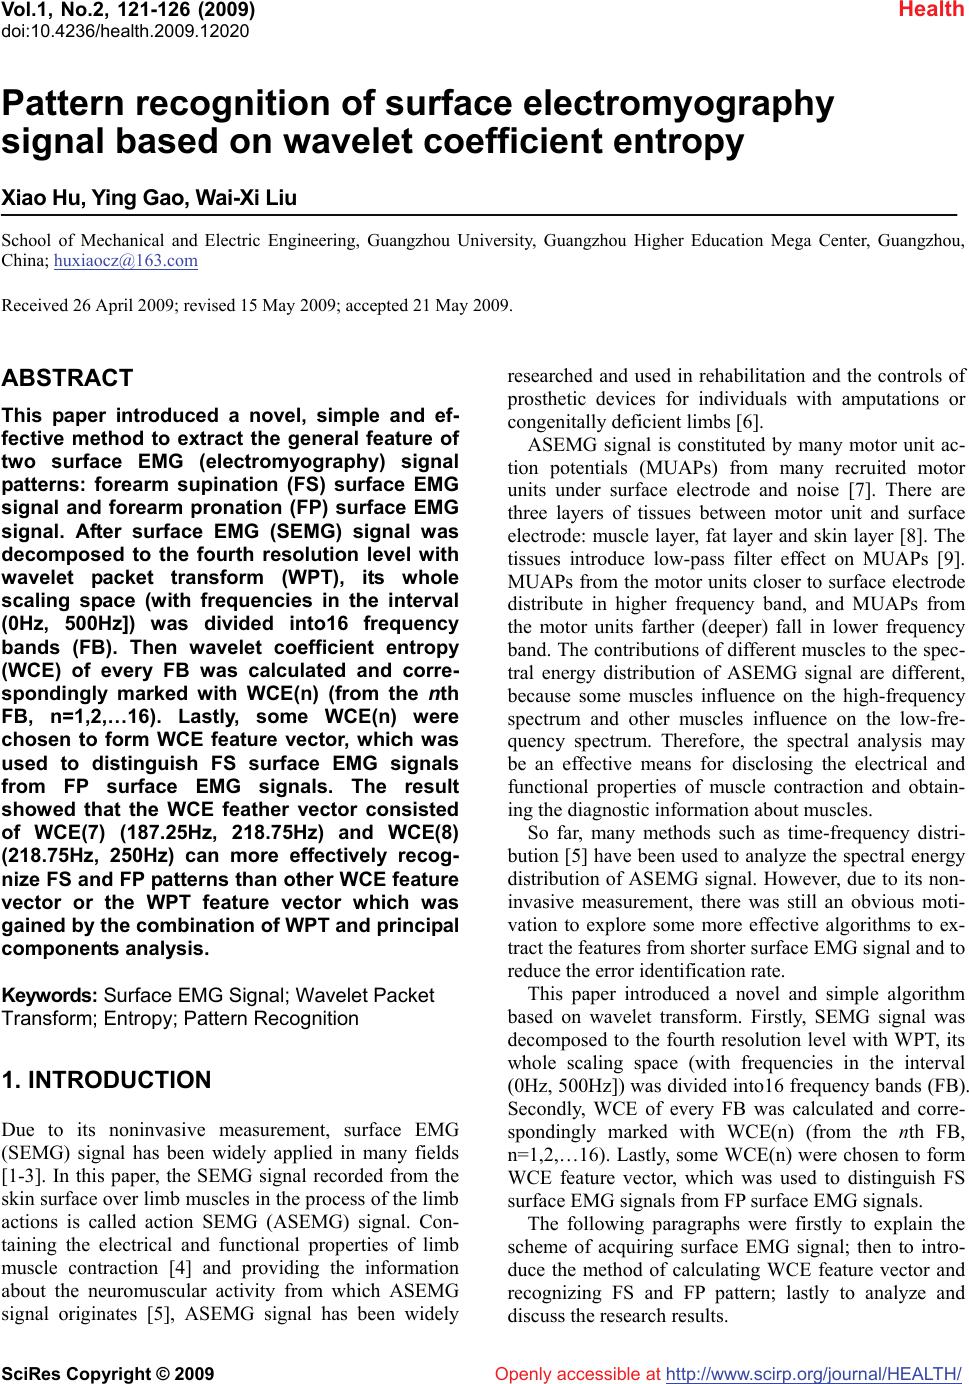
 Vol.1, No.2, 121-126 (2009) doi:10.4236/health.2009.12020 SciRes Copyright © 2009 http://www.scirp.org/journal/HEALTH/ Health Openly accessible at Pattern recognition of surface electromyography signal based on wavelet coefficient entropy Xiao Hu, Ying Gao, Wai-Xi Liu School of Mechanical and Electric Engineering, Guangzhou University, Guangzhou Higher Education Mega Center, Guangzhou, China; huxiaocz@163.com Received 26 April 2009; revised 15 May 2009; accepted 21 May 2009. ABSTRACT This paper introduced a novel, simple and ef- fective method to extract the general feature of two surface EMG (electromyography) signal patterns: forearm supination (FS) surface EMG signal and forearm pronation (FP) surface EMG signal. After surface EMG (SEMG) signal was decomposed to the fourth resolution level with wavelet packet transform (WPT), its whole scaling space (with frequencies in the interval (0Hz, 500Hz]) was divided into16 frequency bands (FB). Then wavelet coefficient entropy (WCE) of every FB was calculated and corre- spondingly marked with WCE(n) (from the nth FB, n=1,2,…16). Lastly, some WCE(n) were chosen to form WCE feature vector, which was used to distinguish FS surface EMG signals from FP surface EMG signals. The result showed that the WCE feather vector consisted of WCE(7) (187.25Hz, 218.75Hz) and WCE(8) (218.75Hz, 250Hz) can more effectively recog- nize FS and FP patterns than other WCE feature vector or the WPT feature vector which was gained by the combination of WPT and principal components analysis. Keywords: Surface EMG Signal; Wavelet Packet Transform; Entropy; Pattern Recognition 1. INTRODUCTION Due to its noninvasive measurement, surface EMG (SEMG) signal has been widely applied in many fields [1-3]. In this paper, the SEMG signal recorded from the skin surface over limb muscles in the process of the limb actions is called action SEMG (ASEMG) signal. Con- taining the electrical and functional properties of limb muscle contraction [4] and providing the information about the neuromuscular activity from which ASEMG signal originates [5], ASEMG signal has been widely researched and used in rehabilitation and the controls of prosthetic devices for individuals with amputations or congenitally deficient limbs [6]. ASEMG signal is constituted by many motor unit ac- tion potentials (MUAPs) from many recruited motor units under surface electrode and noise [7]. There are three layers of tissues between motor unit and surface electrode: muscle layer, fat layer and skin layer [8]. The tissues introduce low-pass filter effect on MUAPs [9]. MUAPs from the motor units closer to surface electrode distribute in higher frequency band, and MUAPs from the motor units farther (deeper) fall in lower frequency band. The contributions of different muscles to the spec- tral energy distribution of ASEMG signal are different, because some muscles influence on the high-frequency spectrum and other muscles influence on the low-fre- quency spectrum. Therefore, the spectral analysis may be an effective means for disclosing the electrical and functional properties of muscle contraction and obtain- ing the diagnostic information about muscles. So far, many methods such as time-frequency distri- bution [5] have been used to analyze the spectral energy distribution of ASEMG signal. However, due to its non- invasive measurement, there was still an obvious moti- vation to explore some more effective algorithms to ex- tract the features from shorter surface EMG signal and to reduce the error identification rate. This paper introduced a novel and simple algorithm based on wavelet transform. Firstly, SEMG signal was decomposed to the fourth resolution level with WPT, its whole scaling space (with frequencies in the interval (0Hz, 500Hz]) was divided into16 frequency bands (FB). Secondly, WCE of every FB was calculated and corre- spondingly marked with WCE(n) (from the nth FB, n=1,2,…16). Lastly, some WCE(n) were chosen to form WCE feature vector, which was used to distinguish FS surface EMG signals from FP surface EMG signals. The following paragraphs were firstly to explain the scheme of acquiring surface EMG signal; then to intro- duce the method of calculating WCE feature vector and recognizing FS and FP pattern; lastly to analyze and discuss the research results.  http://www.scirp.org/journal/HEALTH/ X. Hu et al. / HEALTH 1 (2009) 121-126122 Openly accessible at 2. SURFACE EMG SIGNAL’S ACQUISITION All surface EMG signals were recorded by Metr-1-10UK (made by Mega Electronics Ltd) in the EMG room at Hua Shan Hospital in Shanghai, China. Because the power density function of SEMG signal outside the range from 5-10 Hz to 400-450 Hz has negligible con- tributions [10], the low cut-off frequency and the high cut-off frequency of Metr-1-10UK were set 5Hz and 500Hz respectively. The sampling frequency fs was de- termined at 1000Hz. It was about 2cm between two measuring surface electrodes (diameter = 5mm) which were put on the skin surface over the pronator teres in the right forearm along the flexor. And the ground elec- trode (denoted the capital letter “G”) was on the flexor carpi radialis and the palmaris longus (see Figure 1 for their arrangement). The negative electrode (denoted by the symbol “-”) was placed nearer subject’s heart than the positive electrode (denoted by the symbol “+”) to form a differential comparator amplifier. During every acquiring process, every subject was in- structed to do two different kinds of limb actions: fore- arm supination (FS) and forearm pronation (FP). The whole acquiring process was divided into three stages: preparing stage, acting stage and sustaining stage. At the preparing stage, every subject put his right forearm on the measure platform flatly and naturally (see Figure 1 (b)). At the acting stage, there were two cases: FP and FS. In the process of FP, the forearm was quickly trans- formed from the pose at Figure 1(b) to that at (a), and in the process of FS, the forearm was quickly transformed from the pose Figure 1(b) to that at (c). The whole process of FS or FP must be finished within 0.5 second. After finishing FS or FP, every subject kept the end condition of the limb actions for one or two seconds, the stage was the sustaining stage. Figure 1. The forearm posture. (b): the forearm posture before forearm actions; (a) and (c) are respectively the posture after forearm pronation and forearm supination; +, -, G represent respectively the positive, negative electrodes and the ground. Figure 2. Raw surface EMG signal and its segments (a): Raw surface EMG signal; (b) and (c) are respectively the segments of the raw surface EMG signal on (a) at preparing stage and acting stage. The arrow on (a) points the start of the acting stage. 30 healthy subjects participated in study. Two sets of surface EMG signals (FS and FP) were respectively re- corded from every subject’s forearm flexor. Figure 2 showed the wave of a set of recorded surface EMG sig- nal. The arrow at Figure 2 pointed to the start time of forearm action. The start time could be determined by an amplitude criterion [11]. A 50-points window slid along the surface EMG signal from left to right. At the same time, the number of the points above one threshold in the window was calculated. The first time when the number was above 10 was regarded as the starting time of fore- arm action. After the start time of forearm actions and immediate to the start time, one 0.5-second surface EMG signal (500 samples) was segmented from every raw surface EMG signal, see Figure 2(c).Thus, 60 segments of sur- face EMG signals obtained in all, there were two surface EMG signal patterns: FS and FP, 30 sets for each pattern. 3. WAVELET COEFFICIENT ENTROPY Multiresolution analysis was first proposed in 1989 by Mallat [12]. Since then, the advanced research and de- velopment in wavelet analysis have applied in many fields such as signal processing and pattern recognition [13]. Wavelet packets were introduced by Coifman and Wickerhauser (1992) [14] as a generalized family of multiresolution orthogonal or biorthognal basis. Unlike wavelet transform which is realized only by a low-pass filter bank, wavelet packet transform is implemented by a basic two-channel filter bank which can be iterated over either a low-pass or a high-pass branch. So the in- formation in high frequencies can be analyzed as well as that in low frequencies in wavelet packet transform. As a result, finer frequency bands can be gained by wavelet packet transform than by wavelet transform. Therefore, WPT has been widely applied in biomedical signal analysis and many encouraging results have been ob- tained [15,16]. Given a finite energy signal, s(t), whose scaling space SciRes Copyright © 2009 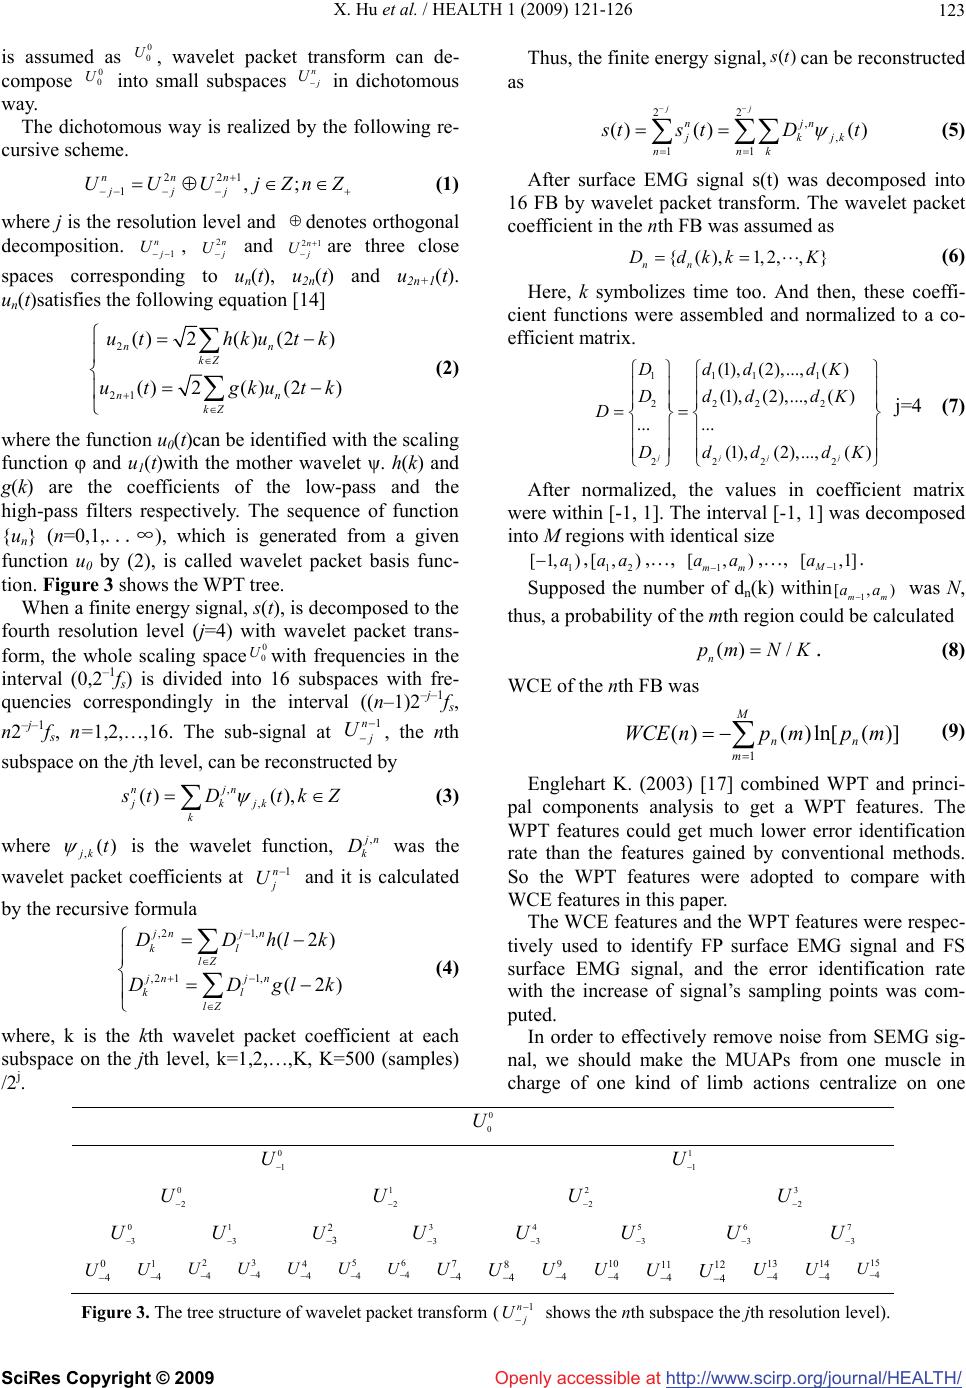 X. Hu et al. / HEALTH 1 (2009) 121-126 SciRes Copyright © 2009 http://www.scirp.org/journal/HEALTH/ 123 is assumed as , wavelet packet transform can de- compose into small subspaces 0 0 U 0 0 Un U in dichotomous way. Thus, the finite energy signal,can be reconstructed as )(ts Openly accessible at The dichotomous way is realized by the following re- cursive scheme. 221 1,; nnn jjj UUUjZn Z (1) where j is the resolution level and denotes orthogonal decomposition. 1 n U, and 2n j U 2n1 U are three close spaces corresponding to un(t), u2n(t) and u2n+1(t). un(t)satisfies the following equation [14] 2 21 ()2( )(2) ()2( )(2) nn kZ nn kZ uthku tk ut gkutk (2) where the function u0(t)can be identified with the scaling function φ and u1(t)with the mother wavelet ψ. h(k) and g(k) are the coefficients of the low-pass and the high-pass filters respectively. The sequence of function {un} (n=0,1,...∞), which is generated from a given function u 0 by (2), is called wavelet packet basis func- tion. Figure 3 shows the WPT tree. When a finite energy signal, s(t), is decomposed to the fourth resolution level (j=4) with wavelet packet trans- form, the whole scaling spacewith frequencies in the interval (0,2–1fs) is divided into 16 subspaces with fre- quencies correspondingly in the interval ((n–1)2–j–1fs, n2–j–1fs, n=1,2,…,16. The sub-signal at 0 0 U 1n U , the nth subspace on the jth level, can be reconstructed by , , () (), njn jkjk k tD tk Z (3) where , jk t is the wavelet function, , n k D was the wavelet packet coefficients at 1n U and it is calculated by the recursive formula ,2 1, ,2 11, (2) (2) jnj n kl lZ jnj n kl lZ DDhl DDgl k k jk (4) 22 , , 11 () ()() jj njn jk nnk tstD t (5) After surface EMG signal s(t) was decomposed into 16 FB by wavelet packet transform. The wavelet packet coefficient in the nth FB was assumed as {(), 1,2,,} nn dkk K (6) Here, k symbolizes time too. And then, these coeffi- cient functions were assembled and normalized to a co- efficient matrix. 111 1 222 2 222 2 (1), (2),..., () (1),(2),...,( ) ... ... (1), (2),..., () jjj j Ddd dK DdddK D dd dK j=4 (7) After normalized, the values in coefficient matrix were within [-1, 1]. The interval [-1, 1] was decomposed into M regions with identical size 1 [1, )a ,,…, ,…, . 12 [, )aa1 [, mm aa )] ) 1 [,1 M a Supposed the number of dn(k) within was N, thus, a probability of the mth region could be calculated 1 [, mm aa ()/ n pm NK. (8) WCE of the nth FB was M m nn mpmpnWCE 1 )](ln[)()( (9) Englehart K. (2003) [17] combined WPT and princi- pal components analysis to get a WPT features. The WPT features could get much lower error identification rate than the features gained by conventional methods. So the WPT features were adopted to compare with WCE features in this paper. The WCE features and the WPT features were respec- tively used to identify FP surface EMG signal and FS surface EMG signal, and the error identification rate with the increase of signal’s sampling points was com- puted. where, k is the kth wavelet packet coefficient at each subspace on the jth level, k=1,2,…,K, K=500 (samples) /2j. In order to effectively remove noise from SEMG sig- nal, we should make the MUAPs from one muscle in charge of one kind of limb actions centralize on one 0 0 U 0 1 U 1 1 U 0 2 U 1 2 U 2 2 U 3 2 U 0 3 U 1 3 U 2 3 U 3 3 U 4 3 U 5 3 U 6 3 U 7 3 U 0 4 U 1 4 U 2 4 U 3 4 U 4 4 U 5 4 U 6 4 U 7 4 U 8 4 U 9 4 U 10 4 U 11 4 U 12 4 U 13 4 U 14 4 U 15 4 U Figure 3. The tree structure of wavelet packet transform (1n U shows the nth subspace the jth resolution level). 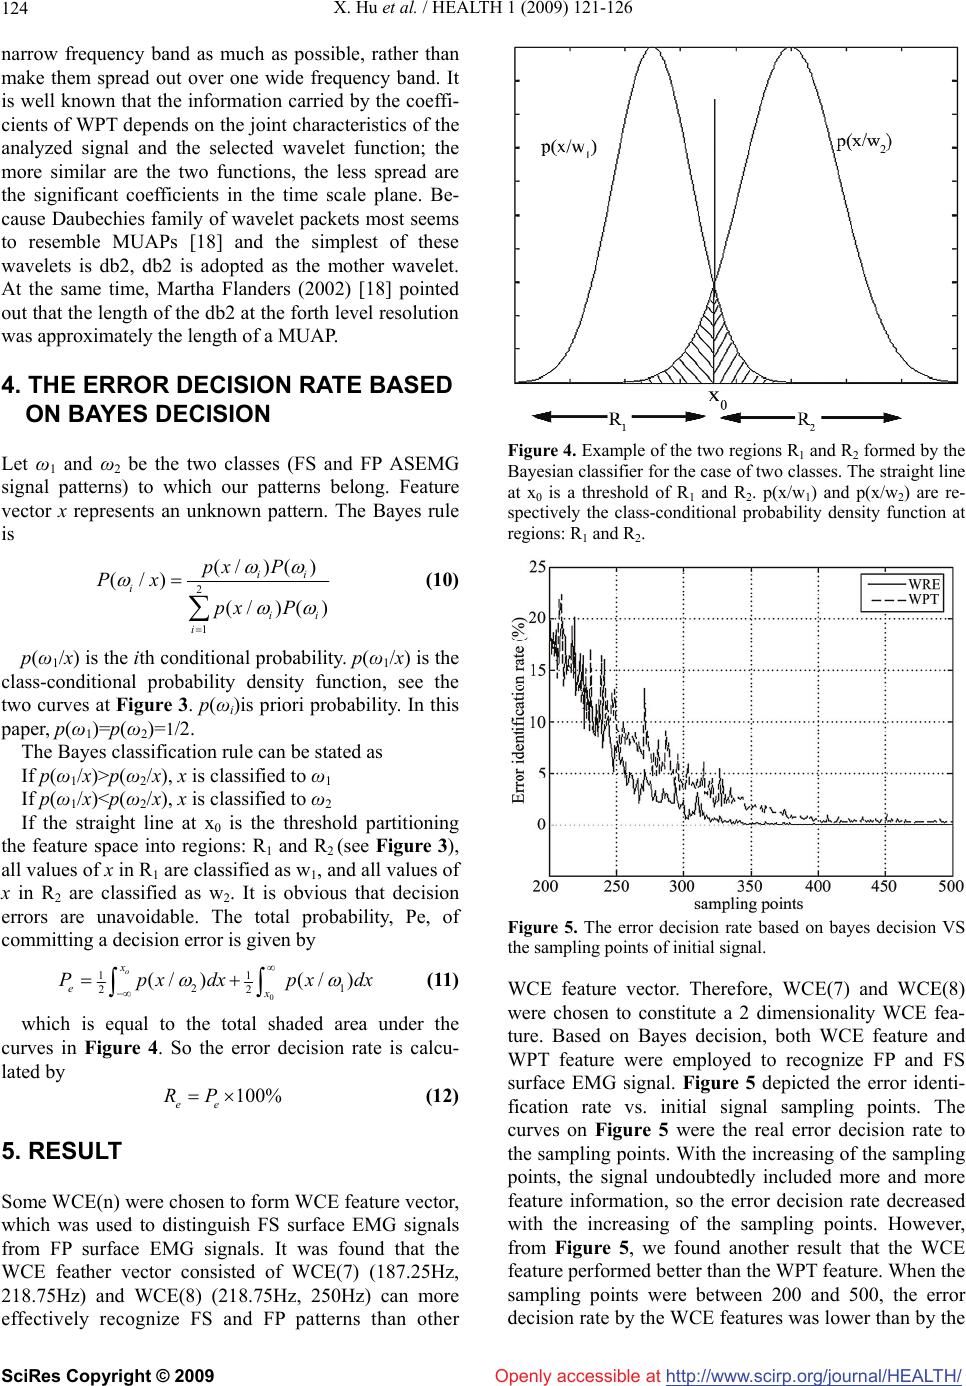 X. Hu et al. / HEALTH 1 (2009) 121-126 Openly accessible at http://www.scirp.org/journal/HEALTH/ 124 narrow frequency band as much as possible, rather than make them spread out over one wide frequency band. It is well known that the information carried by the coeffi- cients of WPT depends on the joint characteristics of the analyzed signal and the selected wavelet function; the more similar are the two functions, the less spread are the significant coefficients in the time scale plane. Be- cause Daubechies family of wavelet packets most seems to resemble MUAPs [18] and the simplest of these wavelets is db2, db2 is adopted as the mother wavelet. At the same time, Martha Flanders (2002) [18] pointed out that the length of the db2 at the forth level resolution was approximately the length of a MUAP. 4. THE ERROR DECISION RATE BASED ON BAYES DECISION Let ω1 and ω2 be the two classes (FS and FP ASEMG signal patterns) to which our patterns belong. Feature vector x represents an unknown pattern. The Bayes rule is 2 1 (/)() (/) (/)( ) ii i ii i px P Px px P (10) p(ω1/x) is the ith conditional probability. p(ω1/x) is the class-conditional probability density function, see the two curves at Figure 3. p(ωi)is priori probability. In this paper, p(ω1)=p(ω2)=1/2. The Bayes classification rule can be stated as If p(ω1/x)>p(ω2/x), x is classified to ω1 If p(ω1/x)<p(ω2/x), x is classified to ω2 If the straight line at x0 is the threshold partitioning the feature space into regions: R1 and R2 (see Figure 3), all values of x in R1 are classified as w1, and all values of x in R2 are classified as w2. It is obvious that decision errors are unavoidable. The total probability, Pe, of committing a decision error is given by 0 11 21 22 (/)(/ ) o x ex Ppxdxpx dx effectively recognize FS and FP patterns than other (11) which is equal to the total shaded area under the curves in Figure 4. So the error decision rate is calcu- lated by 100% ee RP (12) 5. RESULT Some WCE(n) were chosen to form WCE feature vector, which was used to distinguish FS surface EMG signals from FP surface EMG signals. It was found that the WCE feather vector consisted of WCE(7) (187.25Hz, 218.75Hz) and WCE(8) (218.75Hz, 250Hz) can more Figure 4. Example of the two regions R1 and R2 formed by the Bayesian classifier for the case of two classes. The straight line at x0 is a threshold of R1 and R2. p(x/w1) and p(x/w2) are re- spectively the class-conditional probability density function at regions: R1 and R2. Figure 5. The error decision rate based on bayes decision VS WCE feature vector. Therefore, WCE(7) and WCE(8) the sampling points of initial signal. were chosen to constitute a 2 dimensionality WCE fea- ture. Based on Bayes decision, both WCE feature and WPT feature were employed to recognize FP and FS surface EMG signal. Figure 5 depicted the error identi- fication rate vs. initial signal sampling points. The curves on Figure 5 were the real error decision rate to the sampling points. With the increasing of the sampling points, the signal undoubtedly included more and more feature information, so the error decision rate decreased with the increasing of the sampling points. However, from Figure 5, we found another result that the WCE feature performed better than the WPT feature. When the sampling points were between 200 and 500, the error decision rate by the WCE features was lower than by the SciRes Copyright © 2009  X. Hu et al. / HEALTH 1 (2009) 121-126 http://www.scirp.org/journal/HEALTH/ 125 6. DISCUSSION In pattern recognition [19], a feature vector was insisted efficients matric D (s Find some orthonormal matrix P in Y = PD such that C 0 Openly accessible at WPT features. Furthermore, when the sampling points was above 350, the error decision rate by the WCE features was almost 0. of some features. The number of the features in the fea- ture vector was called as dimensionality. In general cases, whether one pattern of signal could be effectively and accurately identified depended much upon two important factors. One was a set of optimal features. A set of de- sired features not only contain the characteristic in- formation which characterize one pattern of signals, but also ignore the particular information, which only ex- isted in some individual signals or sometime might be the result of noisy measurements, and the general in- formation, which exist in all pattern signals. From the results in this paper, both WCE feature and WPT feature could capture the characteristic information of one pat- tern of surface EMG signal. In this paper, wavelet packet co ee Eq.7) can be rewrote as a 16X63 matric (1), (2),..., (63)dd d 11 1 22 2 16 1616 (1), (2),..., (63) ... (1), (2),..., (63) dd d D dd d Y, the covariance matrix of Y, is a diagonal matrix. 1 2 3 63 00...0 00... ... 0 00 000... T YD CPCP Here, the rows of P are the principal components of D. C bigg fo (13) D is the covariance matrix of D.λ1>λ2>λ3>…. According to the following criterion, eight er λ i rm WPT feature vector. 1 63 1 M i i i i TH Threshold When M=8, TH>0.934. If M>=9, TH increase very w usly, WPT feature vector included the inform tio from on 7. CONCLUSIONS WCE was a more effective method to extract feature 8. ACKNOWLEDGEMENTS The research was funded by the educational science program of REFERENCES 5) Relationships of EMG to effort in 09) Patterns of motor recruitment can ntiadis, L.J., Hudgins, B., Parker, P.A., Stevenson, M. .N. (1993) A new strat- nal decomposition: how can tecting the motor unit el approach for (14) egy for multifunction myoelectric control. IEEE Trans. Biomed. Eng., 40(1), 82-94. [7] Stashuk, D. (2001) EMG sig eeny. Obvio a- a n about the whole frequency band (0Hz-500Hz). At the other hand, the WCE features were got ly two narrower FBs, so the WCE features were ra- tionally considered including less common information of surface EMG signal and noise than WPT features. The other was dimensionality reduction. There was more than one reason for the necessity to reduce the number of features to a sufficient minimum [19]. Computational complexity was the obvious and important one. The computational complexity for pattern recognition was reduced as dealing with the features in a lower dimen- sional space. In this paper, WCE feature vector only needed two features, but in WPT feature vector, we used 8 features. from surface EMG signal than the combination of WPT and principal components analysis. FS surface EMG signals could be successfully and rapidly distinguished from FP surface EMG signals by the WCE features. Guangzhou during the 11th Five-Year Plan Period (No.07B171and 07B258) and Guangdong Natural Science Fund (No. 7301261). [1] Stokes, I.A.F. (200 the trunk under isometric conditions force-increasing and decreasing effects and temporal delays. Clinical Biome- chanics, 20, 9-15. [2] Wakeling, J.M. (20 be determined using surface EMG. Journal of Electro- myography and Kinesiology, 19, 199-207. [3] Kaplanis, P.A., Pattichis, C.S., Hadjileo Roberts, V.C. (2009) Surface EMG analysis on normal subjects based on isometric voluntary contraction. Jour- nal of Electromyography and Kinesiology, 19, 157-171. [4] Lei, M., Wang, Z.Z., Feng, Z.J. (2001) Detecting nonlin- earity of action surface EMG signal. Physics Letters A, 290, 297-303. [5] Englehart, K., (1999) Classification of the myoelectric signal using time-frequency based representations. Medical Engi- neering & Physics, 21, 431-438. [6] Hudgins, B., Parker, P., Scott, R it be accomplished and used? Journal of Electromyogra- phy and Kinesiolugy, 11 , 151-173. [8] Hu, X. and Wang, Z.Z. (2004) De ction potential from surface EMG signals based on wavelet transform, 2004 IEEE International workshop on Biomedical circuits & system, S2. 6-15. [9] Farina, D. and Merletti, R. (2001) A nov presice simulation of the EMG signal detected by surface electrodes. IEEE Trans. Biomed. Eng., 48(6), 637-646. [10] Merletti, R. and Torino, P.D. (1999) Standards for Re- SciRes Copyright © 2009  X. Hu et al. / HEALTH 1 (2009) 121-126 SciRes Copyright © 2009 http://www.scirp.org/journal/HEALTH/Openly accessible at 126 Yu Q., Liu, W.X., Qin, J. (2008) Classifi- iresolution signal ntroduc- and Wickerhauser, M.V. (1992) Entropy- porting EMG Data. Journal of Electromyography and Kinesiolugy. [11] Hu, X., Yu, P., cation of Surface EMG Signal Based on Energy Spectra Change, 2008 International Conference on BioMedical Engineering and Informatics, 375-379. [12] Mallat, S.G. (1989) A theory for mult decomposition: the wavelet representation. IEEE Trans. Pattern Anal. Mach. Intell, 11 , 674-693. [13] Daubechies, I., Mallat, S., Willsky, A.S. (1992) I tion to the special issue on wavelet transforms and mul- tiresolution signal analysis. IEEE Trans. Inform. Theory, 38, 529-531. [14] Coifman, R.R. based algorithms for best basis selection. IEEE Trans. Inform. Theom, 38, 713–718. [15] Karlsson, S., Yu, J., Akay, M. (1999) Enhancement of spectral analysis of myoelectric signals during static con- tractions using wavelet methods. IEEE Trans. Biomed. Eng., 46, 670-684. [16] Flanders, M. (2002) Choosing a wavelet for single-trial EMG. Journal of Neuroscience Methods, 116, 165 -177. [17] Englehart, K. and Hudgins, B. (2003) A robust, real-time control scheme for multi-function myoelectric control. IEEE Trans. Biomed. Eng., 50(7), 848-854. [18] Flanders, M. (2002) Choosing a wavelet for single-trial EMG. Journal of Neuroscience Methods, 116, 165-177. [19] Sameer, S., Nabeel, M., Walter, K. (2001) Advances in pattern recognition. Springer.
|