Open Access Library Journal
Vol.03 No.09(2016), Article ID:70962,9 pages
10.4236/oalib.1103049
An Application of Bootstrapping in Logistic Regression Model
Isaac Akpor Adjei1*, Rezaul Karim2
1Department of Mathematics, Kwame Nkrumah University of Science and Technology, Kumasi, Ghana
2Department of Statistics, Jahangirnagar University, Savar, Bangladesh

Copyright © 2016 by authors and Open Access Library Inc.
This work is licensed under the Creative Commons Attribution International License (CC BY 4.0).
http://creativecommons.org/licenses/by/4.0/


Received: September 8, 2016; Accepted: September 25, 2016; Published: September 28, 2016
ABSTRACT
Computer intensive methods have recently been intensively studied in the field of mathematics, statistics, physics, engineering, behavioral and life sciences. Bootstrap is a computer intensive method that can be used to estimate variability of estimators, estimate probabilities and quantile related to test statistics or to construct confidence intervals, explore the shape of distribution of estimators or test statistics and to construct predictive distributions to show their asymptotic behaviors. In this paper, we fitted the classical logistic regression model, and performed both parametric and non-parametric bootstrap for estimating confidence interval of parameters for logistic model and odds ratio. We also conducted test of hypothesis that the prevalence does not depend on age. Conclusions from both bootstrap methods were similar to those of classical logistic regression.
Subject Areas:
Applied Statistical Mathematics, Statistics
Keywords:
Nonparametric Bootstrap, Parametric Bootstrap, Logistic Regression, Confidence Interval, Test of Hypothesis

1. Introduction
Knowing the distribution of test statistic of random sample drawn from population of interest provides clues as to the methods to be employed in analyzing such data. Statisticians normally have to make decision on the nature of the distribution for the population of which the sample was obtained. A good guess of the nature of the population distribution leads to powerful test. However, high price is paid if the assumption of the distribution is wrong. Under normal circumstances it is not possible to validate the distribution of sample by re-sampling from given population due to high cost of implementation. It is very important to consider other methods of analyzing data, which are flexible with the choice of the distribution and based on this, bootstrap methods was introduced.
Bootstrap methods are computer-based methods for assessing measures of accuracy to statistical estimates like sample mean and standard errors (Efron and Tibshirani, 1994 [1] ). The general idea is based on re-sampling from a given sample. There are three types of bootstrap: non-parametric bootstrap which does not assume any distribution of the population; semi-parametric bootstrap, which partly has an assumption on the distribution on parameter and whose residuals have no distributional assumption; and finally parametric bootstrap which assumes a particular distribution for the sample at hand. In this paper parametric and non-parametric bootstrap are considered for the given dataset.
Objectives
The aims of this paper are to formulate a logistic regression model and estimate the probability of infection as function of age using a Generalized Linear Model for binary data, construct 95% confidence intervals for the unknown parameters of the model and test the hypothesis that the prevalence does not depend on age using both classical and bootstrap (non-parametric and parametric) methods.
2. Methodology
2.1. Data
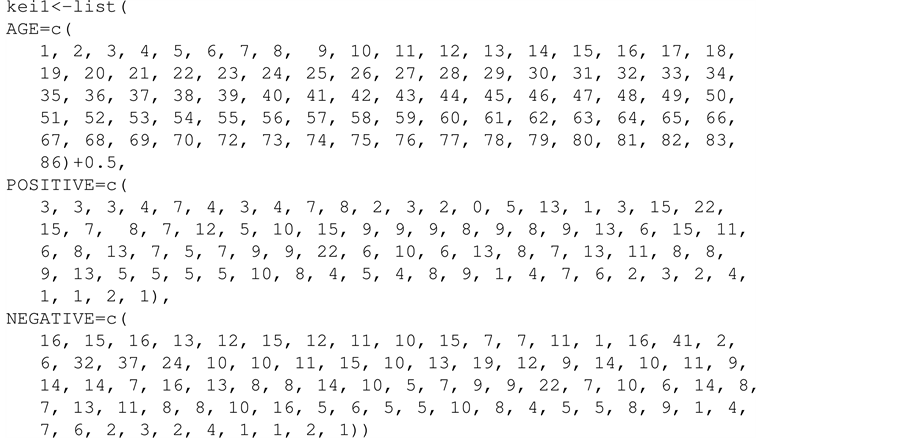
The dataset Keil (see Appendix), is a serological data of Hepatitis A from Bulgaria. It contains information about the age of the subject (in age group of one year), the number of seropositive (number of infected by hepatitis A), and sample size at each are group.
2.2. Logistic Regression Model
Bootstrapping is rapidly becoming a popular alternative tool to estimate parameters and standard errors for logistic regression model (Ariffin and Midi, 2012 [2] ). Fitrianto and Cing (2014) [3] asserts that logistic regression is a popular and useful statistical method in modeling categorical dependent variable. Logistic regression is a statistical modeling approach used to investigate the relationship between the independent variable(s) and dichotomous dependent variable (Kleinbaum and Klein, 2010 [4] ). In this section, the response variable of interest is the number of infected ( ) with Hepatitis A where
 .
.  is considered as covariate. The logistic regression model for binary response variable takes the form
 (1)
(1)
where  is the proportion of Hepatitis A infection and
  is the effect of
  on the log odds of prevalence of infection. The
  and
and  are unknown parameters to be estimated with 95% confidence intervals and a test of hypothesis
  by classical (Agresti and Kateri, 2011 [5] ) and bootstrap methods are performed.
2.3. Parametric Bootstrap
In applications where the standard asymptotic theory does not hold, the null reference distribution can be obtained through parametric bootstrapping (Reynolds and Templin, 2004 [6] ). Here a parametric model is fitted to the data, often by maximum likelihood, and random samples are drawn from this fitted model. Then the estimates of interest are computed from these data. This sampling process is repeated many times. The use of a parametric model at the sampling stage of the bootstrap methodology leads to procedures which are different from those obtained by applying basic statistical theory to inference for the same model.
Parametric bootstrap confidence interval
Using an algorithm by (Zoubir and Iskander, 2004 [7] ; Carpenter and Bithell, 2000 [8] ), a parametric bootstrap confidence interval is obtained as follows:
1) Estimate parameters ( and
and ) of logistic model (1) using the observed data and estimate
 :
:
 (2)
(2)
2) Draw bootstrap sample  where
where  for (
for ( ).
).
3) For each  estimate the bootstrap sample statistics
  where
where  by refitting model (1).
4) Estimate the bootstrap mean and standard error of .
.
 (3)
(3)
5) Estimate  bootstrap confidence interval by finding quantile of bootsrap replicates
 (4)
(4)
2.4. Non-Parametric Bootstrap
The non-parametric bootstrap belongs to the general sub-field non-parametric statistics that is defined by (Dudewicz, 1976 [9] ) as the sub-field of statistics that provides statistical inference procedures, which rely on weaker assumptions (or no assumptions at all) about the underlying distribution of the population. Statistical practitioners should use non-parametric procedures only in so far as the assumptions about the underlying distribution are seriously doubtful in their validity. Efron (1979) [10] states that the bootstrap is a way to pull oneself up (from an unfavorable situation) by ones bootstrap, to provide trustworthy answers despite of unfavorable circumstances. However, when assumptions are not violated, non-parametric procedures will usually have greater variance (in point estimation), less power (in hypothesis testing), wider intervals (in confidence interval estimation), lower probability of correct selection (in ranking and selection) and higher risk (in decision theory) when compared to a corresponding parametric procedure (Efron and Tibshirani, 1994 [1] ).
The idea called substitution principle or the plug-in rule gives explicit recognition of the fact that frequentist inference involves replacement of an unknown probability distribution by an estimate. In the simplest setting a random sample is available and the nonparametric estimate is the empirical distribution function, while a parametric model with a parameter of fixed dimension is replaced by its maximum likelihood estimate (Davison et al., 2003 [11] ).
Non-Parametric bootstrap confidence interval
Using a procedure proposed by (Zoubir and Iskander, 2004 [7] ; Carpenter and Bithell, 2000 [8] ), an algorithm for non-parametric confidence interval can be written as follows:
1) Make a new dataset for binary response with covariate(s)  from group data.
2) Draw bootstrap sample by sampling the pairs with replacements from new the dataset  for (
for ( ).
).
3) For each  estimate the bootstrap sample statistics
  where
where  by refitting model (1).
4) Estimate the bootstrap mean and standard error of .
.
 (5)
(5)
5) Estimate  bootstrap confidence interval by finding quantile of bootstrap replicates
 (6)
(6)
2.5. Bootstrap Test
In many applications, significance testing can be used to assess the plausibility of certain hypothesis. The likelihood ratio test, the score test and the Wald test are three asymptotically equivalent test procedures. For regular cases, their null distribution is a  distribution with the appropriate degrees of freedom. This
  distribution is an approximate null distribution. The true null distribution converges to the
  distribution as the sample size tends to infinity. It is not always clear whether this approximation is accurate enough or even valid in all cases. The bootstrap can offer an alternative way to determine an approximate null distribution. The bootstrap based null distribution also improves as the sample size increases, but there are theoretical and simulation results showing that it is often at least as accurate as its
  counterpart (Davison and Hinkley, 1997 [12] ). The bootstrap mechanism should reflect the original data generation mechanism and the bootstrap simulation should satisfy the null hypothesis. The idea is to generate (repeatedly) new bootstrap data, reflecting the null hypothesis, recalculate the test statistic and in this way to simulate the null distribution of the test statistic. These bootstrap test values can then be used to compute a p-value.
2.5.1. Parametric Bootstrap for Test of Hypothesis
The algorithm for parametric test of hypothesis given by (Fox, 2015 [13] ) is as follows:
1) Estimate parameters ( and
and ) of logistic model (1) using the observed data and calculate observed (
 ) test statistic
 . Let
. Let .
.
2) Estimate  under the
 (7)
(7)
3) Draw bootstrap sample  where
where  for (
for ( ).
).
4) For each  estimate the bootstrap sample statistics
  where
where  by refitting model (1).
5) Calculate bootstrap P-value by
 (8)
(8)
where # represent the number of times.
2.5.2. Non-Parametric Bootstrap for Test of Hypothesis
An algorithm for non-parametric test of hypothesis given by (Fox, 2015 [13] ) is as follows:
1) Make a new dataset for binary response with covariate(s)  from group data.
2) Estimate parameters ( and
and ) of logistic model (1) using the observed data and calculate observed (
 ) test statistic
 . Let
. Let .
.
3) By fixing x, draw bootstrap sample by sampling from only y with replacements form new dataset  for (
for ( ). This breaks the correlation between x and y.
4) For each  estimate the bootstrap sample statistics
  where
where  by refitting model (1).
5) Calculate bootstrap P-value by
 (9)
(9)
where # represent the number of times.
3. Results
3.1. Logistic Regression Model
The parameter estimates together with standard errors (s.e) and confidence intervals (C.I) by logistic model (1) using classical approach are shown in Table 1. It is observed that per year increase in age increases the log odds of infection by 0.0838. This result is statistically highly significant with  at 5% level of significance. The 95% confidence interval for the odds ratio of the effect of age is (1.0735, 1.1015). This means the odds of infection increased about 7% to 10%.
3.2. Parametric Bootstrap
Results obtained from the logistic model (1) by parametric bootstrap are shown in Table 2. This results lead to similar conclusion from classical method. The estimated odds ratio obtained is 1.088. The confidence interval depicts the odds of infection increases about 7% to 10%.
3.3. Non-Parametric Bootstrap
The parameter estimates together with standard errors (s.e) and confidence intervals (C.I) of the logistic model (1) by using non-parametric bootstrap approach are presented in Table 3. These results lead to similar conclusion as in the case of classical and parametric bootstrap methods. The estimated odds ratio obtained by this approach is also is 1.088. This also means with regards to the confidence interval, the odds of infection increased about 7% to 10%.
3.4. Comparisons: Classical and Bootstrap Parameter Estimates
From Tables 1-3, it can be observed that the parameter estimates are very close. The standard errors of estimates for parametric bootstrap were slightly smaller compared to that of non-parametric bootstrap but very close to that obtained from classical approach. This is due to the fact that in both Classical and Parametric bootstrap methods,

Table 1. Parameter estimates of logistic model using GLM.
Table 2. Confidence intervals and p-value by parametric bootstrap.
Table 3. Confidence intervals and p-value by non-parametric bootstrap.
the design matrix for the covariate  was fixed.
The P-values obtained for testing hypothesis  by both Non-Parametric and Parametric methods are shown in Table 2 and Table 3 respectively. It is observed that in both situations, the effect of age is highly significant.
Comparing the length of confidence intervals for the three methods, it was observed that the interval length for non-parametric method is wider compared to that of classical and parametric methods. The classical and that of parametric methods have similar interval length.
The 95% confidence intervals for predicted prevalence by using both parametric and non-parametric methods are presented in Figure 1 and Figure 2 respectively. It can generally be concluded that the probability for infection increases with age. The length of the interval reduces with increase in Age. This means prediction for higher age is more precise.

Figure 1. The 95% point wise confidence intervals for the predicted values of the prevalence by using parametric bootstrap.
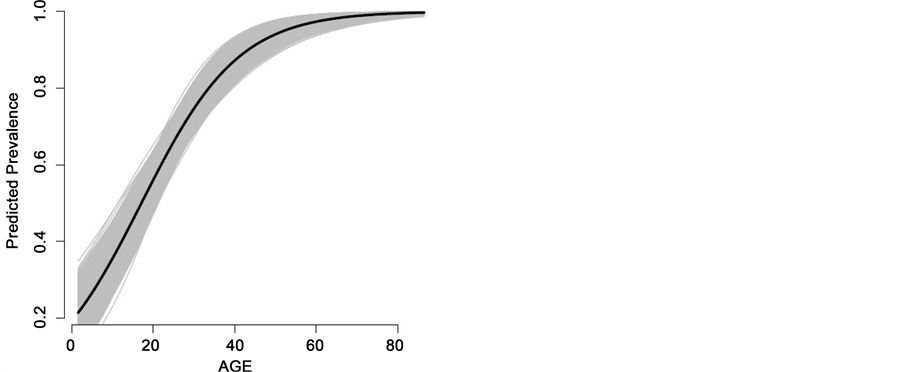
Figure 2. The 95% point wise confidence intervals for the predicted values of the prevalence by using non-parametric bootstrap.
4. Conclusions
The bootstrap technique used for estimation and testing produced flexible results. Most of the results were similar to the classical results established under probability theory.
From the classical logistic regression model estimates, it was observed that the prevalence of Hepathitis A infection increased with age. Parametric and non-parametric methods used to investigate the effect of age gave similar results.
We conclude that this computer intensive method gives us an idea about the asymptotic behavior of estimators and also it is easy in implementation based on simulations.
Cite this paper
Adjei, I.A. and Karim, R. (2016) An Application of Boots- trapping in Logistic Regression Model. Open Access Library Journal, 3: e3049. http://dx.doi.org/10.4236/oalib.1103049
References
- 1. Efron, B. and Tibshirani, R.J. (1994) An Introduction to the Bootstrap. Chapman and Hall/CRC, UK.
- 2. Ariffin, S.B. and Midi, H. (2012) Robust Bootstrap Methods in Logistic Regression Model. 2012 International Conference on Statistics in Science, Business, and Engineering (ICSSBE), Langkawi, 10-12 September 2012, 1-6.
http://dx.doi.org/10.1109/ICSSBE.2012.6396613 - 3. Fitrianto, A. and Cing, N.M. (2014) Empirical Distributions of Parameter Estimates in Binary Logistic Regression Using Bootstrap. International Journal of Mathematical Analysis, 8, 721-726.
http://dx.doi.org/10.12988/ijma.2014.4394 - 4. Kleinbaum, D.G. and Klein, M. (2010) Modeling Strategy Guidelines. In: Logistic Regression, Part of the Series Statistics for Biology and Health, Springer, Berlin, 165-202.
http://dx.doi.org/10.1007/978-1-4419-1742-3_6 - 5. Agresti, A. and Kateri, M. (2011) Categorical Data Analysis. Springer, Berlin.
http://dx.doi.org/10.1007/978-3-642-04898-2_161 - 6. Reynolds, J.H. and Templin, W.D. (2004) Comparing Mixture Estimates by Parametric Bootstrapping Likelihood Ratios. Journal of Agricultural, Biological, and Environmental Statistics, 9, 57-74.
http://dx.doi.org/10.1198/1085711043145 - 7. Zoubir, A.M. and Iskander, D.R. (2004) Bootstrap Techniques for Signal Processing. Cambridge University Press, Cambridge.
http://dx.doi.org/10.1017/CBO9780511536717 - 8. Carpenter, J. and Bithell, J. (2000) Bootstrap Confidence Intervals: When, Which, What? A Practical Guide for Medical Statisticians. Statistics in Medicine, 19, 1141-1164.
http://dx.doi.org/10.1002/(SICI)1097-0258(20000515)19:9<1141::AID-SIM479>3.0.CO;2-F - 9. Dudewicz, E.J. (1976) Introduction to Statistics and Probability. Holt, Rinehart and Winston, New York.
- 10. Efron, B. (1979) Bootstrap Methods: Another Look at the Jackknife. The Annals of Statistics, 7, 1-26.
http://dx.doi.org/10.1214/aos/1176344552 - 11. Davison, A.C., Hinkley, D.V. and Young, G.A. (2003) Recent Developments in Bootstrap Methodology. Statistical Science, 18, 141-157.
http://dx.doi.org/10.1214/ss/1063994969 - 12. Davison, A.C. and Hinkley, D.V. (1997) Bootstrap Methods and Their Application, Volume 1. Cambridge University Press, Cambridge.
http://dx.doi.org/10.1017/CBO9780511802843 - 13. Fox, J. (2015) Applied Regression Analysis and Generalized Linear Models. Sage Publications, Thousand Oaks, California.
Appendix
Dataset

Submit or recommend next manuscript to OALib Journal and we will provide best service for you:
Publication frequency: Monthly
9 subject areas of science, technology and medicine
Fair and rigorous peer-review system
Fast publication process
Article promotion in various social networking sites (LinkedIn, Facebook, Twitter, etc.)
Maximum dissemination of your research work
Submit Your Paper Online: Click Here to Submit
Or Contact service@oalib.com