 Journal of Environmental Protection, 2011, 2, 817-827 doi:10.4236/jep.2011.26093 Published Online August 2011 (http://www.SciRP.org/journal/jep) Copyright © 2011 SciRes. JEP 817 Equilibrium Isotherms and Kinetic Studies of Removal of Methylene Blue Dye by Adsorption onto Miswak Leaves as a Natural Adsorbent Taha M. Elmorsi1,2 1Chemistry Department, Faculty of Science, Jazan University, Jazan, KSA; 2Chemistry Department, Faculty of Science, Al-Azhar University, Cairo, Egypt. Email: taha_elmorsi@yahoo.com Received May 12th, 2011; revised June 24th, 2011; accepted July 29th, 2011. ABSTRACT In this research miswak leaves, agriculture wastes, available in large quantity in Saudi Arabia, was used as low-cost adsorbent for removing methylene blue (MB) dye. Equilibrium behavior of miswak leaves was investigated by perform- ing batch adsorption experiments. The effects of [MB] 0, pH, contact time and adsorbent dose were evaluated. An alka- line pH (10.6) was favorable to the adsorption of MB dye. Adsorption isotherm models, Langmuir, Freundlich and Temkin were used to simulate the equilibrium data. Langmuir equation was found to have the highest value of R2 com- pared with other models. Furthermore, it was found that miswak leaves have a high adsorptive capacity towards MB dye (200 mg/g) and show favorable adsorption of MB dye with separation factor (RL < 1). In addition, pseudo-first- order, pseudo-second order and intra-particle diffusion were used to study the kinetics of MB adsorption onto miswak leaves. Adsorption process undergoes pseudo-second order kinetic as proved by the high value of R2 and the low value of sum of squared error (SSE percentage). Results indicated that intra-particle diffusion is not the limiting step, and the adsorption process is spontaneous as indicated by the negative value of the G . Keywords: Miswak Leaves, Salvadora Persica, Methylene Blue, Adsorption Isotherms, Adsorption Kinetics 1. Introduction Presence of many pollutants in water and wastewater has increased recently due to high increase in various industrial activities. Using dyes in many industries [1] such as textile, paper, plastics, leather, food and cos- metic, represent a large group of chemicals that get mixed in wastewater among many aqueous pollutants. In recent years, there is a dramatic increase in the an- nual production of different synthetic dyes representing more than 10,000 dyes [2]. Many azo dyes and their intermediates have toxic effects on environment and human health due to their carcinogenicity and visi- bility [3]. It was reported that incomplete degradation of dyes by bacteria in the sediment resulted in produc- tion of some carcinogenic and harmful amines [4]. In addition, presences of color substances in the water body may decrease the light transmission which de- creasing the photosynthesis activity, leading to de- crease growth of bacteria and hence decreasing the bio- degradation of impurities in water [5]. Methylene blue dye (MB), is basic dye has been extensively used in textiles and printing industry, and it has been found as non-biodegradable dye. Therefore, it is essential that wastewater contaminated with MB dye to be given some treatments before discharge. Many treatment techniques have been applied to a broad range of water and wastewater contaminated with dyes including physical- or chemical-treatment processes [6]. These include chemical coagulation/flo- cculation [7,8], ozonation, oxidation, photodegradation [9], ion exchange, irradiation, precipitation and ad- sorption. Several critical reviews on current treatment technologies were reported [10]. Many of these tech- niques are costly, required various tools and have limi- tations. It has been reported that the adsorption onto activated carbon, have proven to be the most efficient and reliable method for the removal many pollutants, including different dyes [7]. Although commercial acti- vated carbon is very effective adsorbent, its high cost requires the search for alternatives and low-cost adsor- bents [11]. Several low-cost adsorbents have been 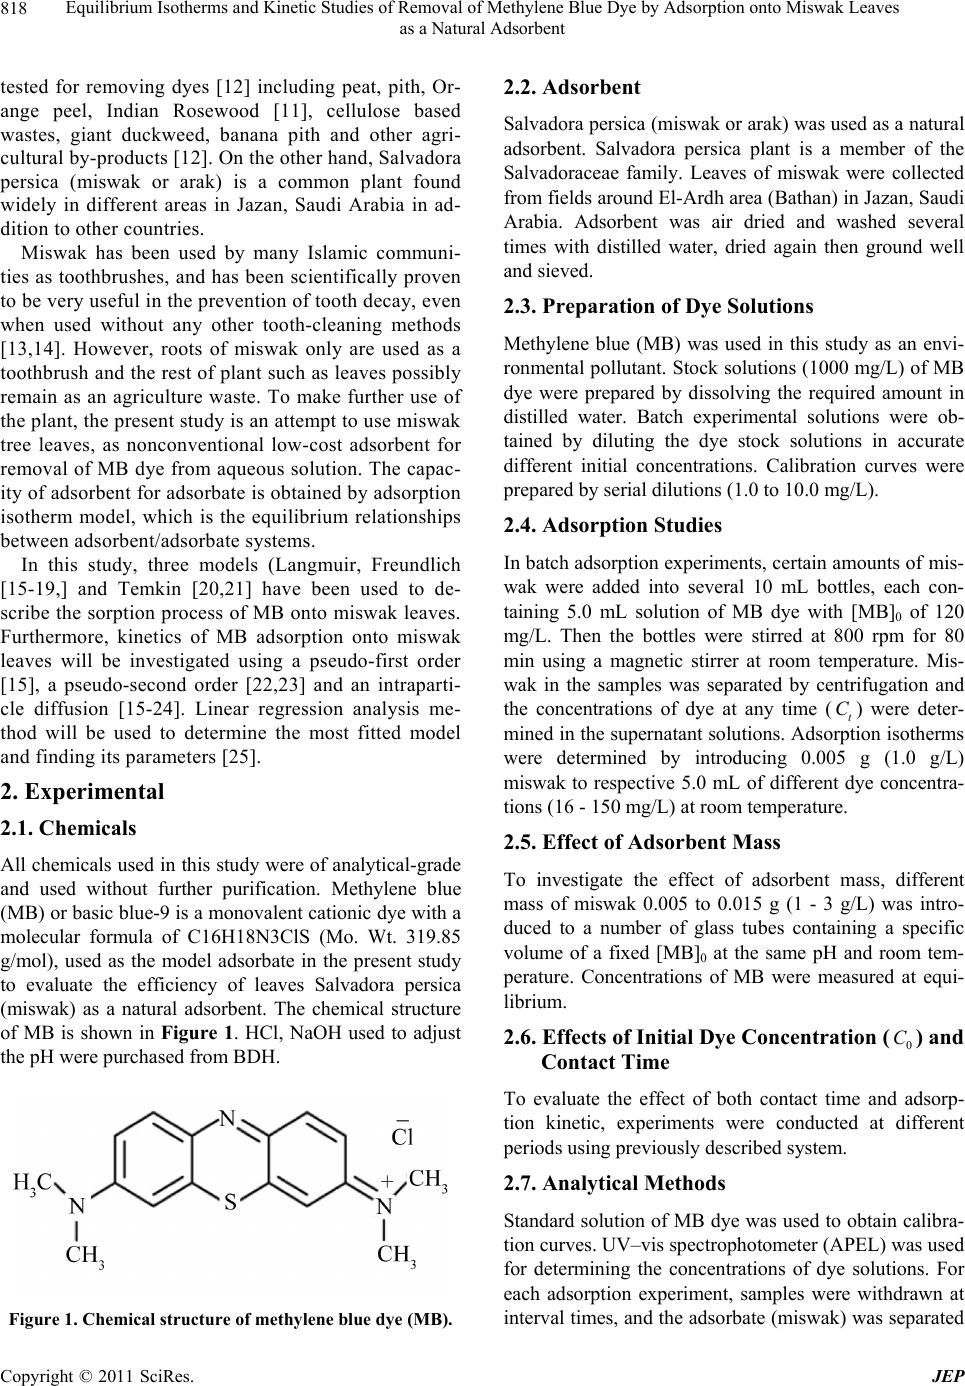 Equilibrium Isotherms and Kinetic Studies of Removal of Methylene Blue Dye by Adsorption onto Miswak Leaves 818 as a Natural Adsorbent tested for removing dyes [12] including peat, pith, Or- ange peel, Indian Rosewood [11], cellulose based wastes, giant duckweed, banana pith and other agri- cultural by-products [12]. On the other hand, Salvadora persica (miswak or arak) is a common plant found widely in different areas in Jazan, Saudi Arabia in ad- dition to other countries. Miswak has been used by many Islamic communi- ties as toothbrushes, and has been scientifically proven to be very useful in the prevention of tooth decay, even when used without any other tooth-cleaning methods [13,14]. However, roots of miswak only are used as a toothbrush and the rest of plant such as leaves possibly remain as an agriculture waste. To make further use of the plant, the present study is an attempt to use miswak tree leaves, as nonconventional low-cost adsorbent for removal of MB dye from aqueous solution. The capac- ity of adsorbent for adsorbate is obtained by adsorption isotherm model, which is the equilibrium relationships between adsorbent/adsorbate systems. In this study, three models (Langmuir, Freundlich [15-19,] and Temkin [20,21] have been used to de- scribe the sorption process of MB onto miswak leaves. Furthermore, kinetics of MB adsorption onto miswak leaves will be investigated using a pseudo-first order [15], a pseudo-second order [22,23] and an intraparti- cle diffusion [15-24]. Linear regression analysis me- thod will be used to determine the most fitted model and finding its parameters [25]. 2. Experimental 2.1. Chemicals All chemicals used in this study were of analytical-grade and used without further purification. Methylene blue (MB) or basic blue-9 is a monovalent cationic dye with a molecular formula of C16H18N3ClS (Mo. Wt. 319.85 g/mol), used as the model adsorbate in the present study to evaluate the efficiency of leaves Salvadora persica (miswak) as a natural adsorbent. The chemical structure of MB is shown in Figure 1. HCl, NaOH used to adjust the pH were purchased from BDH. Figure 1. Chemical structure of methylene blue dye (MB). 2.2. Adsorbent Salvadora persica (miswak or arak) was used as a natural adsorbent. Salvadora persica plant is a member of the Salvadoraceae family. Leaves of miswak were collected from fields around El-Ardh area (Bathan) in Jazan, Saudi Arabia. Adsorbent was air dried and washed several times with distilled water, dried again then ground well and sieved. 2.3. Preparation of Dye Solutions Methylene blue (MB) was used in this study as an envi- ronmental pollutant. Stock solutions (1000 mg/L) of MB dye were prepared by dissolving the required amount in distilled water. Batch experimental solutions were ob- tained by diluting the dye stock solutions in accurate different initial concentrations. Calibration curves were prepared by serial dilutions (1.0 to 10.0 mg/L). 2.4. Adsorption Studies In batch adsorption experiments, certain amounts of mis- wak were added into several 10 mL bottles, each con- taining 5.0 mL solution of MB dye with [MB]0 of 120 mg/L. Then the bottles were stirred at 800 rpm for 80 min using a magnetic stirrer at room temperature. Mis- wak in the samples was separated by centrifugation and the concentrations of dye at any time (t) were deter- mined in the supernatant solutions. Adsorption isotherms were determined by introducing 0.005 g (1.0 g/L) miswak to respective 5.0 mL of different dye concentra- tions (16 - 150 mg/L) at room temperature. C 2.5. Effect of Adsorbent Mass To investigate the effect of adsorbent mass, different mass of miswak 0.005 to 0.015 g (1 - 3 g/L) was intro- duced to a number of glass tubes containing a specific volume of a fixed [MB]0 at the same pH and room tem- perature. Concentrations of MB were measured at equi- librium. 2.6. Effects of Initial Dye Concentration (0 C) and Cont valuate the effec act Time To et of both contact time and adsorp- sed to obtain calibra- tion kinetic, experiments were conducted at different periods using previously described system. 2.7. Analytical Methods Standard solution of MB dye was u tion curves. UV–vis spectrophotometer (APEL) was used for determining the concentrations of dye solutions. For each adsorption experiment, samples were withdrawn at interval times, and the adsorbate (miswak) was separated Copyright © 2011 SciRes. JEP 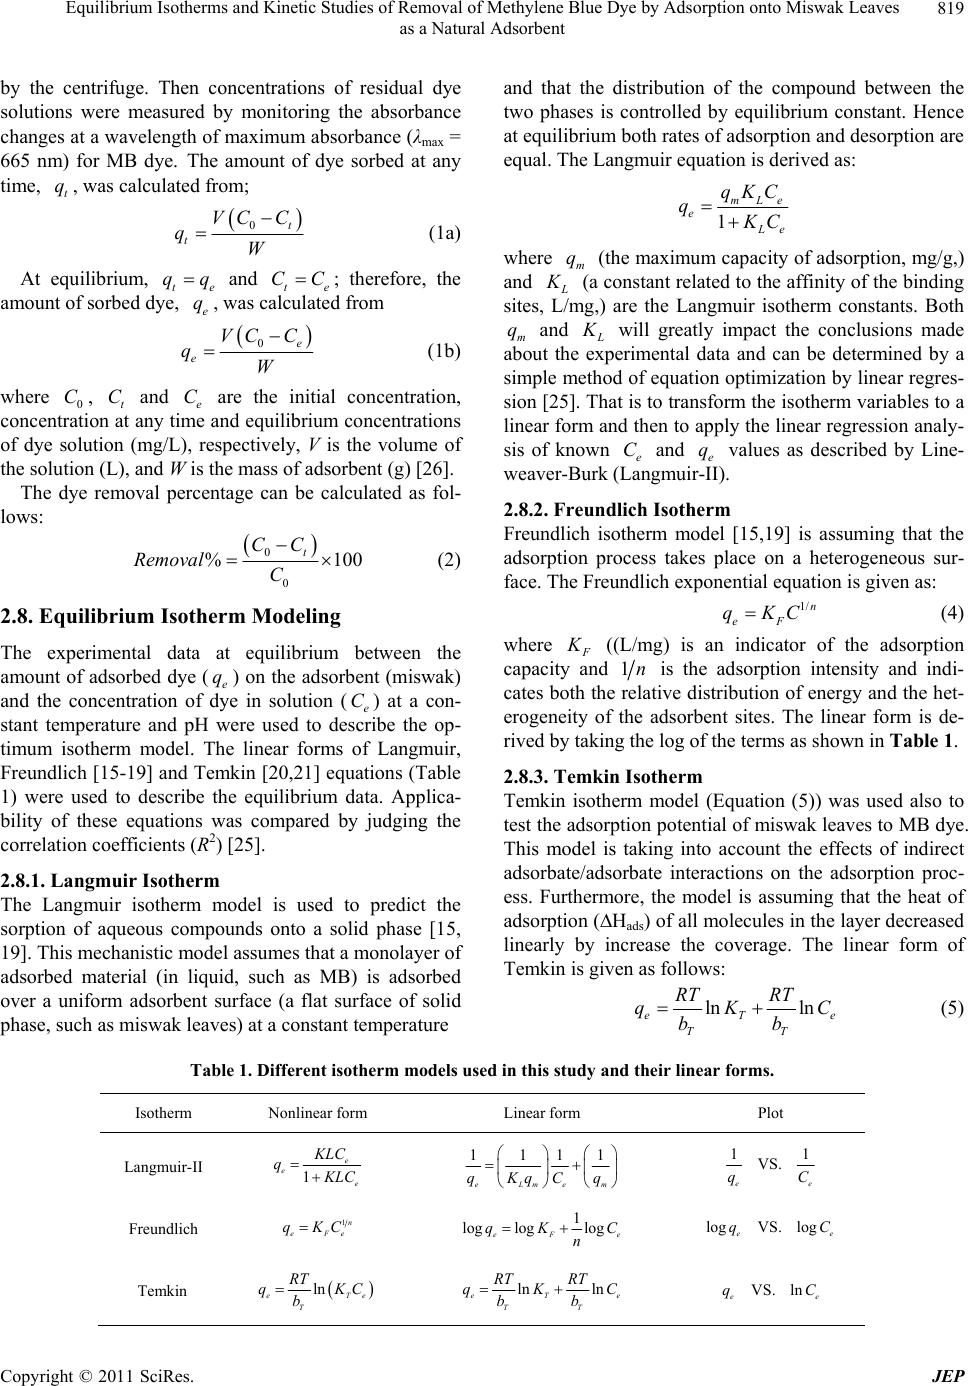 Equilibrium Isotherms and Kinetic Studies of Removal of Methylene Blue Dye by Adsorption onto Miswak Leaves as a Natural Adsorbent Copyright © 2011 SciRes. JEP 819 by the centrifuge. Then concentrations of residual dye solutions were measured by monitoring the absorbance changes at a wavelength of maximum absorbance (λmax = 665 nm) for MB dye. The amount of dye sorbed at any time, t q, was calculated from; 0t t VCC qW (1a) At equilibrium, and ; therefore, the am te qq e, e q, te CC alculated ount of sorbed dy was c from 0e e VC C qW (1b) where , and are the initial concentration, lo 0 C tration t C at e C me concen any tiand equilibrium concentrations of dye solution (mg/L), respectively, V is the volume of the solution (L), and W is the mass of adsorbent (g) [26]. The dye removal percentage can be calculated as fol- ws: 0 0 %1 t CC Removal C 00 (2) 2.8. Equilibrium Isotherm Modeling between the del is used to predict the The experimental data at equilibrium amount of adsorbed dye (e q) on the adsorbent (miswak) and the concentration of de in solution (e C) at a con- stant temperature and pH were used to describe the op- timum isotherm model. The linear forms of Langmuir, Freundlich [15-19] and Temkin [20,21] equations (Table 1) were used to describe the equilibrium data. Applica- bility of these equations was compared by judging the correlation coefficients (R2) [25]. 2.8.1. Langmuir Isotherm y The Langmuir isotherm mo sorption of aqueous compounds onto a solid phase [15, 19]. This mechanistic model assumes that a monolayer of adsorbed material (in liquid, such as MB) is adsorbed over a uniform adsorbent surface (a flat surface of solid phase, such as miswak leaves) at a constant temperature and that the distribution of the compound between the two phases is controlled by equilibrium constant. Hence at equilibrium both rates of adsorption and desorption are equal. The Langmuir equation is derived as: 1 mLe e e qKC q C where m (the maximum capacity of adsorption, mg/g,) and q (a constant related to the affinity of the binding sites, L/mg,) are the Langmuir isotherm constants. Both m and q will greatly impact the conclusions made about the experimental data and can be determined by a simple method of equation optimization by linear regres- sion [25]. That is to transform the isotherm variables to a linear form and then to apply the linear regression analy- sis of known e and e values as described by Line- weaver-Burk (Langmuir-II). C q 2.8.2. Fr eu ndlich Iso t h e r m Freundlich isotherm model [15,19] is assuming that the adsorption process takes place on a heterogeneous sur- face. The Freundlich exponential equation is given as: 1/ n eF qKC (4) where ((L/mg) is an indicator of the adsorption capacity and 1n is the adsorption intensity and indi- cates both the relative distribution of energy and the het- erogeneity of the adsorbent sites. The linear form is de- rived by taking the log of the terms as shown in Table 1. 2.8.3. Temkin Isotherm Temkin isotherm model (Equation (5)) was used also to test the adsorption potential of miswak leaves to MB dye. This model is taking into account the effects of indirect adsorbate/adsorbate interactions on the adsorption proc- ess. Furthermore, the model is assuming that the heat of adsorption (Hads) of all molecules in the layer decreased linearly by increase the coverage. The linear form of Temkin is given as follows: ln ln eT TT RT RT qK bb e C Table 1. Different isotherm models used in this study and their linear forms. Isotherm Nonlinear form Linear form Plot (5) 1 e e e LC q LC 1111 eLmem qKqCq 11 VS. ee qC Langmuir-II 1n eFe qKC 1 log loglog eF qK n Freundlich e C Temkin logVS. log ee qC ln eT T RT qK b e Cln ln eT TT RT RT qKC bb eVS. ln ee qC  Equilibrium Isotherms and Kinetic Studies of Removal of Methylene Blue Dye by Adsorption onto Miswak Leaves 820 as a Natural Adsorbent where, R is common gas constant (0.008314 kJ/mol K), T is the absolutre (K), 1is the Temkin onstant related to the heat of sorp(kJ/ml) which e temperatu/T b tion co indicates the adsorption potential (intensity) of the ad- sorbent and T (L/g) is Temkin constant related to ad- sorption capacity. The liner plots of e q versus lne C enable to determine the constants 1/T b and T from the slope and ircept respectively. 3. Results and Discussion 3.1. Effects of Initial Dye Concenttion () nte ra ded g) of MBents were conducted at a tem- the increase in [MB]0 from 120 to 150 mg/L led to slight improve in the adsorption capacity of MB onto miswak leaves. Conseqently, 120 mg/L of MB was chosen as an e and decreased The qe 0 C and Contact Time A miswak leaves dosage of 0.005 g (1.0 g/L) was ad to 0.005 L of different concentrations (16 - 150 m/L dye solution. Experim perature of 303 K for 80 min to test the effect of initial concentration and contact time on the adsorption process. The results (Figure 2) indicated that the adsorption of MB dye onto miswak increases as [MB]0 increased. At the first 10 min of the adsorption process, as [MB]0 in- creased by 9.4 times (from 16 to 150 mg/L), the ad- sorbed amount (qt) onto miswak leaves increased 6.5 times (from 6.2 to 40.0 mg/g). Also, as the contact time increased to 30 min, qt increased by about seven times (from 9.01 to 62.13 mg/g). Therefore, the adsorption of MB dye was very rapid during the first 10 min, and in- creased gradually during the second 20 min until reached equilibrium at 30 min. The results showed that the up- take of MB dye by miswak leaves depends on [MB]0 and contact time. This is because [MB]0 act as the driving force that increases the mass transfer of MB dye from aqueous solution onto the surface of miswak leaves. During the adsorption process, solutions with different initial concentrations possibly will reach equilibrium at different times. This may be due to the time required for the dye molecules to encounter the boundary layer effect, then diffuse to the surface of the adsorbent and finally diffuse to the porous structure of the adsorbent [27]. Therefore, solutions with low initial concentration (16 mg/L) reached equilibrium first at about 30 min, while solutions with high initial concentration of 150 mg/L takes longer time and reached equilibrium at 60 min. To ensure complete equilibrium of the data, adsorption sam- ples were collected at 80 min. It was noted that as [MB]0 dye increased from 16 to 150 mg/L, the removal % at equilibrium decreased by 25% (from 55.78 to 41.79%). This may be because the constant number of available sites in miswak leaves is easily saturated by the increase of [MB]0, which would lead to a decrease in the removal percentage of MB dye. Other researchers reported simi- lar trend [28,29]. Furthermore, Figure 2 indicated that optimum [MB]0 for further experiments. 3.2. Effect of Solution pH on Dye Removal Experiments were conducted at 120 mg/L [MB]0, 1.0g/L miswak leaves dose, and 80 min contact time at 303 K, to study the effect of solution pH on the equilibrium ad- sorption capacity (qe) of MB dye onto miswak leaves as shown in Figure 3. It is indicated that q of MB dye reaching a maximum in a basic medium u by decreasing the pH values in the acidic medium. of MB dye in a basic medium (at the pH range of 10.6 to 12.0) reached 60.9 mg/g and become about 13.54 at pH 2.8. Therefore, further adsorption experiments were per- formed at pH 10.6 as an optimum pH value. The varia- tions in the pH values from acidic to alkaline medium would affect the adsorption rate because both the degree of ionization of dye molecules and the surface properties of the adsorbent (miswak leaves) would vary. It is pre- viously reported that the adsorption process increased by increasing the electrostatic attraction [2]. Thus anionic dyes (dye−) are favorably adsorbed by the adsorbent at Figure 2. Effect of initial concentration and contact time on the adsorption of MB dye (T = 303 K, pHi = 10.6 miswak dosage = 1.0 g/L, [MB]i = 16 - 150mg/L, V = 0.005 L). Figure 3. Effect of pH on the adsorption process (T = 303 K, miswak dosage = 1.0g/L, [MB]i = 120mg/L, V = 0.005 L). Copyright © 2011 SciRes. JEP 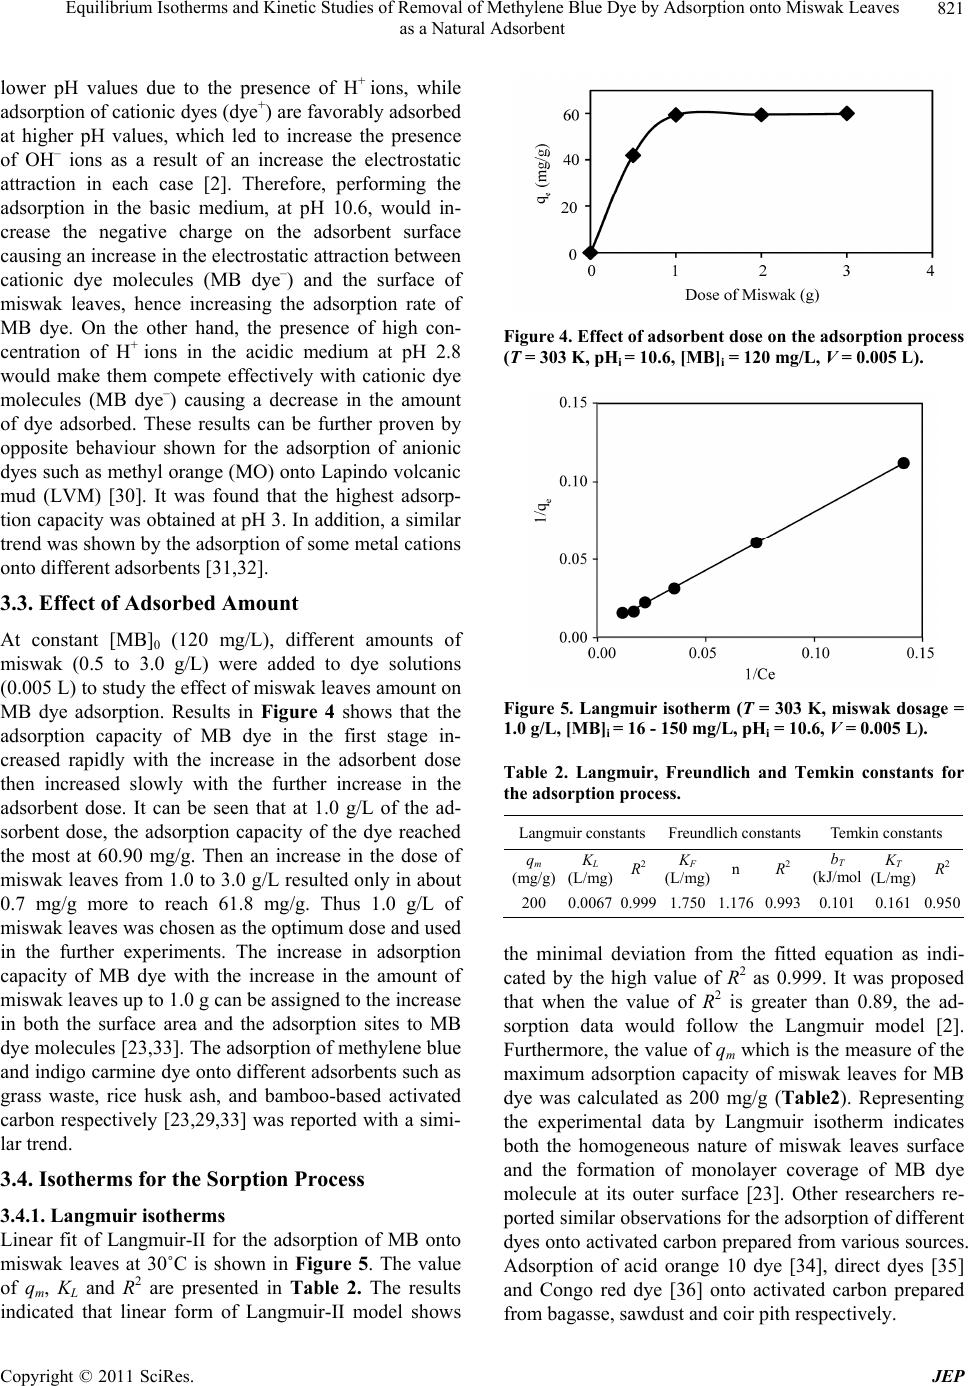 Equilibrium Isotherms and Kinetic Studies of Removal of Methylene Blue Dye by Adsorption onto Miswak Leaves 821 as a Natural Adsorbent lower pH values due to the presence of H+ ions, while adsorption of cationic dyes (dye+) are favorably adsorbed at higher pH values, which led to increase the presence of OH– ions as a result of an increase the electrostatic attraction in each case [2]. Therefore, performing the adsorption in the basic medium, at pH 10.6, would in- crease the negative charge on the adsorbent surface causing an increase in the electrostatic attraction between cationic dye molecules (MB dye–) and the surface of miswak leaves, hence increasing the adsorption rate of resulted only in about hus 1.0 g/L of MB dye. On the other hand, the presence of high con- centration of H+ ions in the acidic medium at pH 2.8 would make them compete effectively with cationic dye molecules (MB dye–) causing a decrease in the amount of dye adsorbed. These results can be further proven by opposite behaviour shown for the adsorption of anionic dyes such as methyl orange (MO) onto Lapindo volcanic mud (LVM) [30]. It was found that the highest adsorp- tion capacity was obtained at pH 3. In addition, a similar trend was shown by the adsorption of some metal cations onto different adsorbents [31,32]. 3.3. Effect of Adsorbed Amount At constant [MB]0 (120 mg/L), different amounts of miswak (0.5 to 3.0 g/L) were added to dye solutions (0.005 L) to study the effect of miswak leaves amount on MB dye adsorption. Results in Figure 4 shows that the adsorption capacity of MB dye in the first stage in- creased rapidly with the increase in the adsorbent dose then increased slowly with the further increase in the adsorbent dose. It can be seen that at 1.0 g/L of the ad- sorbent dose, the adsorption capacity of the dye reached the most at 60.90 mg/g. Then an increase in the dose of miswak leaves from 1.0 to 3.0 g/L 0.7 mg/g more to reach 61.8 mg/g. T miswak leaves was chosen as the optimum dose and used in the further experiments. The increase in adsorption capacity of MB dye with the increase in the amount of miswak leaves up to 1.0 g can be assigned to the increase in both the surface area and the adsorption sites to MB dye molecules [23,33]. The adsorption of methylene blue and indigo carmine dye onto different adsorbents such as grass waste, rice husk ash, and bamboo-based activated carbon respectively [23,29,33] was reported with a simi- lar trend. 3.4. Isotherms for the Sorption Process 3.4.1. Langmuir isotherms Linear fit of Langmuir-II for the adsorption of MB onto miswak leaves at 30˚C is shown in Figure 5. The value of qm, KL and R2 are presented in Table 2. The results indicated that linear form of Langmuir-II model shows Figure 4. Effect of adsorbent dose on the adsorption process (T = 303 K, pHi = 10.6, [MB]i = 120 mg/L, V = 0.005 L). Figure 5. Langmuir isotherm (T = 303 K, miswak dosage = 1.0 g/L, [MB]i = 16 - 150 mg/L, pHi = 10.6, V = 0.005 L). Table 2. Langmuir, Freundlich and Temkin constants for the adsorption process. Langmuir constantsFreundlich constants Temkin constants qm (mg/g) KL (L/mg) R2 KF (L/mg) n R2 bT (kJ/m KT mg) R2 ol (L/ 200 0.00670.9991.7501.176 0.993 0.101 0.1610.950 the minimal deviation from the fitted equation as indi- cated by the high value of R2 as 0.999. It was proposed that when the value of R2 is greater than 0.89, the d- the by Langmuir isotherm indicates beae ane at of monoyer coveB dye ms utc[23]. Other resrs po s yes onto activated carbon prepared from various sources. a sorption data would follow the Langmuir model [2]. urthermore, the value of qm which is the measure of F maximum adsorption capacity of miswak leaves for MB dye was calculated as 200 mg/g (Table2). Representing the experimental data oth the homogenous nature of miswk leaves surfac d th olecu form ion o la e rage of M le at iter surfaearchere- rtedimilar observations for the adsorption of different d Adsorption of acid orange 10 dye [34], direct dyes [35] and Congo red dye [36] onto activated carbon prepared from bagasse, sawdust and coir pith respectively. Copyright © 2011 SciRes. JEP 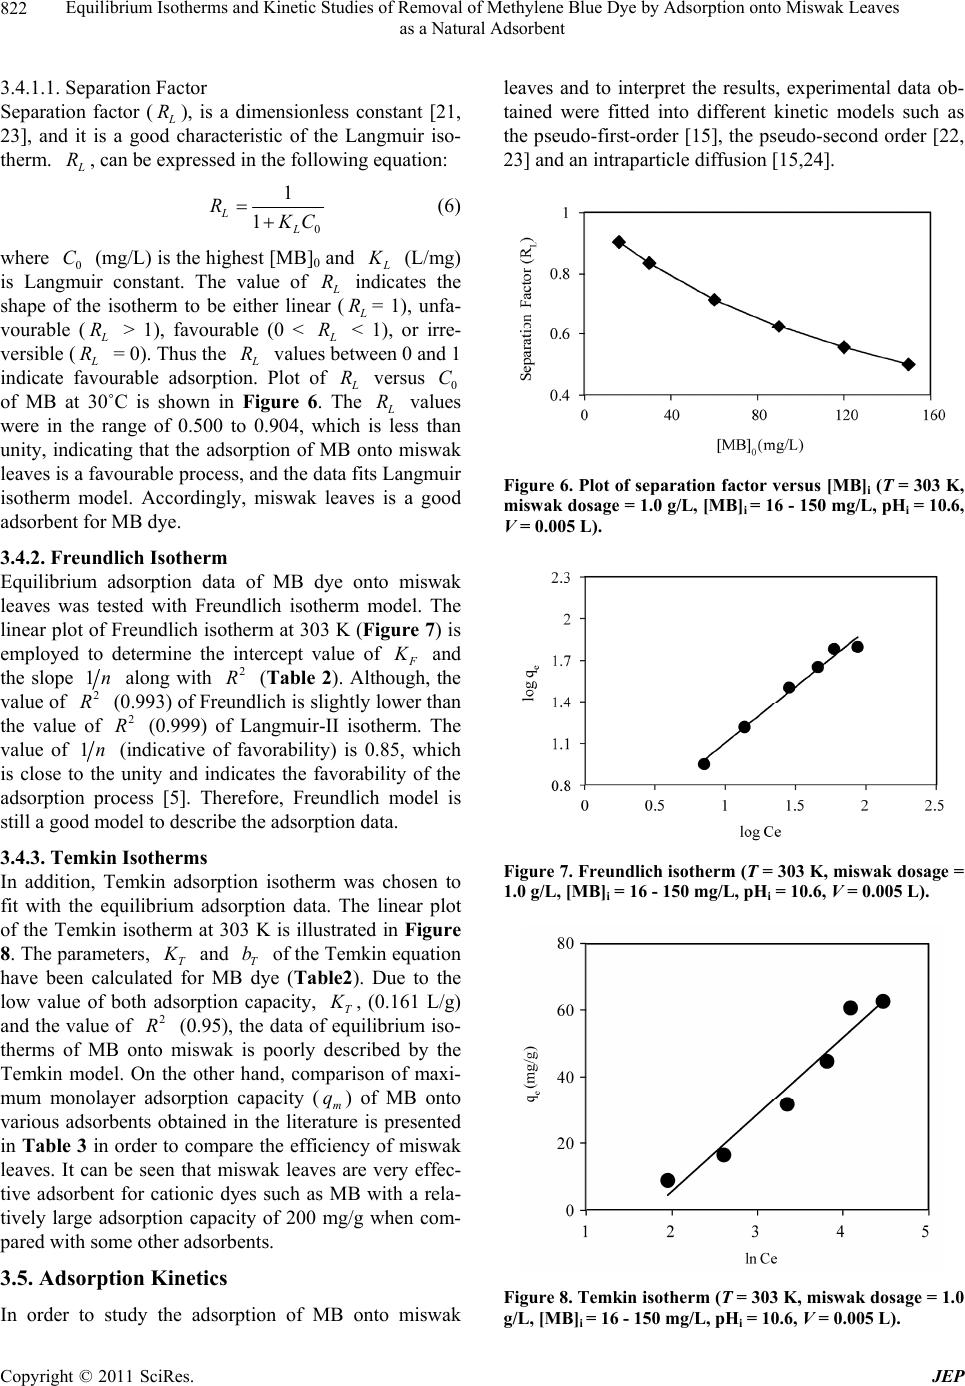 Equilibrium Isotherms and Kinetic Studies of Removal of Methylene Blue Dye by Adsorption onto Miswak Leaves 822 as a Natural Adsorbent 3.4.1.1. Separation Factor Separation factor ( R), is a dimensionless constant [21, 23], and it is a good characteristic of the Langmuir iso- therm. R, can be expressed in the following equation: 0 1 1 L L R C (6) where 0 C (mg/L) is the highest [MB]0 and (L/mg) is Langmuir constant. The value of R indicates the shape of the isotherm to be either linear ( R= 1), unfa- vourable ( R > 1), favourable (0 < R < 1), or irre- versible ( R = 0). Thus the R values between 0 and 1 indicate favourable adsorption. Plot of R versus Figure 0 C of MB at 30˚C is shown in 6. The R val f m adsorbent for MB dye. 3.4.2. F r e u ndlich Iso t h e r m riu nto er (F o al ues were in the range 0.500 to 0.904, which is less than unity, indicating that the adsorption of MB onto miswak leaves is a favourable process, and the data fits Langmuir isothermodel. Accordingly, miswak leaves is a good o Equilibm adsorption data of MB dye o miswak leaves was tested with Freundlich isothm model. The linear plot of Freundlich isotherm at 303 Kigure 7) is employed tdetermine the intercept vue of and the slope 1n along with R(Table 2). Although, the value of 2 R (0.993) of Freundlich is sligy lower th the value of 2 R (0.999) of Langmuir-II isotm. The value of 2 htl an her 1n (indicative of favorability) is 0.85, which is close to the unity and indicates the favorability of the adsorption process [5]. Therefore, Freundlich model is still a good model to describe the adsorption data. 3.4.3. Temkin Isotherms n isotherm was chosen to In addition, Temkin adsorptio fit with the equilibrium adsorption data. The linear plot of the Temkin isotherm at 303 K is illustrated in Figure 8. The parameters, T and T b of the Temkin equation have been calculated for MB dye (Table2). Duo the low value of both adsorptioapacity, T e t n c , (0.161 L/g) and the ve of 2 R (0.95), the data of equilibrium iso- therms of MBnto miswak is poorly described by the Temkin mel. On the other hand, comparison of maxi- mum monolayer adsorption capacity (m q) of MB onto various adsorbents obtained in the literature is presented in Table 3 in order to compare the efficiency of mi alu o od swak iswak leaves are very effec- e in leaves. It can be seen that m tive adsorbent for cationic dyes such as MB with a rela- tively large adsorption capacity of 200 mg/g when com- pared with some other adsorbents. 3.5. Adsorption Kinetics In order to study the adsorption of MB onto miswak leaves and to interpret the results, experimntal data ob- tained were fittedto different kinetic models such as the pseudo-first-order [15], the pseudo-second order [22, 23] and an intraparticle diffusion [15,24]. Figure 6. Plot of separation factor versus [MB]i (T = 303 K, miswak dosage = 1.0 g/L, [MB]i = 16 - 150 mg/L, pHi = 10.6, = 0.005 L). V Figure 7. Freundlich isotherm (T = 303 K, miswak dosage = .0 g/L, [MB]i = 16 - 150 mg/L, pHi = 10.6, V = 0.005 L). 1 Figure 8. Temkin isotherm (T = 303 K, miswak dosage = 1.0 g/L, [MB]i = 16 - 150 mg/L, pHi = 10.6, V = 0.005 L). Copyright © 2011 SciRes. JEP  Equilibrium Isotherms and Kinetic Studies of Removal of Methylene Blue Dye by Adsorption onto Miswak Leaves 823 as a Natural Adsorbent Table 3. Comparison of the maximum monolayer adsorp- tion of MB onto various adsorbents. Adsorbents qm (mg/g) References Miswak leaves 200 This study Natural Jordanian tripoli 16.6 [1] Banana peel 20.8 [15] Orange peel 18.6 [15] Activated carbon prepared from oil palm shell 243.90 [37] Activated furniture (850˚C) 200 [38] Activated tyres (850˚C) 130 [38] Activated sewage char (800˚C) 120 [38] Pyrolysed furniture 80 [38] bamboo-based activated carbon 454.2 [23] Pineapple leaf powder (PLP) 294.26 [39] 3.5.1. Ps e u do First-Order Equation The rate cadsorption ie prder equation given anged Svehich expresse follows: onstant of s determind from the seudo first-oby Lrgren an nska (1898) [15], wd as 1 k loglog 2 et e qq q t 7) wthe amounts of the MB aed ( time t (), respectively, at adsorptioin−1). were calcu from tpe alots of s t rffert conc he rat the v were low and valu is showsrption of kinetics. .303 ( here q and t q are e mg/g) at equilibri dsorb um and at nd k is the rate constan min n (m 1 Values of k and 1e nd the intercept of the p q en latedhe slo lo et entrations (Figure f R2 es do not agree well tadso gqqversu espectively at di9). T esults in Table 4 show thalues o the experimental e q he calculated values. Th with t th hat the e MB onto miswak is not first-order 3.5.2. Ps e udo-Second-Order Rate Equation Equation of pseudo second-order based on equilibrium adsorption [22-23] can be expressed as: 2 2 d d q et t kq q (8) or 2 2e xq 11 te tt k qq (9) where, 2 k (g/mg·min) is the adsorponstant of pseudo second-order adsorption rate. The value of e q and 2 k can be from the slope and intercept of the plot of tion rate c t t q versus t respectively. The results in Figure 10 show linear plots for all different initial conce Figure 9. Pseudo-first-order kinetics for the adsorption proce (T = 303 K, miswak dosage =1.0 g/L, [MB]i = 16 ss -150 mg/L, pHi = 10.6, V = 0.005 L). Figure 10. Pseudo-second order kinetics for the adsorptio tudied with very high values of R (Table 4) in addition to the good agreement between experimental and calcu- lated values of . Therefore, the adsorption of MB onto miswak isly represented by the pseudo sec- ond-order kinetics. Moreover, adsorption process of MB onto different natural adsorbents such as a pineapple leaf powder (PLP) undergoes second-order kinetics [40]. 3.5.3. Intraparticle Diffusion Study In order to investigate the mechanism of the MB adsorp- tion onto miswak, intra-particle diffusion based mecha- nism was studied. It is proposed that the uptake of the adsorbate (MB dye) by the adsorbent (miswak leaves) r sorption system as: a tra-part diffusion rate constant (g/g·m). The n process (T = 303 K, miswak dosage = 1.0 g/L, [MB]i = 16 -150 mg/L, pHi = 10.6, V = 0.005 L). 2 s e q great varies almost proportionately with the square root of the contact time (t1/2). Weber and Morris [15,24] proposed the most-widely applied intra-particle diffusion equation fo 1/2 tid qkt (10) where, t q is the mount of MB dye adsorbed per unit mass of adsorbent (mg/g) at a time t and id k the in- −1/2 iclem in ntrations Copyright © 2011 SciRes. JEP  Equilibrium Isotherms and Kinetic Studies of Removal of Methylene Blue Dye by Adsorption onto Miswak Leaves as a Natural Adsorbent Copyright © 2011 SciRes. JEP 824 oce d-order kinetic model ss (miswak dosage = 1.0 g/L, [MB] = 16 - 150 mg/L, T = 303 Secon Table 4. Adsorption kinetic parameters for the adsorption pr K, pH 10.6 and V = 0.005 L). First-order kinetic model R2 SSE qe, cal k2 R2 SSE [MB] q, exp q, cal 0ee k1 16 8.93 7.18 –0.1059 0.956 1.87 9.524 0.025 0.997 0.54 30 16.40 13.18 –0.0852 0.99 60 31.68 28.97 –0.1175 0.97 90 44.66 86.90 –0.1819 0.9 3 7 12 31.48 50.00 0.0031 0.996 4.77 150 62.69 84.14 –0.1497 0.937 49.50 71.43 0.0025 0.994 7.82 3.22 17.86 0.0096 0.998 1.30 18.50 34.48 0.0062 0.996 2.51 120 60.90 62.23 –0.1128 0.901 47.71 66.67 0.0023 0.991 5.16 Units used for the above terms are a = mg/g, k1 = min-1, SSE = %, k2=g/mg·min-1. rate parameter f stage i iained e slop of thraight versus If the intra-pffusione mech of th adstion proceen the plvwi be lar and iflot passe t the the limitingss is onthtic difn [41]. Oise, someon e range. cle , 0 s follow: [MB]0 = (mg/L), qe id ok line of a s obt 1/ from the e stt q i is th 2 t. rticle danisme orpss, thot of ersus 1/ t2 n, ar al t q ugh to er m ht ll ine the ps throhe origin rate procely duee intra-ple fusiotherwe othchanismg with the intra-particle diffusion is also involved [2]. igure 11 presented the intra-particle diffusion model. F The results indicated that the plot of t q versus 1/2 t were not linear over the whole timFurthermore, it Figure 11. Intra-particle diffusion plot for the adsorption process (miswak dosage = 1.0 g/L, [MB] = 16 - 150 mg/L, T = 303 K, pH 10.6 and V = 0.005 L). may be seen that the intra-particle diffusion of MB dye occurred in 2 stages. The first straig portion is attrib- uted to the macropore diffusion (phase I) and the second linear portion is attributed to micro-pore diffusion (phase II) [41]. The intra-particle diffusion constants for these 2 stages (1d k and 2d k) are given in Table 5. Results in- dicated that the adsorption of MB dye onto miswak in- volved more than one process, and the intra-parti transport is not the rate-limiting step. Such finding is similar to that made in previous works on adsorption [2]. In addition, the rate constants of the intra-particular dif- fusion on miswak were slow and increased by the in- crease in [MB]0, hence MB dye as a big molecule, dif- fused slowly among the particles during the adsorption process. Similarly Jadhav, D. N. et al. [41], reported slow rate of sorption in case of big molecules such as acidic, basic and disperse dyes on sawdust, polymerized sawdust and sawdust carbon respectively. On the other hand, the sorption rate was generally fast and the intra-particle diffusion was the rate-limiting step in case of sorption of metal ions [42] and sorption of different dyes onto banana and orange peels [15]. 3.6. Validity of Kinetic Models The applicability of both pseudo-first order and pseudo- second order models for the adsorption of MB onto miswak were verified at different [MB] using the sum of Table 5. Weber-Morris parameters (miswak dosage = 1.0 (mg/L) (mg/g·min ) (mg/g·min ) g/L, [MB] = 16 - 150 mg/L, T = 303 K, pH 10.6 and V = 0.005 L). [MB]0, K1d –1/2 R2 K2d –1/2 R2 16 1.413 0.971 –0.027 0.884 30 2.872 0.989 0.327 0.884 60 5.944 0.973 0.276 0.884 90 9.208 0.972 0.051 0.884 120 11.200 0.958 –0.138 0.884 150 10.880 0.952 0.172 0.884 squared error (SSE, percentage ) equation [23] given by: 2 ,exp ,eecal qq SSE N (11) where, N is the number of data po ints used in the linear lot ofh model. The validity of these models was o models listed in Table 3. It is indicated that p eac compared by judging the low value of ,%SSE which indicates the better fit. The values of (,%SSE ) obtained for the tw  Equilibrium Isotherms and Kinetic Studies of Removal of Methylene Blue Dye by Adsorption onto Miswak Leaves 825 as a Natural Adsorbent th-secorder kinc modellded the- e35 to 7.81e first- ordry hilues of ( 49.agith tevious b2 and taearliethe psdr (Ta fuprovepseudo- sec dee the ps ms reptrptioMB obood ct [23]. energy (G˚) can be ca follouations [2]; e pseudond-oeti yie low st SSE,% odel le This ,ecal ob 3) to rder of MB onto for ivated carbon 3.7. Standar Standard free wing eq values (0.59). Whereas, th er md to vegh va ,%SSE 1.87 to 50).rees whe pr values of econ tion similar trend m lcul oth R qined r for eudo-s orde ble rther the suitability of the ond-okinetic to iswak leaves. Also, a scribadsorp roces wa ortedhe adson of nto ba-base a d Free Energy Change (G˚) ated from the ln C GRTK (12) e C e q KC (13) where, T is the temperature (K), R is gas constant (kJ/mol·K), C (L/g) is the standard thermodynamic equi constant, e q is the amount of adsorbed MB dye per unit mass of miswak leaves at em (mg/g) and e C is the equilibrium aqueous concentration of MB. The Gibbs free energy change (G˚) is negative indicat- ing that the adsorption process of MB onto miswak is spontaneous. 4. Conclusions The adsorption of MB librium rent ads Also, the eq dlich isothe red by mi mo e rem quilibriu swak leaves wa p pti odele of RL less than unity. s Departme KSA for thei dye onto mis els, the uir-II g/g which is comarable with diffeorbents used for the adsor uilibrium data can be md by Fre- unrm model. The adso voswak leaves with value s asrahi, Biology nt, Fac versity, Jazan, r help studied. Among the three different isotherm mod equilibrium data was best fitted with the Langm equation. The equilibrium capacities based on the Lang- muir analysis was 200 m on of MB dye. rption of MB was fa- Furtherre, the adsorption process ipontaneous fol- lows pseudo-second order kinetics and the mechanism involved more than one process. The present work re- vealed that the miswak leaves are a promising material for thoval of MB dye from aqueous solutions. 5. Acknowledgements The Author is grateful to Dr. Zarrag I. Al-Fif (Vice Dean) and Dr. Yahya S. M of Science, Jazan Uni ulty and support. REFERENCES [1] Y. Bulut, N. Gozubenli and H. Aydın, “Equilibrium and Kinetics Studies for Adsorption of Direct Blue 71 from Aqueous Solution by Wheat Shells,” Journal of Hazard- ous Materials, Vol. 144, No. 1-2, 2007, pp. 300-306. doi:10.1016/j.jhazmat.2006.10.027 [2] A. S. ALzaydien, “Adsorption of Methylene Blue from Aqueous Solution onto a Low-Cost Natural Jordanian Tripoli,” American Journal of Applied Sciences, Vol. 5, No. 1, 2009, pp. 197-208. [3] R. Gong, M. Li, C. Yang, Y. Sun and J. Chen, “Removal of Cationic Dyes from Aqueous Solution by Adsorption on Peanut Hull,” Journal of Hazardous Materials, Vol. 250. 29 121, No. 1-3, 2005, pp. 247- doi:10.1016/j.jhazmat.2005.01.0 ol. 72, No. 4, 1998, pp. 289-302. [5] T. Santhi, S. M, D. Sugirtha1 and K. Mahalaksh Dyes from Aque- Re- ous Solution by Ad- [4] P. C. Vandevivere, R. Bianchi and W. Verstraete, “Treatment and Reuse of Wastewater from the Textile Wet-pro-Cessing Industry: Review of Emerging Tech- nologies,” Journal of Chemical Technology & Biotech- nology, V anonmani, T. Smitha1 mi, “Uptake of Cationic ous Solution by Bioadsorption onto Granular Cucumis Sativa,” Journal of Applied Sciences in Environmental Sanitation, Vol. 4, No. 1, 2009, pp. 29-35. [6] G. Crini, “Kinetic and Equilibrium Studies on the moval of Cationic Dyes from Aque sorption onto a Cyclodextrin Polymer,” Dyes and Pig- ments, Vol. 77, No. 2, 2008, pp. 415-426. doi:10.1016/j.dyepig.2007.07.001 [7] Z. Aksu, “Application of Biosorption for the Removal of Organic Pollutants: A Review,” Process Biochemistry, Vol. 40, No. 3-4, 2005, pp. 997-1026. doi:10.1016/j.procbio.2004.04.008 [8] M. E. Mohammad and S. Muttucum lutants Removed by Electrocoagul aru, “Review of Pol- ation and Electroco- agulation/Flotation Processes,” Journal of Environmental Management, Vol. 90, No. 5, 2009, pp. 1663-1679. doi:10.1016/j.jenvman.2008.12.011 [9] T. M. Elmorsi, Y. M. Riyad, Z. H. Mohamed and H. M. Abd El Bary, “Decolorization of Mordant Red73 Azo Dye in Water Using H2O2/UV and Photo-Fenton Treat- ment,” Journal of Hazardous Materials, Vol. 174, No. 1-3, 2010, pp. 352-358. doi:10.1016/j.jhazmat.2009.09.057 [10] T. Robinson, G. McMullan, R. Marchant and P. Nigam, 4(00)00080-8 “Remediation of Dyes in Textile Effluent: A Critical Re- view on Current Treatment Technologies with a Proposed Alternative,” Bioresource Technology, Vol. 77, No. 3, 2001, pp. 247-255. doi:10.1016/S0960-852 [11] S. J. T. Pollard, G. D. Fowler, C. J. Sollars and R. Perry, “Low-Cost Adsorbents for Waste and Waste-Water Treatment: A Review,” Science of the Total Environment, Vol. 116, No. 1-2, 1992, pp. 31-52. doi:10.1016/0048-9697(92)90363-W [12] V. K. Garg, M. Amita, R. Kumar and R. Gupta, “Basic Dye (Methylene Blue) Removal from Simulated Waste- water by Adsorption Using Indian Rosewood Sawdust: A Copyright © 2011 SciRes. JEP  Equilibrium Isotherms and Kinetic Studies of Removal of Methylene Blue Dye by Adsorption onto Miswak Leaves 826 as a Natural Adsorbent 3, No yepig.2004.03.005 Timber Industry Waste,” Dyes and Pigments, Vol. 6 3, 2004, pp. 243-250. . doi:10.1016/j.d roperties of Salvadora Persica ainst Oral Ca [13] M. I. H. Farooqi and J. G. Srivastava, “The Toothbrush Tree (Salvadora Persica),” Quarterly Journal of Crude Drug, Vol. 8, No. 3, 1968, pp. 1297-1299. [14] E. Noumi , M. Snoussi, H. Hajlaoui, E. Valentin and A. Bakhrouf, “Antifungal P and Juglans Regia L Extracts ag ndida Strains,” European Journal of Clinical Microbiology & Infectious Diseases, Vol. 29, No. 1, 2010, pp. 81-88. doi:10.1007/s10096-009-0824-3 [15] G. Annadurai, S. R. Juang and J. D. Lee, “Use of Cellu- lose-Based Wastes for Adsorption of Dyes from Aqueous Solutions,” Journal of Hazardous Materials, Vol. 92, No. 3, 2002, pp. 263-274. doi:10.1016/S0304-3894(02)00017-1 [16] M. S. El-Geundi, “Color Removal fr by Adsorption Techniques,” Water Re om Textile Effluen search, Vol. 25, No. ts 3, 1991, pp. 271-273. doi:10.1016/0043-1354(91)90006-C [17] M. Y. Miah, K. Volchek, W. Kuang and F. H. Tezel, “Kinetic and Equilibrium Studies of Cesium Adsorption on Ceiling Tiles from Aqueous Solutions,” Journal of Hazardous Materials, Vol. 183, No. 1-3, 2010, pp. 712-717. doi:10.1016/j.jhazmat.2010.07.084 [18] G. Annadurai, M. Chellapandian and M. R. V. Krishnan, “Adsorption of Reactive Dye on Chitin,” Environmental Monitoring and Assessment, Vol. 59, No. 1, 1999, pp. 111-119. doi:10.1023/A:1006072119624 [19] X. Zhao, K. Urano and S. Ogasawara, “Adsorption of Polyethylene Glycol from Aqueous Solution on Mont Rillonite Clays,” Colloid and Polymer Scien mo- ce, Vol. 267, No. 10, 1989, pp. 899-906. doi:10.1007/BF01410338 [20] M. K. munir, Z. N yusuf, H. Abdul, Y. H. Fauzia and F. Rani, “Isotherm Studies for Determination of Removal Capacity of Bi-Metal ( Niger,” Pakistan Journal of Botany, V Ni And Cr) Ions by Aspergillus ol. 42, No. 1, 2008, iii) and Pb(ii) from Solution b ca Tree Leaves,” pp. 593-604. [21] N. T. Abdel-Ghani, R. M. El-Nashar and G. A. El-Chag- haby, “Removal of Cr( Adsorption onto Casuarina Glau y EJEAFChe, Vol. 7, No. 7, 2008, pp. 3126-3133. [22] Y. S. Ho and G. McKay, “Pseudo-Second Order Model for Sorption Processes,” Process Biochemistry, Vol. 34, No. 5, 1999, pp. 735-742. doi:10.1016/S0032-9592(98)00112-5 [23] B. H. Hameed, A. T. M. Din and A. L. Ahmad, “Adsorp- tion of Methylene Blue onto Bamboo-Based Activated Carbon: Kinetics and Equilibrium Studies,” Journal of Hazardous Materials, Vol. 141, No. 3, 2007, pp. 819- 825. doi:10.1016/j.jhazmat.2006.07.049 [24] W. J. Weber Jr. and J. C. Morris, “Kinetic of Adsorption on Carbon from Solution,” Journal of the Sanitary Engi- neering Division, Vol. 89, No. 2, 1962, pp. 31-59. [25] Y. S. Ho, W. T. Chiu and C. C. Wang, “Regression Analysis for the Sorption Isotherms of Basic Dyes on Sugarcane Dust,” Bioresource Technology, Vol. 96, No. 11, 2005, pp. 1285-1291. doi:10.1016/j.biortech.2004.10.021 of Methylene Blue onto Jute Studies,” Journal [26] M. S. Aboul-Fetouh, T. M. Elmorsi, J. M. El-Kady and H. A. El-Adawi, “Water Hyacinth Stems a Potential Natural Adsorbent for the Adsorption of Acid Green 20 Dye,” Environmental Science: An Indian Journal, Vol. 5, No. 4, 2010, pp. 257-266. [27] S. Senthilkumaar, P. R. Varadarajan, K. Porkodi and C. V. Subbhuraam, “Adsorption Fiber Carbon: Kinetics and Equilibrium of Colloid and Interface Science, Vol. 284, No. 1, 2005, pp. 78-82. doi:10.1016/j.jcis.2004.09.027 [28] D. Kavak, “Removal of Boron from Aqueous Solutions by Batch Adsorption on Calcined Alunite Using Experi- mental Design,” Journal of Hazardous Materials, Vol. 163, No. 1, 2009, pp. 308- 314. doi:10.1016/j.jhazmat.2008.06.093 [29] B. H. Hameed, “Grass Waste: A Novel Sorbent for the Removal of Basic Dye from Aqueous Solution,” Journal of Hazardous Materials, Vol. 166, No. 1, 2009, pp. 233 -238. doi:10.1016/j.jhazmat.2008.11.019 [30] A. A. Jalil, S. Triwahyono, S. H. A. Aziz, N. H. Hairom, N. A. Raza Adam, N. D. Rahim, M. li, M. A. Abidin and M. K. Mohamadiah, “Adsorption of Methyl Orange from Aqueous Solution onto Calcined Lapindo Volcanic Mud,” Journal of Hazardous Materials, Vol. 181, No. 1-3, 2010, pp. 755-762. doi:10.1016/j.jhazmat.2010.05.078 [31] M. Dogan and M. Alkan, “Removal of Methyl Violet from Aqueous Solution by Perlite,” Journal of Colloid and Interface Science, Vol. 267, No. 1, 2003, pp. 32-41. doi:10.1016/S0021-9797(03)00579-4 [32] V. C. Srivastava, I. D. Mall and I. M. Mishra, “Charac- terization of Mesoporous Rice Husk Ash (RHA) and Ad- sorption Kinetics of Metal Ions from Aqueous Solution onto RHA,” Journal of Hazardous Materials, Vol. 134, No. 1-3, 2006, pp. 257-267. doi:10.1016/j.jhazmat.2005.11.052 [33] R. L. Uma, V. C. Srivastava, I. D. Mall and D. H. Lataye, “Rice Husk Ash as an Effective Adsorbent: Evaluation of Adsorptive Characteristics for Indigo Carmine Dye,” Journal of Environmental Management, Vol. 90, No. 2, 2009, pp. 710-720. doi:10.1016/j.jenvman.2008.01.002 [34] W. T. Tsai, C. Y. Chang, M. C. Lin, S. F. Chien, H. F. Sun and M. F. Hsieh, “Adsorption of Acid Dye onto Ac- tivated Carbons Prepared from Agricultural Waste Ba- gasse by ZnCl2 Activation,” Chemosphere, Vol. 45, No. 1, 2001, pp. 51-58. doi:10.1016/S0045-6535(01)00016-9 astewater Using Ac-[35] P. K. Malik, “Dye Removal from w tivated Carbon Developed from Sawdust: Adsorption Equilibrium and Kinetics,” Journal of Hazardous Mate- rials, Vol. 113, No. 1-3, 2004, pp. 81-88. doi:10.1016/j.jhazmat.2004.05.022 [36] C. Namasivayam and D. Kavitha, “Removal of Congo Red from Water by Adsorption onto Activated Carbon Copyright © 2011 SciRes. JEP  Equilibrium Isotherms and Kinetic Studies of Removal of Methylene Blue Dye by Adsorption onto Miswak Leaves as a Natural Adsorbent Copyright © 2011 SciRes. JEP 827 00025-6 Prepared from Coir Pith, an Agricultural Solid Waste,” Dyes and Pigments, Vol. 54, No. 1, 2002, pp. 47-58. doi:10.1016/S0143-7208(02) . Hameed, “Adsorp-[37] I. A. W. Tan, A. L. Ahmad and B. H tion of Basic Dye Using Activated Carbon Prepared from Oil Palm Shell: Batch and Fixed Bed Studies,” Desalina- tion, Vol. 225, No. 1-3, 2008, pp. 13-28. doi:10.1016/j.desal.2007.07.005 [38] C. Saniz-Diaz and A. Griffiths, “Activated Carbon from Solid Wastes Using a Pilot Scale Batch Flaming Pyro- lyser,” Fuel, Vol. 79, No. 15, 2000, pp. 1863-1871. doi:10.1016/S0016-2361(00)00052-1 [39] C. H. Weng, Y. T. Lin and T. W. Tzeng, “Removal of Methylene Blue from Aqueous Solution by Adsorption onto Pineapple Leaf Powder,” Journal of Hazardous Ma- terials, Vol. 170, No. 1, 2009, pp. 417-424. doi:10.1016/j.jhazmat.2009.04.080 [40] S. J. Allen, G. Mckay and K. Y. H. Khader, “Intraparticle Diffusion of a Basic Dye during Adsorption onto Sphag- num Peat,” Environmental Pollution, Vol. 56, No. 1, 1989, pp. 39-50. doi:10.1016/0269-7491(89)90120-6 dsorption Kinetics Mechanism of Some [41] D. N. Jadhav and A. K. Vanjara, “A Study: Removal of Dyestuff Effluent Using Sawdust, Polymerized Sawdust and Sawdust Carbon-II.” Indian Journal of Chemical Technology, Vol. 11, No. 1, 2004, pp. 42-50. [42] M. Prasad and S. Saxena, “Sorption Divalent Metal Ions onto Low-Cost Mineral Adsorbent,” Industrial & Engineering Chemistry Research, Vol. 43, No. 6, 2004, pp. 1512-1522. doi:10.1021/ie030152d
|